yfinance alternatives tested: free stock data APIs compared
Disclosure: I hold long GOOGL shares. I also hold diversified funds (IWDA, QQQ, SPY, VWRL) that may include GOOGL. Positions checked on 14 November 2026.
Affiliate disclosure: some links in this post are affiliate links. If you buy through one, I may earn a commission at no extra cost to you. It does not change what I write about the product.
I went looking for yfinance alternatives for the calls I actually make on Alphabet (GOOGL), and ended up replacing each one and timing it. On 14 November 2026, 7 calls to four sources took 4.7 seconds in total: Market Data for daily prices and options chains, the SEC’s XBRL API and the edgartools library for the income statement and the share count, and FRED for the 10-year Treasury yield. The SEC API and edgartools agreed to the dollar on Alphabet’s third-quarter revenue, $127,577 million, the figure in the 10-Q filed on 29 October 2026.
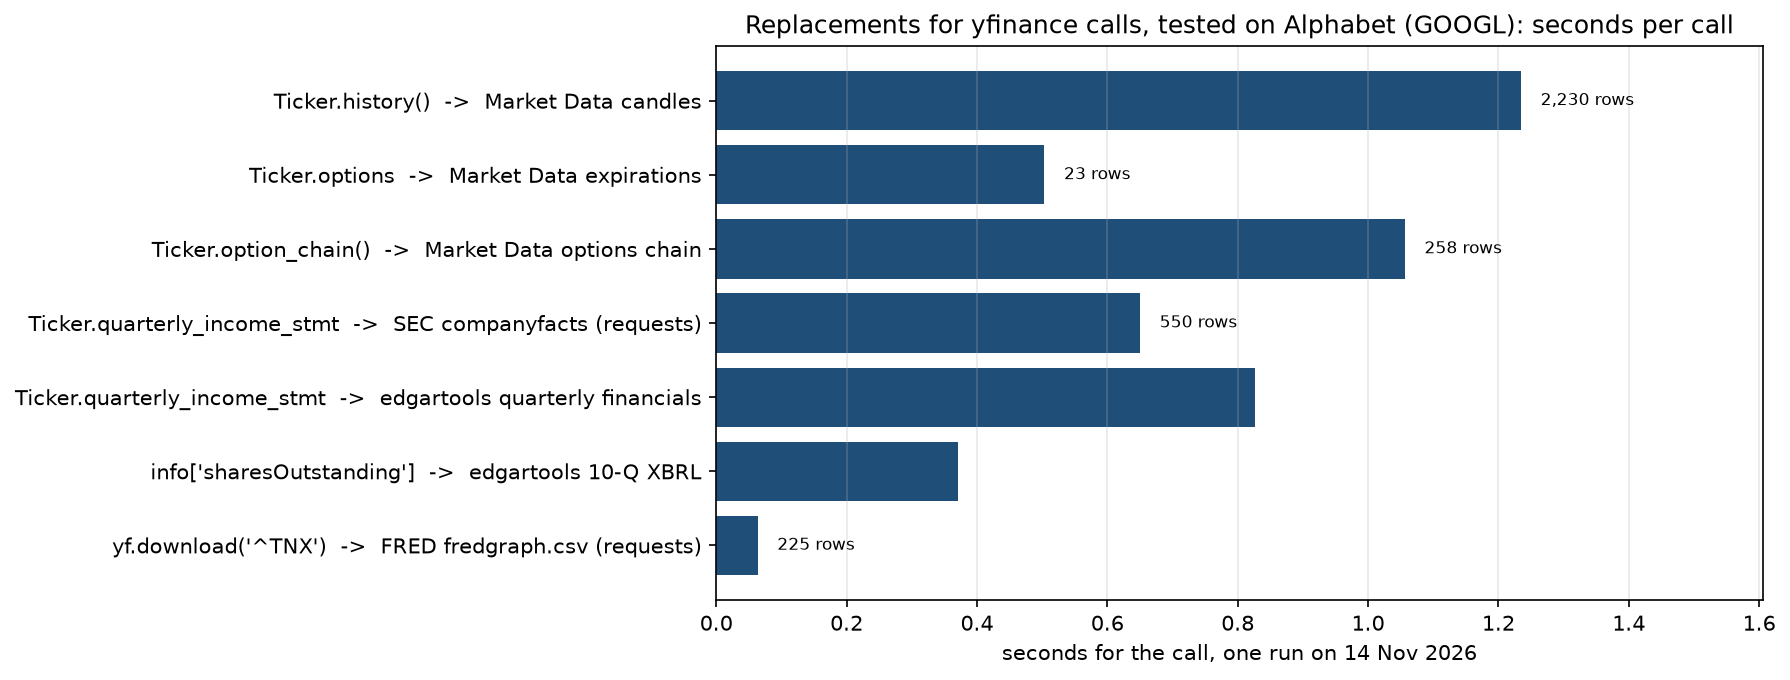
Speed turned out to be the least interesting result; nothing took longer than a couple of seconds. The time went into the small print each replacement came with: a token and a credit budget, an XBRL tag that changed under my feet, a share count split three ways, and a FRED request that hung when I sent it a bare browser header. Each of those showed up on real Alphabet data, so here they are, call by call.
The yfinance alternatives, call by call
| yfinance call | Replacement tested | Key needed | What the test returned for GOOGL |
|---|---|---|---|
Ticker.history() | Market Data stocks.candles | Market Data token | 2,230 daily candles since January 2018, adjusted for splits and dividends |
Ticker.options, Ticker.option_chain() | Market Data options.expirations, options.chain | Market Data token | 23 expirations; 258 contracts for 18 December 2026, with implied volatility and Greeks |
Ticker.quarterly_income_stmt | SEC companyfacts API; edgartools | none (contact in the User-Agent) | Q3 2026 revenue of $127,577 million from both |
Ticker.info["sharesOutstanding"] | edgartools on the latest 10-Q’s XBRL | none | 12,294 million shares across three classes |
yf.download("^TNX") | FRED fredgraph.csv | none | 217 daily yield observations through 12 November 2026 |
Step 1: daily prices from Market Data
Install the two libraries with pip install marketdata-sdk-py edgartools. Market Data serves Apple without a token, which covers exactly one company and none of the others you’ll want. For GOOGL, create a free Market Data account and set MARKETDATA_TOKEN to its token. Market Data provides this site’s data access, so the test ran on its Trader plan. Its pricing page gives the free plan 100 API credits a day, one year of history and stock and options data delayed by 24 hours; the candles endpoint charges one credit per 1,000 candles. The history back to 2018 below needs a paid plan; with a free account, move the start date inside the last year.
import io
import os
import time
import requests
import pandas as pd
import matplotlib.pyplot as plt
from matplotlib.patches import Patch
from marketdata import MarketDataClient  # pip install marketdata-sdk-py
from edgar import Company, set_identity  # pip install edgartools

# Market Data serves AAPL without a token; GOOGL needs one. Set yours first:
#   export MARKETDATA_TOKEN=YOUR_TOKEN
client = MarketDataClient(token=os.environ.get("MARKETDATA_TOKEN"))
# The SEC asks every script to identify itself. Set your own contact first:
#   export SEC_USER_AGENT="Your Name you@example.com"
HEADERS = {"User-Agent": os.environ["SEC_USER_AGENT"]}
set_identity(os.environ["SEC_USER_AGENT"])

results = []  # one row per replaced yfinance call


def timed(call, source, fn, count=len):
    """Run fn, time it, and record how many rows or facts came back."""
    start = time.perf_counter()
    out = fn()
    seconds = time.perf_counter() - start
    rows = count(out)
    results.append({"yfinance call": call, "replacement": source, "seconds": seconds, "rows": rows})
    shown = "" if rows is None else f"{rows:>6,} row" + ("s" if rows != 1 else "")
    print(f"{call:<28} {source:<34} {seconds:5.2f} s {shown}")
    return out
def candles(ticker, start, end, **adjust):
"""Daily candles from Market Data; raises instead of returning an error object."""
df = client.stocks.candles(ticker, resolution="D", from_date=start, to_date=end,
output_format="dataframe", **adjust)
if not isinstance(df, pd.DataFrame):
raise RuntimeError(f"Market Data returned {type(df).__name__}")
df.index = df.index.tz_localize(None).normalize()
return df
prices = timed("Ticker.history()", "Market Data candles", lambda: candles("GOOGL", "2018-01-01", "2026-11-13"))
print(f"{prices.index[0]:%Y-%m-%d} to {prices.index[-1]:%Y-%m-%d}, columns {list(prices.columns)}")
# asking for split-unadjusted prices alone is refused, and the SDK does not raise
bad = client.stocks.candles("GOOGL", resolution="D", from_date="2022-07-14", to_date="2022-07-19",
adjust_splits=False, output_format="dataframe")
print("adjust_splits=False alone returns:", type(bad).__name__)
# raw closes, both adjustments off; the ratio raw/adjusted shows every adjustment applied
raw = candles("GOOGL", "2018-01-01", "2026-11-13", adjust_splits=False, adjustdividends=False)
factor = (raw["c"] / prices["c"]).dropna()
step = factor / factor.shift()
split_day = step.idxmin()
small_steps = step[((step - 1).abs() > 5e-4) & (step.index != split_day)]
print(f"raw/adjusted: {factor[:split_day].iloc[-2]:.4f} before {split_day:%Y-%m-%d}, {factor[split_day]:.4f} on it")
print(f"other steps: {len(small_steps)}, first {small_steps.index[0]:%Y-%m-%d}, last {small_steps.index[-1]:%Y-%m-%d}")
fig, (ax, ax2) = plt.subplots(2, 1, figsize=(9, 6.5), height_ratios=[1.3, 1])
ax.plot(factor.index, factor, color="#1f4e79", lw=1.4)
ax.set_yscale("log")
ax.axvline(split_day, color="#c0504d", ls="--", lw=1)
ax.annotate(f"20-for-1 split: first split-adjusted\nsession {split_day:%d %b %Y}", (split_day, 4),
xytext=(pd.Timestamp("2018-06-01"), 3), arrowprops={"arrowstyle": "->", "color": "#c0504d"})
ax.set_title("Alphabet (GOOGL): raw close divided by Market Data's adjusted close, 2018 to 2026")
ax.set_ylabel("factor (log scale)")
ax.grid(alpha=0.3, which="both")
after = factor[split_day:]
ax2.step(after.index, after, where="post", color="#1f4e79", lw=1.4)
ax2.plot(small_steps.index, after[small_steps.index], "o", color="#e39b3b", ms=4, label="dividend adjustment steps")
ax2.set_title("The same factor after the split: one step per dividend adjustment", fontsize=10)
ax2.set_ylabel("factor")
ax2.legend(loc="upper right", frameon=False, fontsize=8)
ax2.grid(alpha=0.3)
ax2.text(1, -0.2, "Computed from Market Data (marketdata.app) daily candles", transform=ax2.transAxes, ha="right",
fontsize=8)
fig.tight_layout()
plt.savefig("googl-adjustment-factor.png", dpi=150, bbox_inches="tight")
plt.close()Ticker.history() Market Data candles 1.23 s 2,230 rows
2018-01-02 to 2026-11-13, columns ['o', 'h', 'l', 'c', 'v']
adjust_splits=False alone returns: MarketDataClientErrorResult
raw/adjusted: 20.1903 before 2022-07-18, 1.0095 on it
other steps: 10, first 2024-06-10, last 2026-09-04That’s 2,230 trading days in 1.2 seconds. Before you compute a single return, check what “close” means here. Market Data’s daily candles are CRSP-adjusted for splits and dividends by default, and the second request shows it without printing a single price. Divide the raw close by the adjusted close and you get the adjustment applied on each day. For Alphabet that factor sits at 20.19 on the last session before the 20-for-1 split, effective 15 July 2022 according to the 10-Q for that quarter, and drops to 1.01 on 18 July, the first split-adjusted session. The 20 is the split. The rest is dividends, which show up as 10 smaller steps later on, the first in June 2024.
Ask for split-free prices with adjust_splits=False alone and the API refuses, because it doesn’t do dividend-only adjustment; you have to switch both off. The SDK doesn’t raise on that refusal either. It logs an error and hands back a MarketDataClientErrorResult object where your DataFrame should be, which is why the candles helper checks the type and raises. Without that check, the first df["c"] fails with TypeError: 'MarketDataClientErrorResult' object is not subscriptable, which says nothing about the parameter that caused it.
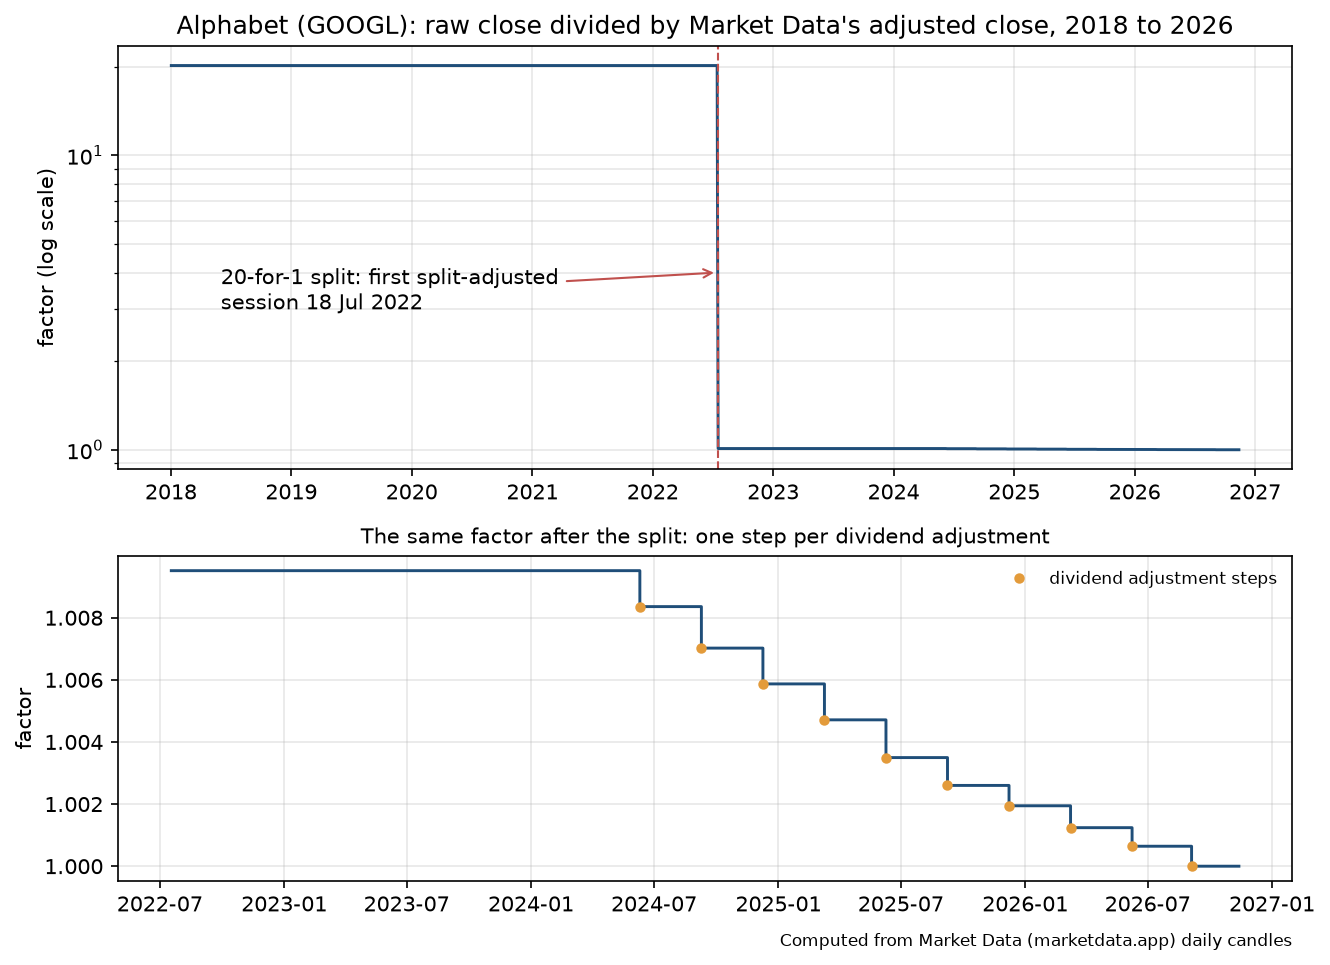
If you need the dividends themselves, the gap between the adjusted and raw series gives them back; the portfolio rebalancing post recovers every Alphabet dividend that way and checks it against the filings.
Step 2: options chains
expirations = timed("Ticker.options", "Market Data expirations",
                    lambda: client.options.expirations("GOOGL", output_format="dataframe"))
chain = timed("Ticker.option_chain()", "Market Data options chain",
              lambda: client.options.chain("GOOGL", expiration="2026-12-18", output_format="dataframe"))
print(f"{len(expirations)} expirations, first {expirations.index[0]:%Y-%m-%d}, last {expirations.index[-1]:%Y-%m-%d}")
print(f"18 Dec 2026 chain: {(chain['side'] == 'call').sum()} calls, {(chain['side'] == 'put').sum()} puts")
print("greeks included:", [c for c in ("iv", "delta", "gamma", "theta", "vega") if c in chain.columns])
Ticker.options Market Data expirations 0.50 s 23 rows
Ticker.option_chain() Market Data options chain 1.06 s 258 rows
23 expirations, first 2026-11-16, last 2029-01-19
18 Dec 2026 chain: 129 calls, 129 puts
greeks included: ['iv', 'delta', 'gamma', 'theta', 'vega']The chain arrives as one DataFrame with both sides, 129 calls and as many puts, and with implied volatility and the Greeks already computed. Watch the credit meter, though. The options chain documentation prices real-time and 15-minute delayed chains at one credit per option symbol, so by that price list this single expiration came to 258 credits, more than two and a half days of the free plan’s allowance. Pulling all 23 expirations bills for every contract returned across them. On the free plan the chain is 24 hours old anyway, which is fine for a weekend notebook and useless for anything intraday.
Step 3: the income statement from SEC EDGAR
Here the alternatives win outright, because the numbers come from the filing itself. The SEC’s EDGAR APIs “do not require any authentication or API keys”, and the fair-access rules ask for a declared User-Agent and at most 10 requests a second. The SEC EDGAR API tutorial on this site covers the endpoints in detail; here’s the one that matters.
def company_facts(cik):
    """Every XBRL fact a company has filed, straight from the SEC."""
    url = f"https://data.sec.gov/api/xbrl/companyfacts/CIK{cik:010d}.json"
    return requests.get(url, headers=HEADERS, timeout=30).json()


def quarterly_revenue(facts, tags):
    """Three-month revenue under any of the tags; Q4 is the year minus nine months."""
    df = pd.concat([pd.DataFrame(facts["facts"]["us-gaap"][t]["units"]["USD"]).assign(tag=t) for t in tags])
    df = df.sort_values("filed").drop_duplicates(["start", "end"], keep="last")  # latest filing wins
    df["days"] = (pd.to_datetime(df["end"]) - pd.to_datetime(df["start"])).dt.days
    quarters = df[df["days"].between(80, 100)]
    nine = df[df["days"].between(260, 280)][["start", "val"]]
    q4 = df[df["days"].between(350, 380)].merge(nine, on="start", suffixes=("", "_9m"))
    q4 = q4.assign(val=q4["val"] - q4["val_9m"], tag="derived: year minus nine months")
    out = pd.concat([quarters, q4])[["end", "val", "tag"]]
    return out.set_index(pd.to_datetime(out["end"])).sort_index()


facts = timed("Ticker.quarterly_income_stmt", "SEC companyfacts (requests)", lambda: company_facts(1652044),
              count=lambda f: len(f["facts"]["us-gaap"]))
tags = ["RevenueFromContractWithCustomerExcludingAssessedTax", "Revenues"]
for t in tags:
    q = pd.DataFrame(facts["facts"]["us-gaap"][t]["units"]["USD"])
    q = q[(pd.to_datetime(q["end"]) - pd.to_datetime(q["start"])).dt.days.between(80, 100)]
    print(f"{t:<52} {len(q):>3} quarterly facts, {q['end'].min()} to {q['end'].max()}")
revenue = quarterly_revenue(facts, tags)
print(revenue.loc["2024":, ["val", "tag"]].assign(val=lambda d: d["val"] / 1e6).to_string())
sec_q3 = revenue.loc["2026-09-30", "val"]

statements = timed("Ticker.quarterly_income_stmt", "edgartools quarterly financials",
                   lambda: Company("GOOGL").get_quarterly_financials(), count=lambda s: None)
edgar_q3 = statements.get_revenue()
print(f"Q3 2026 revenue: SEC API {sec_q3 / 1e6:,.0f}m | edgartools {edgar_q3 / 1e6:,.0f}m")

recent = revenue.loc["2021":]
colours = {tags[0]: "#e39b3b", tags[1]: "#1f4e79", "derived: year minus nine months": "#9aa5b1"}
fig, ax = plt.subplots(figsize=(9, 4.5))
ax.bar(recent.index, recent["val"] / 1e9, width=60, color=recent["tag"].map(colours))
ax.legend(handles=[Patch(color=c, label=t.replace("ExcludingAssessedTax", "...")) for t, c in colours.items()],
          loc="upper left", frameon=False, fontsize=8)
ax.set_title("Alphabet quarterly revenue from SEC companyfacts, coloured by the XBRL tag behind each bar")
ax.set_ylabel("US$ billion")
ax.text(1, -0.12, "Data: SEC EDGAR companyfacts API, CIK 0001652044", transform=ax.transAxes, ha="right",
        fontsize=8)
ax.grid(axis="y", alpha=0.3)
plt.savefig("googl-revenue-sec-xbrl.png", dpi=150, bbox_inches="tight")
plt.close()
Ticker.quarterly_income_stmt SEC companyfacts (requests) 0.65 s 550 rows
RevenueFromContractWithCustomerExcludingAssessedTax 44 quarterly facts, 2017-03-31 to 2025-03-31
Revenues 36 quarterly facts, 2014-09-30 to 2026-09-30
val tag
end
2024-03-31 80539.0 RevenueFromContractWithCustomerExcludingAssessedTax
2024-06-30 84742.0 Revenues
2024-09-30 88268.0 Revenues
2024-12-31 96469.0 derived: year minus nine months
2025-03-31 90234.0 Revenues
2025-06-30 96428.0 Revenues
2025-09-30 102346.0 Revenues
2025-12-31 113829.0 derived: year minus nine months
2026-03-31 109896.0 Revenues
2026-06-30 119796.0 Revenues
2026-09-30 127577.0 Revenues
Ticker.quarterly_income_stmt edgartools quarterly financials 0.83 s
Q3 2026 revenue: SEC API 127,577m | edgartools 127,577mThe companyfacts file came back in 0.65 seconds with 550 us-gaap concepts, and the first thing it taught me is that Alphabet’s revenue lives under two tags. The 10-Qs and 10-Ks up to the first quarter of 2025 used RevenueFromContractWithCustomerExcludingAssessedTax; later filings moved total revenue to Revenues, which Alphabet also used in its older filings. A script that asks for one tag either stops in March 2025 or starts with gaps, and it does so quietly. Second, the companyfacts revenue series has no standalone three-month Q4 fact, only the full year from the 10-K, so the script derives Q4 as the year minus the nine months to September, the grey bars below. The SEC figure and edgartools agree on Q3 2026 at $127,577 million, and both match the income statement in the 10-Q.
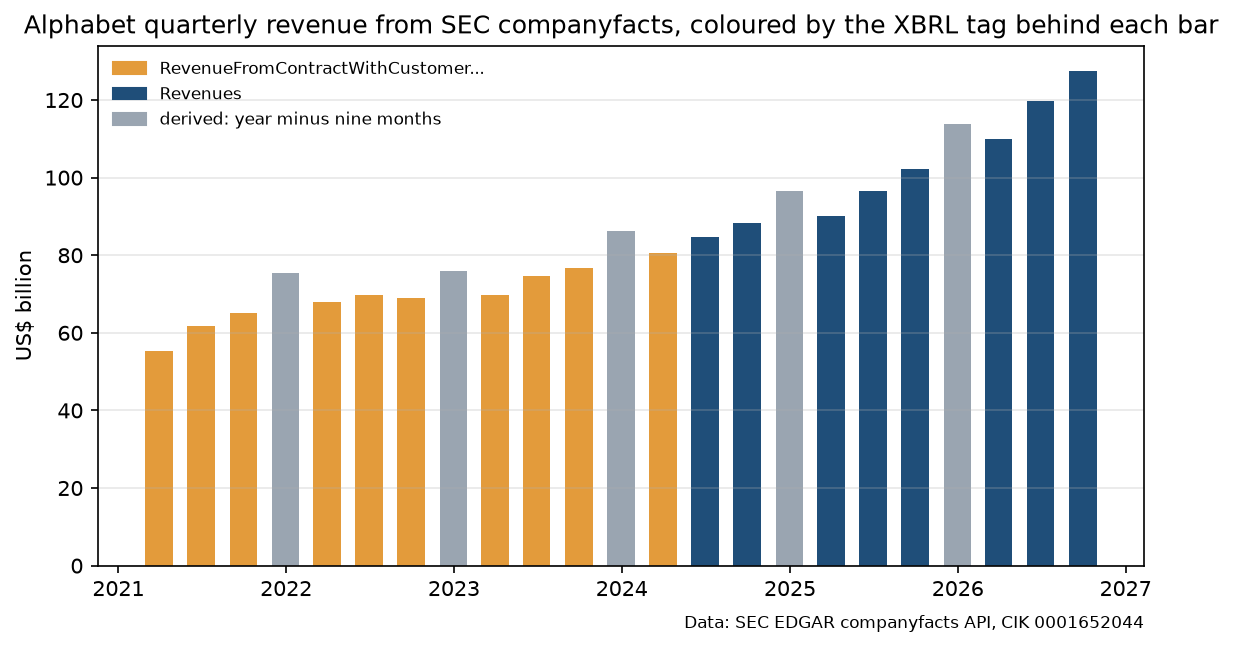
If you’d rather not write the tag logic yourself, edgartools hides it behind get_revenue(), at the price of one more dependency to keep current. The XBRL parser post shows what the raw JSON looks like underneath.
Step 4: shares outstanding for a company with three share classes
print("dei concepts in companyfacts:", list(facts["facts"]["dei"]))

tenq = Company("GOOGL").get_filings(form="10-Q").latest()
xbrl = timed("info['sharesOutstanding']", "edgartools 10-Q XBRL", lambda: tenq.xbrl(), count=lambda x: None)
cover = xbrl.facts.query().by_concept("dei:EntityCommonStockSharesOutstanding").to_dataframe()
classes = {r.context_ref: xbrl.contexts[r.context_ref].dimensions["us-gaap:StatementClassOfStockAxis"]
           for r in cover.itertuples()}
cover["class"] = cover["context_ref"].map(classes).str.split(":").str[1]
cover["shares_m"] = cover["numeric_value"] / 1e6
print(f"10-Q filed {tenq.filing_date}, shares as of {cover['period_instant'].iloc[0]}")
print(cover[["class", "shares_m"]].to_string(index=False))
shares_total = cover["numeric_value"].sum()
print(f"total: {shares_total / 1e6:,.0f}m")
dei concepts in companyfacts: ['EntityPublicFloat']
info['sharesOutstanding'] edgartools 10-Q XBRL 0.37 s
10-Q filed 2026-10-29, shares as of 2026-10-21
class shares_m
CommonClassAMember 5888.0
CommonClassBMember 827.0
CapitalClassCMember 5579.0
total: 12,294mThe share count, a single number in yfinance’s info dictionary, turns into a small puzzle at the SEC. In this test Alphabet’s companyfacts file held a single cover-page fact, EntityPublicFloat, and no EntityCommonStockSharesOutstanding at all, because Alphabet reports that count once per share class. edgartools reads the 10-Q’s own XBRL instead, where the three classes sit as separate facts: 5,888 million Class A, 827 million Class B and 5,579 million Class C shares as of 21 October 2026, the same figures as the cover page of the 10-Q. Add them up and you get 12,294 million. Use one class’s count for a market value and you’ll be off by more than half.
Step 5: the 10-year Treasury yield from FRED
FRED = "https://fred.stlouisfed.org/graph/fredgraph.csv?id=DGS10&cosd=2026-01-01&coed=2026-11-13"


def fred_csv(url, **headers):
    """A FRED series as a DataFrame, downloaded with requests."""
    r = requests.get(url, headers=headers or None, timeout=30)
    return pd.read_csv(io.StringIO(r.text), index_col=0, parse_dates=True)


tsy = timed("yf.download('^TNX')", "FRED fredgraph.csv (requests)", lambda: fred_csv(FRED))["DGS10"]
print(f"DGS10: {len(tsy)} rows to {tsy.index[-1]:%Y-%m-%d}, {tsy.isna().sum()} of them empty (no value that day)")
tsy_rows = len(tsy)
tsy = tsy.dropna()

start = time.perf_counter()
try:
    requests.get(FRED, headers={"User-Agent": "Mozilla/5.0"}, timeout=10)
    browser_ua = "answered"
except requests.exceptions.Timeout:
    browser_ua = "timed out"
print(f"same URL with a bare 'Mozilla/5.0' User-Agent: {browser_ua} after {time.perf_counter() - start:.1f} s")
yf.download('^TNX') FRED fredgraph.csv (requests) 0.06 s 225 rows
DGS10: 225 rows to 2026-11-12, 8 of them empty (no value that day)
same URL with a bare 'Mozilla/5.0' User-Agent: timed out after 10.0 sThe keyless CSV download needs no FRED API key and returned 217 days of DGS10, the 10-year constant-maturity yield the Federal Reserve Board publishes in its H.15 release. It also returned 8 rows with an empty value, days with no yield published, which the code drops before counting. DGS10 is a different series from the ^TNX ticker, so don’t splice the two. Then the odd part. Both downloads go through requests and differ only in the User-Agent: with the library’s default header the file arrived in a fraction of a second, and with a bare Mozilla/5.0 the same URL hung until the 10-second timeout in this run. Send the default header, or an honest one.
Step 6: time every call and chart the results
board = pd.DataFrame(results)
board["label"] = board["yfinance call"] + "  ->  " + board["replacement"]
board = board.iloc[::-1]
fig, ax = plt.subplots(figsize=(9, 4.8))
bars = ax.barh(board["label"], board["seconds"], color="#1f4e79")
for bar, rows in zip(bars, board["rows"]):
    if pd.notna(rows):
        ax.text(bar.get_width() + 0.03, bar.get_y() + bar.get_height() / 2,
                f"{rows:,.0f} row" + ("s" if rows != 1 else ""), va="center",
                fontsize=8)
ax.set_xlabel("seconds for the call, one run on 14 Nov 2026")
ax.set_title("Replacements for yfinance calls, tested on Alphabet (GOOGL): seconds per call")
ax.set_xlim(0, board["seconds"].max() * 1.3)
ax.grid(axis="x", alpha=0.3)
plt.savefig("googl-yfinance-alternatives-scorecard.png", dpi=150, bbox_inches="tight")
plt.close()
print(f"{len(results)} calls in {board['seconds'].sum():.1f} s")

figures = {
    "n_calls": len(results),
    "total_seconds": float(board["seconds"].sum()),
    "price_rows": len(prices),
    "price_seconds": float(results[0]["seconds"]),
    "factor_pre_split": float(factor[:split_day].iloc[-2]),
    "factor_split_day": float(factor[split_day]),
    "n_small_steps": len(small_steps),
    "n_expirations": len(expirations),
    "chain_contracts": len(chain),
    "chain_calls": int((chain["side"] == "call").sum()),
    "sec_q3_revenue": float(sec_q3),
    "edgar_q3_revenue": float(edgar_q3),
    "facts_seconds": float(next(r["seconds"] for r in results if r["replacement"].startswith("SEC companyfacts"))),
    "facts_concepts": len(facts["facts"]["us-gaap"]),
    "shares_total": float(shares_total),
    "shares_a": float(cover.loc[cover["class"] == "CommonClassAMember", "numeric_value"].iloc[0]),
    "shares_b": float(cover.loc[cover["class"] == "CommonClassBMember", "numeric_value"].iloc[0]),
    "shares_c": float(cover.loc[cover["class"] == "CapitalClassCMember", "numeric_value"].iloc[0]),
    "dgs10_rows": len(tsy),
    "dgs10_empty": int(tsy_rows - len(tsy)),
    "browser_ua_timeout": browser_ua == "timed out",
}
7 calls in 4.7 sThe 7 benchmark calls went through timed(), so this block turns the log into the chart at the top of the post. The adjustment check in Step 1 and the header test in Step 5 were extra requests outside it. Times and row counts describe this run on 14 November 2026 and will change when you rerun it: expirations roll off, a new 10-Q replaces the latest one, and the timings move with the network.
What can go wrong
Many companies in one loop. The SEC’s fair-access page caps automated traffic at 10 requests a second and says it may limit request rates further. One companyfacts file per company is cheap; a loop over an index is where a short time.sleep() between companies keeps you under the cap.
“Latest” moves. get_filings(form="10-Q").latest() picks whatever is newest on the day you run it, so after Alphabet’s next 10-Q the share count comes from a different cover page with a different date. Pin the accession number, 0001652044-26-000084 here, when a result has to stay reproducible.
Time zones in the index. Market Data stamps daily candles at midnight US Eastern time. The candles helper strips the time zone so the dates line up with the plain dates from the SEC and FRED when you join them.
What to watch
Alphabet’s 10-K for fiscal 2026 should arrive in early 2027. That filing will show whether Revenues stays the revenue tag, and it’s the one the fourth-quarter derivation in Step 3 depends on; if the tag moves again, the grey bar for Q4 2026 is where it’ll show. On the library side, the test ran on marketdata-sdk-py 1.3.0 and edgartools 5.62.1; a change to the SDK’s error handling or to edgartools’ get_revenue() would show up first in the type check and the Q3 comparison. If you’re still on yfinance, the yfinance rate limit post covers what fixes the 429s, and the Alphabet growth post covers the business behind these numbers.
My longer company research is published on the newsletter Sector Playbook, which is available by email subscription.
Sources
Alphabet, Form 10-Q for the quarter ended 30 September 2026, filed 29 October 2026. SEC, EDGAR application programming interfaces and Accessing EDGAR data. Market Data, candles, options chain and authentication documentation and pricing. Federal Reserve Board via FRED, DGS10. Alphabet, Form 10-Q for the quarter ended 30 June 2022.
Time: 20 minutes. Python 3.12.14, edgar 5.62.1, marketdata 1.3.0, matplotlib 3.11.2, pandas 3.1.0, requests 2.34.2. API key: a Market Data token (free account; history before the last year needs a paid plan); none for the SEC, which asks for a contact in the User-Agent, or for FRED’s CSV download. Tested 14 November 2026.
Disclaimer
This article is general information about a listed company, written for educational purposes. It is not investment advice and not a personal recommendation to buy, sell or hold any security, and it does not take into account anyone’s financial situation or objectives. I am not a registered investment adviser or a licensed financial services provider. Figures come from company filings and the other sources linked in the text, as of the dates given, and may have changed since. I may hold positions in the securities discussed; see the disclosure above. Investment decisions call for independent research or the advice of a licensed professional.
This is my own research, done with the help of AI tools.