How I build a DCF with Claude Code, and where it got numbers wrong
Disclosure: I have no position in GOOGL. I have no position in the other companies discussed (IBKR). I also hold diversified funds (IWDA, QQQ, SPY, VWRL) that may include some of these companies. Positions checked on 29 October 2026.
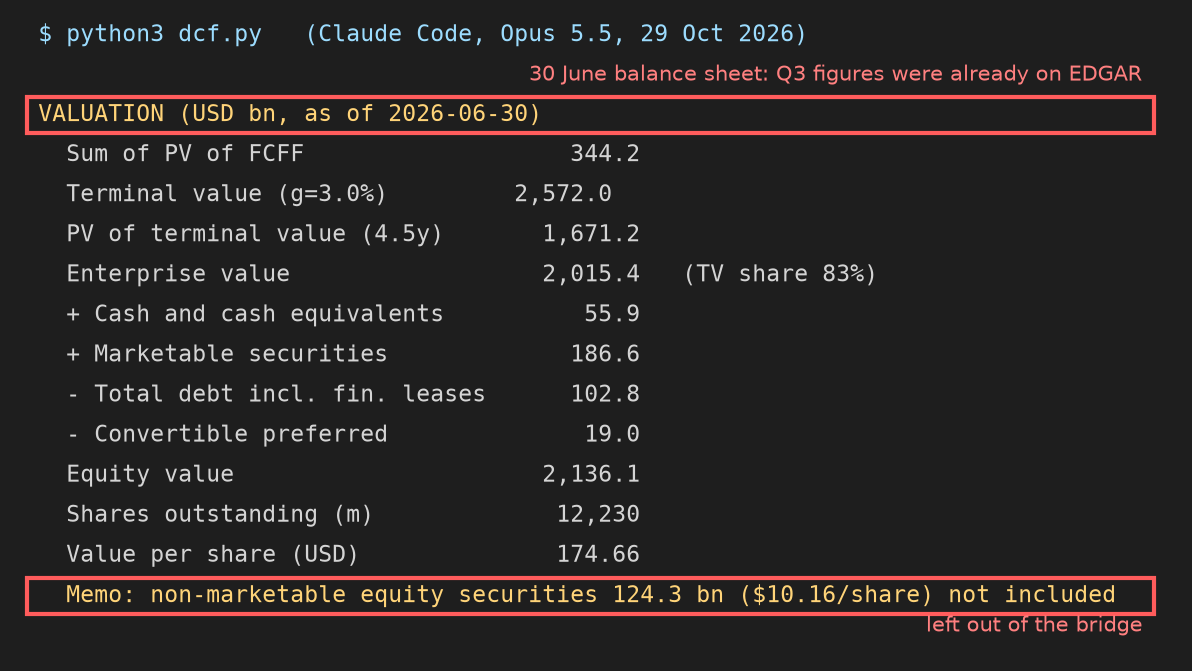
I asked Claude Code to build a financial model of Alphabet from SEC filings, a discounted cash flow valuation all the way to value per share. About three minutes later it had one. It pulled 50 inputs from XBRL, and all 50 matched the filings when I checked them in Python. The arithmetic held up too. The trouble sat in the bridge from enterprise value to value per share. It used a balance sheet that was four months old, the day after Alphabet had published a newer one, and left $131.5 billion of non-marketable securities out.
The setup
I ran Claude Code 2.1.310 with Opus 5.5 in non-interactive mode (claude -p) from an empty folder, with permission prompts switched off so it could fetch data, write files and run them without stopping. I gave it no files. This was the whole prompt:
Build a discounted cash flow model for Alphabet (ticker GOOGL) from its SEC filings.

1. Pull the historical figures from SEC EDGAR's XBRL API (data.sec.gov companyfacts). Send the User-Agent header from the environment variable SEC_USER_AGENT.
2. From the 10-Ks, take fiscal 2021 to 2025: revenue, operating income, income tax expense, pre-tax income, depreciation and amortisation, capital expenditures, operating cash flow and stock-based compensation. From the latest 10-Q, take cash, marketable securities, total debt and the shares outstanding.
3. Forecast free cash flow to the firm for 2026 to 2030. State each assumption (revenue growth, operating margin, tax rate, capex and D&A as a share of revenue, working capital). Derive a WACC and state its inputs. Use a Gordon growth terminal value.
4. Bridge enterprise value to equity value and value per share.
5. Print a sensitivity grid of value per share for WACC and terminal growth.

Write the code to dcf.py and run it. Finish with a summary that lists every input you pulled from the filings with its XBRL concept, period end and value, then the assumptions, then the value per share.
The empty folder was less empty than it looked. Claude Code loads every CLAUDE.md file in the folders above the working directory, and mine sat inside my research notes, whose CLAUDE.md asks for sourced figures and “fair value estimate” wording and for an offer to log each session. It also had my claude.ai connectors, Interactive Brokers among them, and an SEC XBRL skill from my skills folder. All three showed up in the run. It read the skill before doing anything else, fetched a share price for the WACC weights through the Interactive Brokers connector, and took the CLAUDE.md wording, down to a closing offer to log the session in my daily notes. Expect a different run from the same prompt on a clean install.
What the Claude Code financial model produced
It wrote a 268-line dcf.py that uses only the standard library, found the latest 10-Q through the SEC’s submissions API and printed every input with its XBRL concept and accession number. Several of its choices went beyond the prompt. Alphabet has no combined depreciation and amortisation tag, so it used the cash flow line for depreciation and said so. It refused to take a tax rate from the first half of 2026, because pre-tax income in the June 2026 10-Q is swollen by $135.9 billion of gains on equity securities in the first half, and used 17% instead, close to the 2024 and 2025 effective rates. It found the 6.25% mandatory convertible preferred stock Alphabet issued in June and subtracted it at its liquidation preference of $19.0 billion. It valued only the second half of 2026, since the first half was already in the balance sheet, and discounted mid-year.
The first check catches a model that makes numbers up. Compare every figure it reported with the XBRL facts. The functions follow the approach of the SEC EDGAR API tutorial in Python; the dictionaries hold the figures from Claude Code’s summary.
import os
import requests
import pandas as pd
import matplotlib.pyplot as plt

# The SEC asks every script to identify itself. Set your own contact first:
#   export SEC_USER_AGENT="Your Name you@example.com"
HEADERS = {"User-Agent": os.environ["SEC_USER_AGENT"]}
FACTS = requests.get("https://data.sec.gov/api/xbrl/companyfacts/CIK0001652044.json",
                     headers=HEADERS, timeout=30).json()["facts"]["us-gaap"]


def annual(concept, year):
    """Full-year value for fiscal `year` from the latest 10-K that reports it."""
    rows = pd.DataFrame(FACTS[concept]["units"]["USD"])
    rows = rows[(rows["form"] == "10-K") & (rows["end"] == f"{year}-12-31") & rows["start"].notna()]
    days = (pd.to_datetime(rows["end"]) - pd.to_datetime(rows["start"])).dt.days
    return rows[days.between(350, 380)].sort_values("filed")["val"].iloc[-1]


def instant(concept, end="2026-06-30", unit="USD"):
    """Balance-sheet value at `end` from a 10-Q."""
    rows = pd.DataFrame(FACTS[concept]["units"][unit])
    return rows[(rows["form"] == "10-Q") & (rows["end"] == end)].sort_values("filed")["val"].iloc[-1]


# What Claude Code reported in its summary, in $ billions (shares in millions), copied from the run
CLAUDE_ANNUAL = {
    "Revenues": [257.637, None, 307.394, 350.018, 402.836],
    "RevenueFromContractWithCustomerExcludingAssessedTax": [None, 282.836, None, None, None],
    "OperatingIncomeLoss": [78.714, 74.842, 84.293, 112.390, 129.039],
    "IncomeLossFromContinuingOperationsBeforeIncomeTaxesExtraordinaryItemsNoncontrollingInterest":
        [90.734, 71.328, 85.717, 119.815, 158.826],
    "IncomeTaxExpenseBenefit": [14.701, 11.356, 11.922, 19.697, 26.656],
    "Depreciation": [10.273, 13.475, 11.946, 15.311, 21.136],
    "PaymentsToAcquirePropertyPlantAndEquipment": [24.640, 31.485, 32.251, 52.535, 91.447],
    "NetCashProvidedByUsedInOperatingActivities": [91.652, 91.495, 101.746, 125.299, 164.713],
    "ShareBasedCompensation": [15.376, 19.362, 22.460, 22.785, 24.953],
}
CLAUDE_BALANCE = {
    "CashAndCashEquivalentsAtCarryingValue": 55.911,
    "MarketableSecuritiesCurrent": 186.563,
    "LongTermDebtCurrent": 1.999,
    "LongTermDebtNoncurrent": 98.165,
    "CommercialPaper": 0.0,
    "FinanceLeaseLiability": 2.590,
    "EquitySecuritiesWithoutReadilyDeterminableFairValueAmount": 124.259,
}
CLAUDE_COUNTS = {  # (concept, unit, scale): value
    ("CommonStockSharesOutstanding", "shares", 1e6): 12230,
    ("PreferredStockSharesOutstanding", "shares", 1e6): 19.0,
    ("PreferredStockLiquidationPreference", "USD/shares", 1): 1000,
}

checks = []
for concept, values in CLAUDE_ANNUAL.items():
    for year, said in zip(range(2021, 2026), values):
        if said is not None:
            checks.append((f"{concept} FY{year}", said, annual(concept, year) / 1e9))
for concept, said in CLAUDE_BALANCE.items():
    checks.append((f"{concept} 2026-06-30", said, instant(concept) / 1e9))
for (concept, unit, scale), said in CLAUDE_COUNTS.items():
    checks.append((f"{concept} 2026-06-30", said, instant(concept, unit=unit) / scale))
check = pd.DataFrame(checks, columns=["fact", "claude", "xbrl"]).set_index("fact")
check["match"] = (check["claude"] - check["xbrl"]).abs() < 0.0005
print(f"{check['match'].sum()} of {len(check)} figures match XBRL")
print(check[~check["match"]] if not check["match"].all() else "no mismatches")
50 of 50 figures match XBRL
no mismatchesNothing invented, and no year shifted by one.
The assumptions
Before the arithmetic, the inputs it rests on, all of them Claude Code’s. The forecast starts from fiscal 2025 revenue in the 10-K:
| 2026 | 2027 | 2028 | 2029 | 2030 | |
|---|---|---|---|---|---|
| Revenue growth | 20% | 15% | 12% | 10% | 8% |
| Operating margin | 34.0% | 33.5% | 33.0% | 33.0% | 33.0% |
| Capex as a share of revenue | 33% | 28% | 22% | 18% | 15% |
| D&A as a share of revenue | 6.0% | 8.0% | 10.0% | 11.0% | 11.5% |
The tax rate is 17% and the change in working capital is 1% of each year’s revenue increase. The discount rate is a WACC of 10.05%. Its cost of equity of 10.24% comes from the 10-year Treasury yield of 4.99% on 27 October 2026, a beta of 1.05 and an equity risk premium of 5.0%. The model chose the beta, the risk premium and a pre-tax cost of debt of 5.25% itself, without a source. The weights use market values, with a GOOGL share price Claude Code took from Interactive Brokers at 08:02 UTC on 29 October 2026. The terminal value is a Gordon growth value at 3.0% growth, discounted from the end of 2030. The valuation date is 30 June 2026, the date of the balance sheet, and the share count is the 12,230 million common shares outstanding on that date in the 10-Q.
The next block rebuilds the model with the assumptions copied from its dcf.py, to check the arithmetic.
# Claude Code's assumptions, copied from its dcf.py
GROWTH = [0.20, 0.15, 0.12, 0.10, 0.08]
MARGIN = [0.340, 0.335, 0.330, 0.330, 0.330]
CAPEX = [0.33, 0.28, 0.22, 0.18, 0.15]
DA = [0.060, 0.080, 0.100, 0.110, 0.115]
TAX, NWC, G = 0.17, 0.01, 0.03
WACC = 0.100546  # its WACC before rounding; it printed 10.05%


def dcf(wacc=WACC, g=G, base_revenue=annual("Revenues", 2025)):
    """Enterprise value: half of 2026 (from 30 June), 2027-2030 mid-year, Gordon terminal value at end-2030."""
    ev, rev = 0.0, base_revenue
    for i in range(5):
        new = rev * (1 + GROWTH[i])
        fcff = new * MARGIN[i] * (1 - TAX) + new * DA[i] - new * CAPEX[i] - (new - rev) * NWC
        weight, t = (0.5, 0.25) if i == 0 else (1.0, i)
        ev += weight * fcff / (1 + wacc) ** t
        rev = new
    terminal = fcff * (1 + g) / (wacc - g)
    return ev + terminal / (1 + wacc) ** 4.5, terminal / (1 + wacc) ** 4.5


cash = instant("CashAndCashEquivalentsAtCarryingValue") + instant("MarketableSecuritiesCurrent")
debt = (instant("LongTermDebtCurrent") + instant("LongTermDebtNoncurrent") + instant("CommercialPaper")
        + instant("FinanceLeaseLiability"))
preferred = (instant("PreferredStockSharesOutstanding", unit="shares")
             * instant("PreferredStockLiquidationPreference", unit="USD/shares"))
shares = instant("CommonStockSharesOutstanding", unit="shares")

ev, pv_terminal = dcf()
claude_value = (ev + cash - debt - preferred) / shares
print(f"Enterprise value  ${ev / 1e9:,.1f} bn (terminal value {pv_terminal / ev:.0%})")
print(f"Equity value      ${(ev + cash - debt - preferred) / 1e9:,.1f} bn")
print(f"Value per share   ${claude_value:.2f} on {shares / 1e6:,.0f}m shares")
Enterprise value $2,015.4 bn (terminal value 83%)
Equity value $2,136.1 bn
Value per share $174.66 on 12,230m sharesBoth match Claude Code’s printed output at the top: $174.66 per share as of 30 June 2026 on 12,230 million shares, its estimate based on these assumptions. Its own sensitivity grid, one point either side on WACC and terminal growth, runs from $138.52 to $239.41. The terminal value carries 83% of the enterprise value, which puts the weight on where the forecast ends: the 2030 cash flow, after the capex step-down in the table above, and the growth and discount rates applied to it.
Where it got numbers wrong
A balance sheet from the wrong quarter. My prompt said “the latest 10-Q”, and Claude Code found it: the second quarter, filed on 23 July. When it listed Alphabet’s recent filings it kept only 10-Q and 10-K forms, and it noted that “the Q3 10-Q isn’t on EDGAR yet”. The third-quarter numbers were. Alphabet’s earnings release for the quarter to 30 September, filed on 28 October, the day before the run, shows cash and marketable securities of $265.1 billion against $242.5 billion in June, and long-term debt of $125.1 billion against $98.2 billion after notes issued in the quarter for net proceeds of $28.7 billion. Shares outstanding reached 12,294 million, against 12,230 million in June; 36 million of the new shares were sold through Alphabet’s at-the-market programme. The dates inside the model also disagree with each other: a balance sheet from 30 June, a Treasury yield from 27 October and a share price taken at 08:02 UTC on 29 October, before the New York open. Part of this is my prompt. The fix is to ask for the most recent filing of any form with a balance sheet, and for one stated date behind every input.
$131.5 billion left out of the bridge. Its printed output lists $124.3 billion of non-marketable equity securities as a memo line marked “not included”, and its summary says the bridge includes only cash, marketable securities, debt and the preferred, “as you specified”. It read my list of cash, marketable securities and debt as complete. The concept it found is also only part of the balance-sheet line. Alphabet tags “Non-marketable securities” as OtherLongTermInvestments, $131.5 billion at 30 June, $7.2 billion more than the equity securities concept Claude Code reported. Whether the 10-Q’s carrying value is the right number for a valuation is a judgment call. Zero is the one number the 10-Q contradicts.
A basic share count. It divided by the 12,230 million common shares outstanding at 30 June. The second-quarter diluted earnings per share calculation adds 142 million shares for restricted stock units and other contingently issuable shares, a weighted average under the treasury stock method. The model expenses stock-based compensation in its cash flows, which pays for future grants, so the awards already granted belong in the share count. Part of that forecast expense is the remaining cost of these same awards, which makes this fix a conservative one.
investments = instant("OtherLongTermInvestments")  # the balance-sheet line "Non-marketable securities"
equity_only = instant("EquitySecuritiesWithoutReadilyDeterminableFairValueAmount")
awards = pd.DataFrame(FACTS["IncrementalCommonSharesAttributableToShareBasedPaymentArrangements"]["units"]["shares"])
awards = awards[(awards["start"] == "2026-04-01") & (awards["end"] == "2026-06-30")]["val"].iloc[-1]


def per_share(wacc=WACC, g=G, add_investments=True, add_awards=True):
    """Value per share with the two fixes switched on or off."""
    equity = dcf(wacc, g)[0] + cash - debt - preferred + (investments if add_investments else 0)
    return equity / (shares + (awards if add_awards else 0))


steps = {
    "Claude Code": per_share(add_investments=False, add_awards=False),
    "+ non-marketable\nsecurities": per_share(add_awards=False),
    "+ unvested\nawards": per_share(),
}
print(f"Non-marketable securities: balance sheet ${investments / 1e9:.1f} bn, "
      f"Claude's concept ${equity_only / 1e9:.1f} bn")
print(f"Unvested awards in Q2 diluted shares: {awards / 1e6:.0f}m")
for name, value in steps.items():
    print(f"{name.replace(chr(10), ' '):<28} ${value:.2f}")

fig, ax = plt.subplots(figsize=(7, 4))
bars = ax.bar(list(steps), list(steps.values()), color=["#9aa5b1", "#3b6ea5", "#1f3b5c"])
ax.bar_label(bars, fmt="$%.2f")
ax.set_ylabel("Value per share (USD)")
ax.set_title("Alphabet DCF as of 30 June 2026: Claude Code's value and two fixes")
ax.set_ylim(0, max(steps.values()) * 1.15)
plt.savefig("googl-dcf-fixes.png", dpi=150, bbox_inches="tight")
Non-marketable securities: balance sheet $131.5 bn, Claude's concept $124.3 bn
Unvested awards in Q2 diluted shares: 142m
Claude Code $174.66
+ non-marketable securities $185.41
+ unvested awards $183.29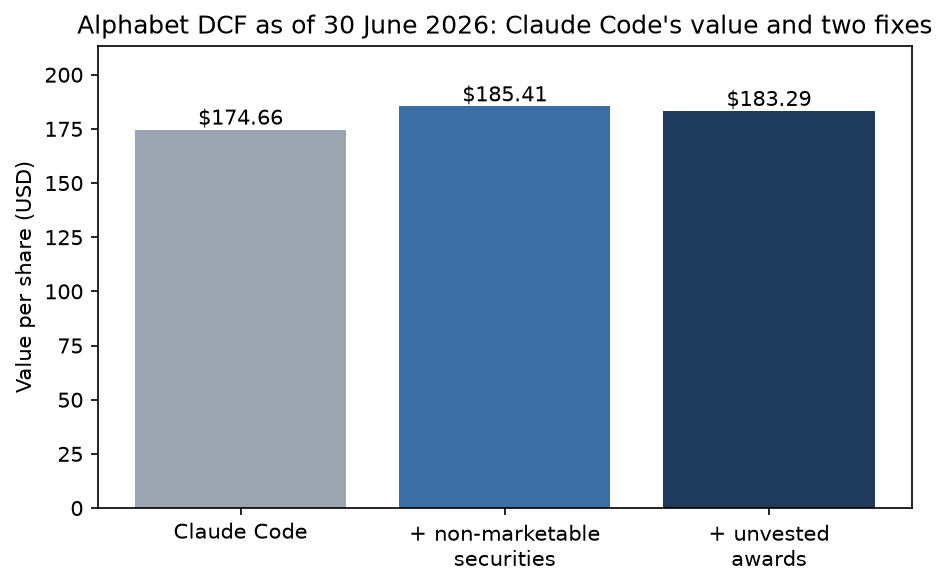
The securities add $10.75 per share and the awards take back $2.13. With both fixes, the value is $183.29 per share as of 30 June 2026, an estimate based on these assumptions, Claude Code’s from the table above. It divides by 12,372 million shares: the 12,230 million common shares plus the 142 million award shares, both from the 10-Q. Neither fix touches the forecast. Both sit in the last few lines of the model, after the cash flows.
Sensitivity
waccs = [WACC + d for d in (-0.01, -0.005, 0, 0.005, 0.01)]
growths = [0.02, 0.025, 0.03, 0.035, 0.04]
grid = pd.DataFrame([[per_share(w, g) for g in growths] for w in waccs],
                    index=[f"{w:.2%}" for w in waccs], columns=[f"{g:.1%}" for g in growths])
print("Value per share (USD): rows WACC, columns terminal growth")
print(grid.round(2))
original = [per_share(w, g, add_investments=False, add_awards=False) for w in waccs for g in growths]
print(f"Claude Code's version without the fixes: ${min(original):.2f} to ${max(original):.2f}")

fig, ax = plt.subplots(figsize=(7, 4.5))
ax.imshow(grid.values, cmap="Blues")
ax.set_xticks(range(5), grid.columns)
ax.set_yticks(range(5), grid.index)
ax.set_xlabel("Terminal growth")
ax.set_ylabel("WACC")
for i in range(5):
    for j in range(5):
        ax.text(j, i, f"${grid.values[i, j]:.0f}", ha="center", va="center",
                color="white" if grid.values[i, j] > grid.values.mean() else "black")
ax.set_title("Alphabet value per share with both fixes, as of 30 June 2026")
plt.savefig("googl-dcf-sensitivity.png", dpi=150, bbox_inches="tight")

figures = {
    "checked": int(len(check)), "matched": int(check["match"].sum()),
    "ev": float(ev), "terminal_share": float(pv_terminal / ev), "claude_value": float(claude_value),
    "shares_m": float(shares / 1e6), "preferred": float(preferred),
    "investments": float(investments), "investments_gap": float(investments - equity_only),
    "awards_m": float(awards / 1e6), "diluted_m": float((shares + awards) / 1e6),
    "fixed_value": float(steps["+ unvested\nawards"]),
    "securities_effect": float(steps["+ non-marketable\nsecurities"] - claude_value),
    "awards_effect": float(steps["+ non-marketable\nsecurities"] - steps["+ unvested\nawards"]),
    "grid_low": float(grid.values.min()), "grid_high": float(grid.values.max()),
    "claude_low": float(min(original)), "claude_high": float(max(original)),
    "wacc_pct": round(WACC * 100, 2), "g": G, "tax": TAX, "equity_only": float(equity_only),
    "h1_gains": float(pd.DataFrame(FACTS["EquitySecuritiesFvNiGainLoss"]["units"]["USD"])
                      .query("start == '2026-01-01' and end == '2026-06-30'")["val"].iloc[-1]),
}
Value per share (USD): rows WACC, columns terminal growth
2.0% 2.5% 3.0% 3.5% 4.0%
9.05% 188.32 199.69 212.94 228.57 247.29
9.55% 176.07 185.78 196.97 210.00 225.38
10.05% 165.37 173.73 183.29 194.30 207.12
10.55% 155.93 163.20 171.44 180.84 191.68
11.05% 147.56 153.92 161.08 169.19 178.44
Claude Code's version without the fixes: $138.52 to $239.41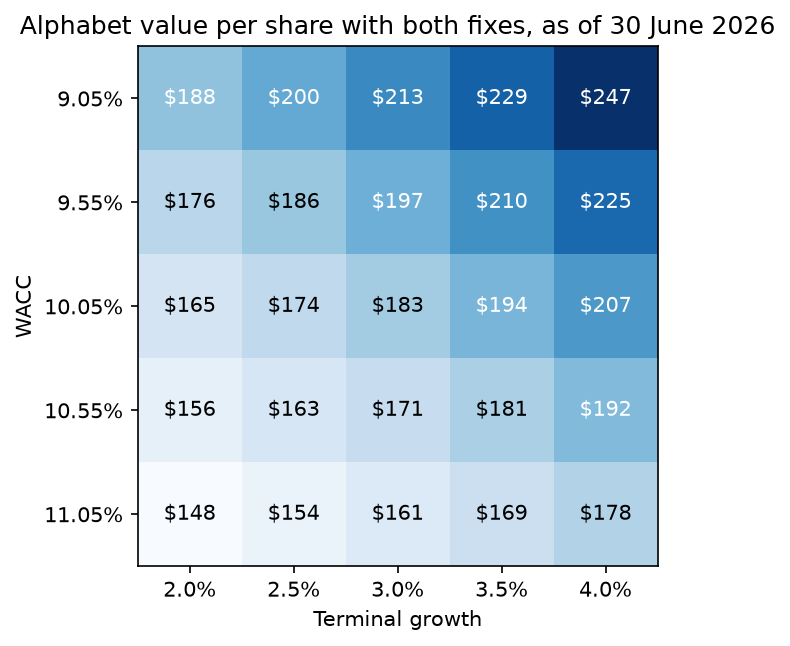
With WACC and terminal growth each moved one point either side, the estimate with both fixes runs from $147.56 to $247.29 per share. Those two inputs move it far more than either fix, and unlike the bridge items they cannot be settled from the 10-Q.
What can go wrong
The failure the first check tests for is invented numbers, and this run had none. One clean run says little about the next one, so keep the check: the comparison costs one request and catches a model that types a figure from memory or shifts a fiscal year.
Stale inputs are the failure this run did have. The companyfacts file holds what filings tagged for the company as a whole, and an earnings release arrives first as an 8-K exhibit: the XBRL in Alphabet’s 28 October 8-K tags only its cover page. Between the release and the 10-Q, a model reading only XBRL works a quarter behind.
Share counts trip models in two ways. The SEC’s XBRL APIs keep only facts that apply to the entire filing entity, so Alphabet’s cover-page share counts, reported per share class, are missing; Claude Code’s first attempt to read them failed with a missing key before it switched to the balance-sheet total. And a per-share value needs a decision on dilution that the prompt should make, or the model will make it quietly.
Context changes the run. CLAUDE.md files, connectors and skills all shaped this one, so record the Claude Code version, the model and what was loaded next to the output. Keep within the SEC’s fair access rules, which ask for a declared User-Agent and at most 10 requests per second, and check the terms of any price feed before you publish what it returned. For the cash flow side in plain Python, the free cash flow tutorial walks through the calculation, and the earlier comparison of LLMs for stock research covers the chat tools.
What to watch
Alphabet’s third-quarter 10-Q will put the 30 September balance sheet into companyfacts. Moving the valuation to that date takes more than changing end in instant(): the award shares come from a new quarter, the preferred and the debt need a fresh look, and the forecast loses a quarter, so the discount periods start three months later. Claude Code releases change what the tool loads and how it runs commands, so the version in the test line below matters. Most of the value rests on where the forecast ends. Claude Code itself named the capex path, from 33% of revenue down to 15%, as the assumption that moves the result most. For the revenue side of the forecast, Alphabet’s growth drivers in Cloud, YouTube and Other Bets are the place to start.
My longer company research is published on the newsletter Sector Playbook, which is available by email subscription.
Sources
Alphabet’s 10-Q for the quarter to 30 June 2026 and its third-quarter 2026 earnings release on SEC EDGAR; the SEC’s EDGAR API documentation; FRED series DGS10; the Claude Code documentation on non-interactive mode, CLAUDE.md files, MCP and connectors and skills.
Tested 29 October 2026 with Claude Code 2.1.310 (Opus 5.5); checking code run with Python 3.12.14, matplotlib 3.11.2, pandas 3.1.0, requests 2.34.2.
Disclaimer
This article is general information about a listed company, written for educational purposes. It is not investment advice and not a personal recommendation to buy, sell or hold any security, and it does not take into account anyone’s financial situation or objectives. I am not a registered investment adviser or a licensed financial services provider. Figures come from company filings and the other sources linked in the text, as of the dates given, and may have changed since. I may hold positions in the securities discussed; see the disclosure above. Investment decisions call for independent research or the advice of a licensed professional.
Valuation figures are estimates based on the stated assumptions, not price targets or recommendations.
This is my own research, done with the help of AI tools.