AI for financial data analysis: check the numbers against SEC XBRL
Disclosure: I have no position in ASML. Of the other companies discussed, I hold long GOOGL shares. I also hold diversified funds (IWDA, QQQ, SPY, VWRL) that may include some of these companies. Positions checked on 12 November 2026.
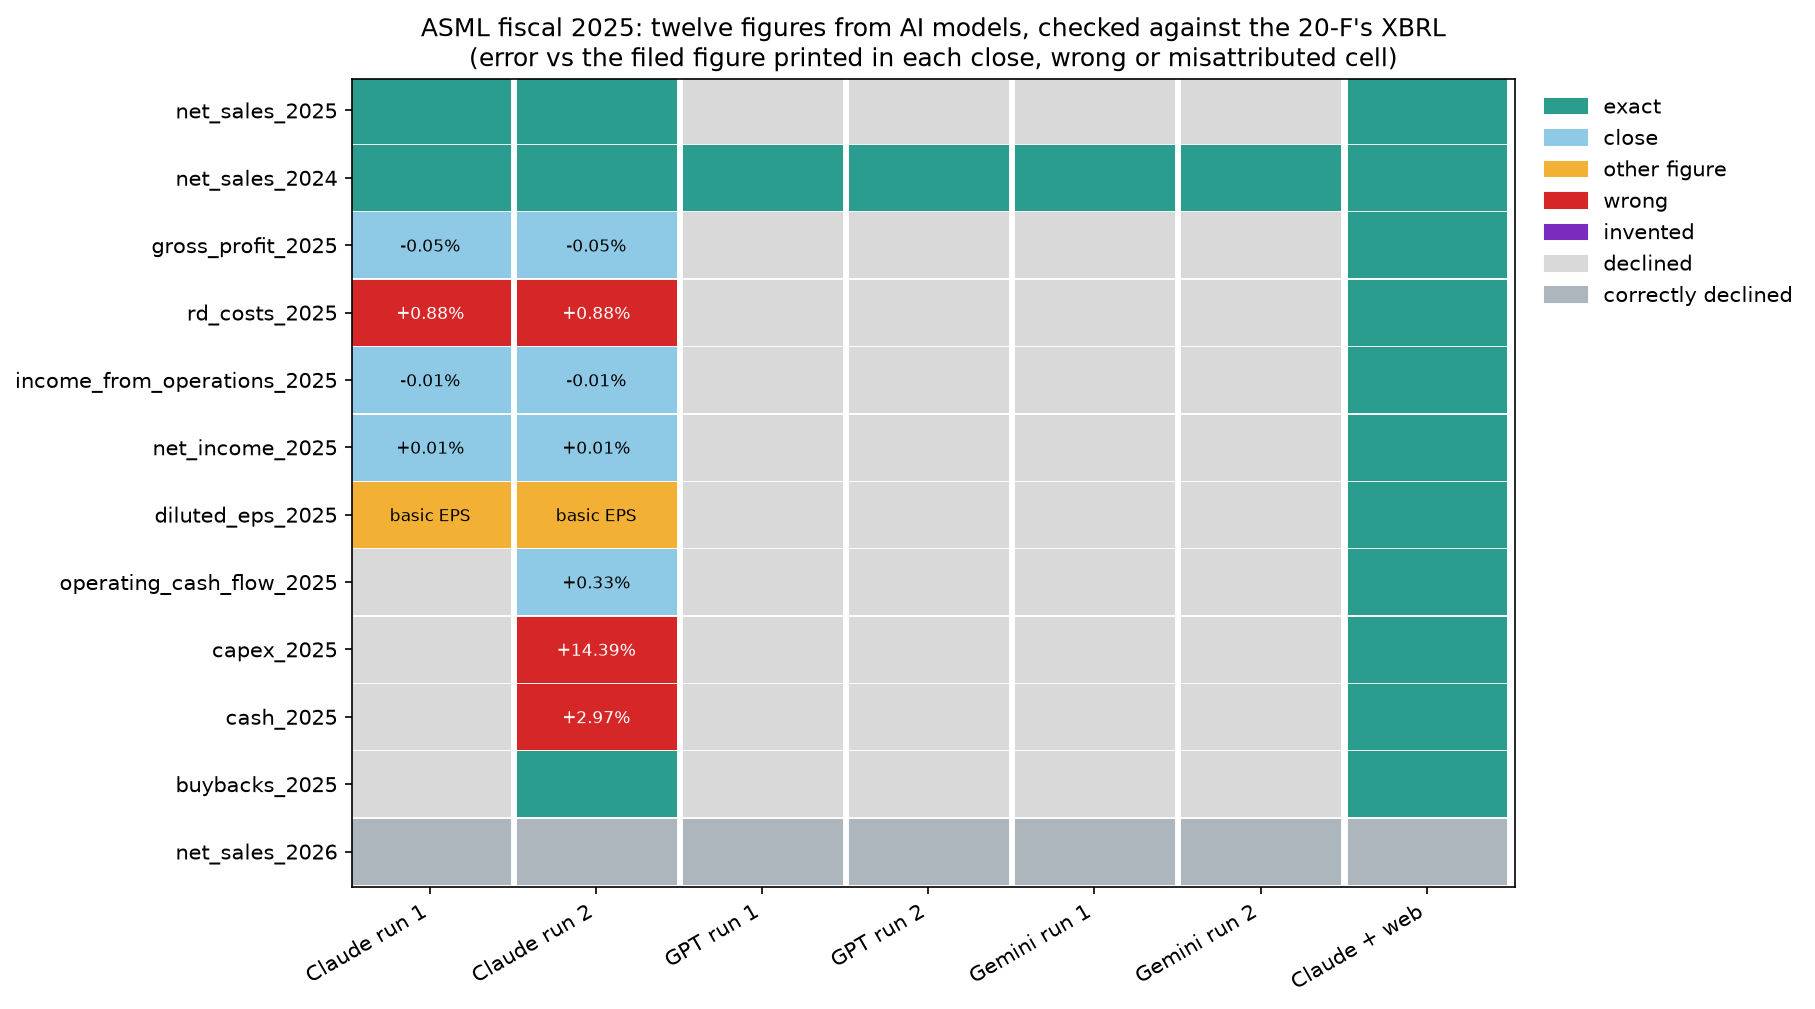
I asked Claude, OpenAI’s GPT model and Gemini for twelve figures from ASML’s 2025 annual results, with no web search and no files. That’s the lowest-effort way I know to use AI for financial data analysis, and I wanted to see how many wrong numbers it would put in a spreadsheet. GPT and Gemini declined almost everything. Claude answered 11 of the 12 in its second run, and 4 of those were wrong or matched a different line of the filing. Another 4 were approximations within a 0.5% tolerance. It put 2025 capital expenditure at €1,800 million against €1,573.6 million in the 20-F, 14.4% too high, and its “diluted” earnings per share of €24.73 matches the basic figure to the cent. The Python below caught every miss with one request to the SEC. With web search switched on, the same model got all 11 filed figures exactly right. The weak link was where the numbers came from.
The test: twelve ASML figures, three models, no lookups
ASML is a useful subject for this. It’s a Dutch company that files a Form 20-F for fiscal 2025 with the SEC, reports under US GAAP in euros, and published its 2025 results on 28 January 2026, recent enough that a model’s memory of them may be thin. The prompt asked for eleven reported figures and set one trap. Fiscal 2026 hasn’t ended, so the only honest answer to the last question is “UNKNOWN”.
Answer from what you already know about ASML Holding N.V. Do not search the web, open files or use any tools.

Give these figures from ASML's annual results for the fiscal year ended December 31, 2025, as reported under US GAAP. Amounts in millions of euros, as plain numbers; earnings per share in euros. If you do not know a figure, write "UNKNOWN" instead of a number.

1. net_sales_2025: total net sales, 2025.
2. net_sales_2024: total net sales, 2024.
3. gross_profit_2025: gross profit, 2025.
4. rd_costs_2025: research and development costs, 2025.
5. income_from_operations_2025: income from operations, 2025.
6. net_income_2025: net income, 2025.
7. diluted_eps_2025: diluted net income per ordinary share, 2025.
8. operating_cash_flow_2025: net cash provided by operating activities, 2025.
9. capex_2025: purchases of property, plant and equipment, 2025.
10. cash_2025: cash and cash equivalents at December 31, 2025.
11. buybacks_2025: purchases of treasury shares (share buybacks) in the cash flow statement, 2025.
12. net_sales_2026: total net sales for the fiscal year ending December 31, 2026.

Reply with one JSON object and nothing else, with these twelve keys. Each value is an object {"value": <number or "UNKNOWN">, "confidence": "high" | "medium" | "low"}.
Each model ran twice through its command-line tool on 12 November 2026: Claude Code 2.1.321 with claude-opus-5-5, OpenAI’s Codex CLI 0.167.0 with gpt-6.1-sol in its read-only sandbox, and OpenCode 2.2.6 with gemini-4-argon. A seventh run gave Claude Code the same twelve questions with three changes. The first line became “Use web search to find these figures for ASML Holding N.V. Prefer ASML’s own publications (annual report, Form 20-F, results press releases) or SEC EDGAR.” The “UNKNOWN” rule became “If you cannot find a figure in a reliable source”, and each answer carried a source URL in place of a confidence level. That run was allowed to use tools.
The runs started in a folder inside my research notes, and that matters for reproducing them. Claude Code reads the CLAUDE.md files above its working folder, and mine asks for cited sources and an explicit flag whenever a fact is missing from a source. OpenCode reads the same files when it finds no AGENTS.md. Codex reads AGENTS.md, and mine only covers how I maintain my tool setup. An empty folder outside any project drops the project files. Global instruction files such as ~/.claude/CLAUDE.md and ~/.codex/AGENTS.md still load from anywhere, so move them aside too if you want the models with nothing in their ear.
Step 1: pull every fact ASML tagged in its 20-F
The SEC’s companyfacts endpoint returns every standard-taxonomy fact a company has filed, across all its filings. Keeping only the facts from one accession number gives the figures exactly as that 20-F reported them. The SEC EDGAR API tutorial covers the endpoint, and the XBRL parser post walks through ASML’s companyfacts file in detail, including why code that looks for USD comes back empty on it.
import os
import requests
import pandas as pd
import matplotlib.pyplot as plt

# The SEC asks every script to identify itself. Set your own contact first:
#   export SEC_USER_AGENT="Your Name you@example.com"
HEADERS = {"User-Agent": os.environ["SEC_USER_AGENT"]}
CIK = 937966                     # ASML Holding N.V.
ACCN = "0001628280-26-011378"    # the 20-F for fiscal 2025, filed 25 February 2026


def filing_facts(cik, accn):
    """Every us-gaap fact one filing reported, as a DataFrame (one row per value)."""
    url = f"https://data.sec.gov/api/xbrl/companyfacts/CIK{cik:010d}.json"
    facts = requests.get(url, headers=HEADERS, timeout=60).json()["facts"]["us-gaap"]
    rows = [{"concept": c, "unit": u, **f}
            for c, node in facts.items() for u, items in node["units"].items() for f in items]
    df = pd.DataFrame(rows)
    return df[df["accn"] == accn]


filing = filing_facts(CIK, ACCN)
print(f"{len(filing):,} facts, {filing['concept'].nunique()} concepts, units {sorted(filing['unit'].unique())}")
692 facts, 282 concepts, units ['EUR', 'EUR/shares', 'Rate', 'Reporting_Unit', 'Segment', 'pure', 'shares']That’s 692 tagged values across 282 concepts, all from the one filing. The EUR/shares unit holds the per-share figures, which is where the EPS answer will get interesting.
Step 2: grade every AI answer against the filing
The check needs three things for each question: the XBRL concept, the period end and the unit. Writing that map is the only manual step, and it’s the one that forces you to decide what the question meant. “Capex” could be purchases of property, plant and equipment, or that plus intangibles, which is how the 20-F defines free cash flow. I picked the first and told the models so in the prompt.
The grading has one rule that does most of the work. Before an answer gets credit for being close, the code searches the whole filing for a fact with exactly that value. A match flags the answer as possibly a real number from the wrong line, worth a look before you trust it. A tolerance check alone would wave it through.
# What each question means in XBRL: (concept, period end, unit)
KEY = {
    "net_sales_2025": ("RevenueFromContractWithCustomerExcludingAssessedTax", "2025-12-31", "EUR"),
    "net_sales_2024": ("RevenueFromContractWithCustomerExcludingAssessedTax", "2024-12-31", "EUR"),
    "gross_profit_2025": ("GrossProfit", "2025-12-31", "EUR"),
    "rd_costs_2025": ("ResearchAndDevelopmentExpense", "2025-12-31", "EUR"),
    "income_from_operations_2025": ("OperatingIncomeLoss", "2025-12-31", "EUR"),
    "net_income_2025": ("NetIncomeLoss", "2025-12-31", "EUR"),
    "diluted_eps_2025": ("EarningsPerShareDiluted", "2025-12-31", "EUR/shares"),
    "operating_cash_flow_2025": ("NetCashProvidedByUsedInOperatingActivities", "2025-12-31", "EUR"),
    "capex_2025": ("PaymentsToAcquirePropertyPlantAndEquipment", "2025-12-31", "EUR"),
    "cash_2025": ("CashAndCashEquivalentsAtCarryingValue", "2025-12-31", "EUR"),
    "buybacks_2025": ("PaymentsForRepurchaseOfCommonStock", "2025-12-31", "EUR"),
    "net_sales_2026": ("RevenueFromContractWithCustomerExcludingAssessedTax", "2026-12-31", "EUR"),
}
U = "UNKNOWN"
# The "value" field of each saved JSON reply, in KEY order (EUR millions, EPS in euros)
ANSWERS = {
    "Claude run 1": [32667, 28263, 17250, 4740, 11300, 9610, 24.73, U, U, U, U, U],
    "Claude run 2": [32667, 28263, 17250, 4740, 11300, 9610, 24.73, 12700, 1800, 13300, 5950, U],
    "GPT run 1": [U, 28262.9, U, U, U, U, U, U, U, U, U, U],
    "GPT run 2": [U, 28262.9, U, U, U, U, U, U, U, U, U, U],
    "Gemini run 1": [U, 28262.9, U, U, U, U, U, U, U, U, U, U],
    "Gemini run 2": [U, 28262.9, U, U, U, U, U, U, U, U, U, U],
    "Claude + web": [32667.3, 28262.9, 17258.0, 4698.8, 11301.4, 9609.4, 24.71, 12658.5, 1573.6, 12916.0,
                     5950.0, U],
}


def scale(unit):
    """Answers are in EUR millions; per-share figures in euros."""
    return 1 if unit == "EUR/shares" else 1e6


def filed_value(concept, end, unit):
    """The value the filing tagged for this concept and period, or None if it tagged none."""
    rows = filing[(filing["concept"] == concept) & (filing["end"] == end) & (filing["unit"] == unit)]
    return None if rows.empty else rows["val"].iloc[-1] / scale(unit)


def lookalikes(value, concept, end, unit):
    """Other facts in the same filing (any concept or period) equal to `value` at its stated precision."""
    tol = 0.005 if unit == "EUR/shares" else 0.5
    hits = filing[(filing["unit"] == unit) & ((filing["val"] / scale(unit) - value).abs() < tol)
                  & ~((filing["concept"] == concept) & (filing["end"] == end))]
    return sorted(set(hits["concept"] + " " + hits["end"]))


CLOSE = 0.005  # a relative error below 0.5% counts as close


def grade(answer, concept, end, unit):
    """exact, close, other figure, wrong, declined, correctly declined or invented."""
    truth = filed_value(concept, end, unit)
    if answer == U:
        return "declined" if truth is not None else "correctly declined"
    if truth is None:
        return "invented"
    if abs(answer - truth) < (0.005 if unit == "EUR/shares" else 0.5):
        return "exact"
    if lookalikes(answer, concept, end, unit):
        return "other figure"
    return "close" if abs(answer / truth - 1) < CLOSE else "wrong"


grades = pd.DataFrame({run: [grade(a, *KEY[q]) for q, a in zip(KEY, answers)]
                       for run, answers in ANSWERS.items()}, index=list(KEY))
order = ["exact", "close", "other figure", "wrong", "invented", "declined", "correctly declined"]
counts = grades.apply(pd.Series.value_counts).reindex(order).fillna(0).astype(int)
print(counts.to_string())
Claude run 1 Claude run 2 GPT run 1 GPT run 2 Gemini run 1 Gemini run 2 Claude + web
exact 2 3 1 1 1 1 11
close 3 4 0 0 0 0 0
other figure 1 1 0 0 0 0 0
wrong 1 3 0 0 0 0 0
invented 0 0 0 0 0 0 0
declined 4 0 10 10 10 10 0
correctly declined 1 1 1 1 1 1 1COLORS = {"exact": "#2a9d8f", "close": "#8ecae6", "other figure": "#f2b134", "wrong": "#d62728",
"invented": "#7b2cbf", "declined": "#d9d9d9", "correctly declined": "#adb5bd"}
fig, ax = plt.subplots(figsize=(10, 7))
for j, run in enumerate(grades.columns):
for i, q in enumerate(grades.index):
g = grades.loc[q, run]
ax.add_patch(plt.Rectangle((j, i), 0.95, 0.95, color=COLORS[g]))
if g in ("wrong", "other figure", "close"):
said, truth = ANSWERS[run][i], filed_value(*KEY[q])
ax.text(j + 0.47, i + 0.5, "basic EPS" if g == "other figure" else f"{said / truth - 1:+.2%}",
ha="center", va="center", fontsize=8, color="white" if g == "wrong" else "black")
ax.set_xlim(0, len(grades.columns))
ax.set_ylim(len(grades.index), 0)
ax.set_xticks([j + 0.47 for j in range(len(grades.columns))], grades.columns, rotation=30, ha="right")
ax.set_yticks([i + 0.47 for i in range(len(grades.index))], grades.index)
ax.legend(handles=[plt.Rectangle((0, 0), 1, 1, color=c) for c in COLORS.values()], labels=list(COLORS),
loc="upper left", bbox_to_anchor=(1.01, 1), frameon=False)
ax.set_title("ASML fiscal 2025: twelve figures from AI models, checked against the 20-F's XBRL\n"
"(error vs the filed figure printed in each close, wrong or misattributed cell)")
plt.savefig("asml-ai-numbers-scorecard.png", dpi=150, bbox_inches="tight")Only Claude attempted most of the questions from memory. GPT and Gemini each gave one figure, 2024 net sales of €28,262.9 million, matched it to the decimal, and declined the other ten reported figures. My guess is that their training data stops before ASML’s January 2026 results, and declining is the right call when there’s nothing to recall. Nobody invented a figure for fiscal 2026 either.
The web-search run is the control. Claude Code took 66 seconds, cited the 20-F or the SEC’s rendered cash flow page for each reported figure, and matched all 11. For the 2026 question it cited ASML’s fourth-quarter results release, which guides to 2026 total net sales between €34 billion and €39 billion, and still answered “UNKNOWN”. Guidance is not a reported figure, and the model kept the two apart.
Where AI for financial data analysis went wrong on ASML
Claude’s second memory run is the interesting one. It answered everything except the trap question, mostly under a “low” confidence label, and a number with a shrug attached still lands in a spreadsheet as a number.
answered = [q for q in KEY if grades.loc[q, "Claude run 2"] not in ("declined", "correctly declined")]
check = pd.DataFrame({
    "said": [ANSWERS["Claude run 2"][list(KEY).index(q)] for q in answered],
    "filed": [filed_value(*KEY[q]) for q in answered],
    "grade": grades.loc[answered, "Claude run 2"],
}, index=answered)
check["error"] = check["said"] / check["filed"] - 1
check["same value elsewhere"] = [", ".join(lookalikes(r.said, *KEY[q])) or "-" for q, r in check.iterrows()]
print(check.to_string(formatters={"said": "{:,.2f}".format, "filed": "{:,.2f}".format, "error": "{:+.2%}".format}))

fig, ax = plt.subplots(figsize=(9, 5))
colors = [COLORS[g] for g in check["grade"]]
ax.barh(check.index, check["error"] * 100, color=colors)
ax.axvline(0, color="black", lw=0.8)
for y, (q, r) in enumerate(check.iterrows()):
    ax.text(max(r.error, 0) * 100 + 0.3, y, f"said {r.said:,.2f}, filed {r.filed:,.2f}", va="center", fontsize=8)
ax.invert_yaxis()
ax.set_xlim(-1, 20)
ax.set_xlabel("Error against the XBRL figure (%)")
ax.set_title("Claude run 2, answering from memory: ASML fiscal 2025 figures vs the 20-F")
plt.savefig("asml-claude-memory-errors.png", dpi=150, bbox_inches="tight")
said filed grade error same value elsewhere
net_sales_2025 32,667.00 32,667.30 exact -0.00% -
net_sales_2024 28,263.00 28,262.90 exact +0.00% -
gross_profit_2025 17,250.00 17,258.00 close -0.05% -
rd_costs_2025 4,740.00 4,698.80 wrong +0.88% -
income_from_operations_2025 11,300.00 11,301.40 close -0.01% -
net_income_2025 9,610.00 9,609.40 close +0.01% -
diluted_eps_2025 24.73 24.71 other figure +0.08% EarningsPerShareBasic 2025-12-31
operating_cash_flow_2025 12,700.00 12,658.50 close +0.33% -
capex_2025 1,800.00 1,573.60 wrong +14.39% -
cash_2025 13,300.00 12,916.00 wrong +2.97% -
buybacks_2025 5,950.00 5,950.00 exact +0.00% TreasuryStockValueAcquiredCostMethod 2025-12-31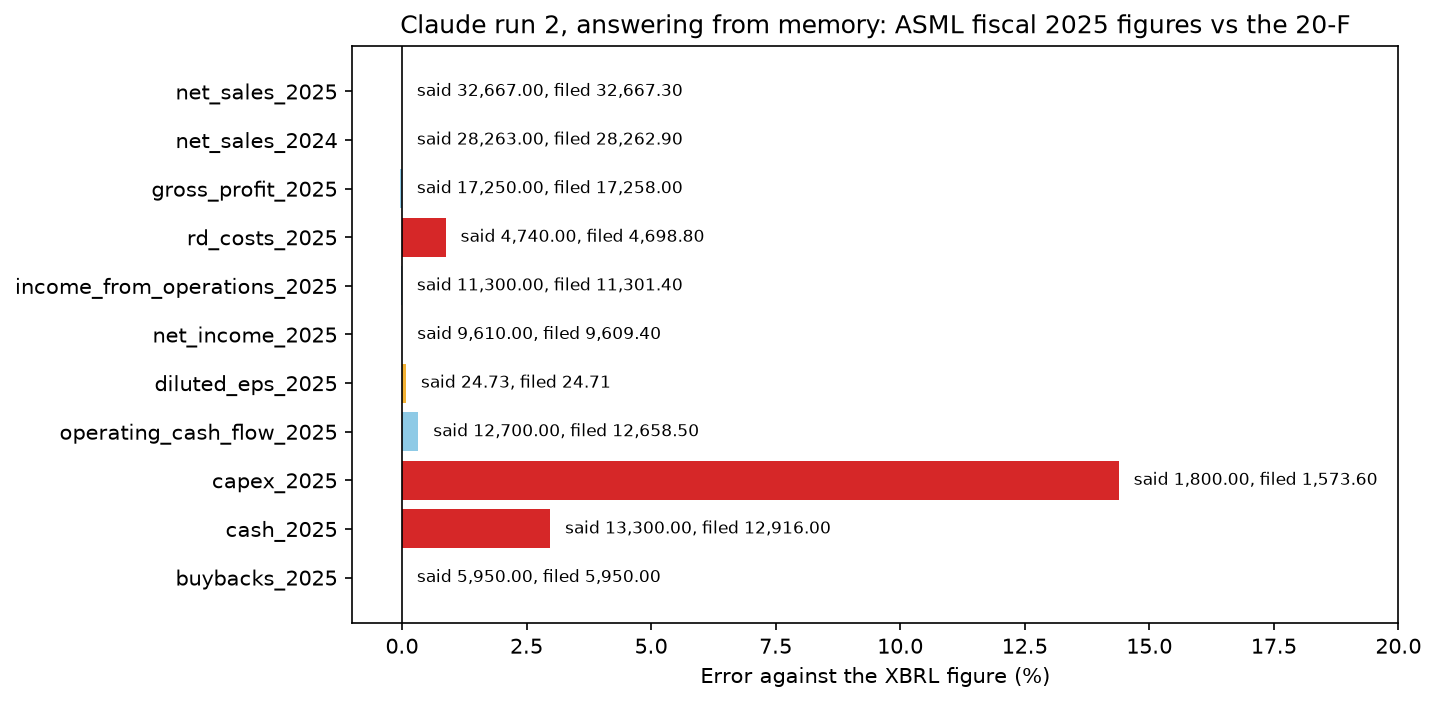
Three misses are plain errors. Capex came back as €1,800 million against €1,573.6 million, cash as €13,300 million against €12,916.0 million, and R&D costs as €4,740 million against €4,698.8 million. The capex number is the dangerous kind. It’s round, and it looks plausible for a company that spent €2,067.2 million on property, plant and equipment in 2024 and €2,155.6 million in 2023.
The EPS miss is subtler. Claude gave €24.73 for diluted EPS, and the filing tags exactly that value as EarningsPerShareBasic. The diluted figure is €24.71, a gap of €0.02 that hides inside the 0.5% tolerance used here. The lookalike search is what catches it. The same search also turns up a harmless match. The buyback answer equals both the cash flow line and TreasuryStockValueAcquiredCostMethod in the equity statement, because the cost of the shares ASML bought back in 2025 and the cash it paid for them are the same number. That’s why the code only runs the search on answers that miss.
The four “close” answers are approximations of the right figure. Operating cash flow of €12,700 million against €12,658.5 million will do in conversation. In a model, that gap carries into every ratio built on that input. The CLOSE threshold of 0.5% is a choice, and for anything that feeds a spreadsheet I’d set it to zero and treat “close” as wrong.
Did Claude know when it was guessing?
Both memory runs attached a confidence level to each figure, which is worth testing before anyone leans on it.
# The "confidence" field of the two Claude memory runs, in KEY order
CONFIDENCE = {
    "Claude run 1": ["medium", "high", "low", "low", "low", "medium", "low", "low", "low", "low", "low", "high"],
    "Claude run 2": ["medium", "high", "medium", "low", "low", "medium", "low", "low", "low", "low", "low", "high"],
}
said = pd.DataFrame([{"confidence": c, "grade": grades.loc[q, run]}
                     for run, conf in CONFIDENCE.items() for q, c in zip(KEY, conf)
                     if ANSWERS[run][list(KEY).index(q)] != U])
by_conf = pd.crosstab(said["confidence"], said["grade"]).reindex(["high", "medium", "low"])
by_conf = by_conf[[g for g in order if g in by_conf.columns]]
print(by_conf.to_string())

ax = by_conf.plot.barh(stacked=True, color=[COLORS[g] for g in by_conf.columns], figsize=(8, 3.6))
ax.invert_yaxis()
ax.set_xlabel("Number of figures Claude gave from memory (runs 1 and 2)")
ax.set_ylabel("Confidence Claude stated")
ax.legend(frameon=False, loc="upper left", bbox_to_anchor=(1.01, 1))
ax.set_title("Claude's stated confidence against what the XBRL check found")
plt.savefig("asml-claude-confidence.png", dpi=150, bbox_inches="tight")

c2 = check["error"]
figures = {
    "n_facts": len(filing), "n_concepts": int(filing["concept"].nunique()), "n_questions": len(KEY),
    "n_runs": len(ANSWERS),
    "claude1_answered": int((grades["Claude run 1"].isin(order[:5])).sum()),
    "claude2_answered": int((grades["Claude run 2"].isin(order[:5])).sum()),
    "claude2_exact": int(counts.loc["exact", "Claude run 2"]), "claude2_close": int(counts.loc["close", "Claude run 2"]),
    "claude2_wrong": int(counts.loc["wrong", "Claude run 2"]),
    "claude2_off": int(counts.loc[["wrong", "other figure"], "Claude run 2"].sum()),
    "claude1_off": int(counts.loc[["wrong", "other figure"], "Claude run 1"].sum()),
    "web_exact": int(counts.loc["exact", "Claude + web"]),
    "capex_said": ANSWERS["Claude run 2"][8] * 1e6, "capex_filed": filed_value(*KEY["capex_2025"]) * 1e6,
    "capex_error": float(c2["capex_2025"]),
    "cash_said": ANSWERS["Claude run 2"][9] * 1e6, "cash_filed": filed_value(*KEY["cash_2025"]) * 1e6,
    "cash_error": float(c2["cash_2025"]),
    "rd_said": ANSWERS["Claude run 2"][3] * 1e6, "rd_filed": filed_value(*KEY["rd_costs_2025"]) * 1e6,
    "rd_error": float(c2["rd_costs_2025"]),
    "eps_diluted": filed_value(*KEY["diluted_eps_2025"]),
    "eps_basic": filed_value("EarningsPerShareBasic", "2025-12-31", "EUR/shares"),
    "eps_gap": filed_value("EarningsPerShareBasic", "2025-12-31", "EUR/shares") - filed_value(*KEY["diluted_eps_2025"]),
    "close_tol": CLOSE,
    "ocf_said": ANSWERS["Claude run 2"][7] * 1e6, "ocf_filed": filed_value(*KEY["operating_cash_flow_2025"]) * 1e6,
    "ocf_error": float(c2["operating_cash_flow_2025"]),
    "gp_said": ANSWERS["Claude run 2"][2] * 1e6, "gp_filed": filed_value(*KEY["gross_profit_2025"]) * 1e6,
    "sales_2025": filed_value(*KEY["net_sales_2025"]) * 1e6, "sales_2024": filed_value(*KEY["net_sales_2024"]) * 1e6,
    "buybacks": filed_value(*KEY["buybacks_2025"]) * 1e6,
    "capex_2024": filed_value("PaymentsToAcquirePropertyPlantAndEquipment", "2024-12-31", "EUR") * 1e6,
    "capex_2023": filed_value("PaymentsToAcquirePropertyPlantAndEquipment", "2023-12-31", "EUR") * 1e6,
    "low_conf_answers": int(by_conf.loc["low"].sum()),
    "low_conf_off": int(by_conf.loc["low", [g for g in ("wrong", "other figure") if g in by_conf.columns]].sum()),
    "highmed_off": int(by_conf.loc[["high", "medium"], [g for g in ("wrong", "other figure")
                                                          if g in by_conf.columns]].sum().sum()),
}
grade exact close other figure wrong
confidence
high 2 0 0 0
medium 2 3 0 0
low 1 4 2 4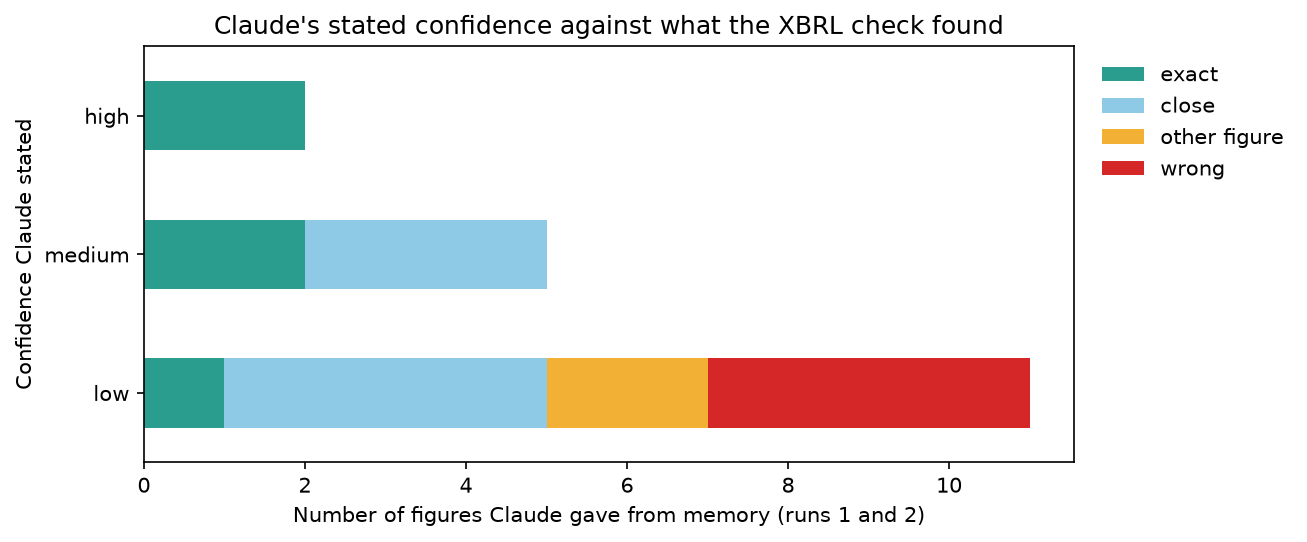
The label meant something. Every answer marked “high” or “medium” was exact or close, and all 4 wrong or misattributed figures from run 2, plus the 2 from run 1, came from the 11 answers across both runs marked “low”. It’s still a weak filter. Five of those low-confidence answers were right or nearly right, and the two runs disagreed about whether to answer at all. Run 1 declined operating cash flow, capex, cash and buybacks. Run 2 answered all four with the same “low” label and got capex and cash wrong. Eighteen answers from one model on one company is a small sample, so read this as “the label is worth logging”, nothing stronger.
What can go wrong
Units and scale come first. ASML’s facts are in euros and in raw units, so a model’s “32667” means millions and the code divides by a million before comparing. A US company’s facts sit under USD, and per-share values under USD/shares. Get the unit wrong and filed_value finds nothing, so every number the model gave grades as “invented”.
Concept choice is the next trap. Companies pick different tags for the same line, so revenue might be Revenues at one company and RevenueFromContractWithCustomerExcludingAssessedTax at another. Check the concept list for your company before trusting an “invented” grade.
The companyfacts file has gaps by design. The SEC’s API documentation says it only aggregates facts from non-custom taxonomies that apply to the entire filing entity, so segment and regional figures and anything a company tagged with its own elements aren’t there. For those you parse the filing’s instance document, as the XBRL parser post shows.
Signs and periods catch people too. XBRL stores payments such as capex and buybacks as positive values, while the cash flow statement shows them in brackets, so a model that answers “-1573.6” has the right figure. The grade function above would mark it wrong, because it compares signed values. Compare absolute values if your prompts allow signs. Balance sheet items are instants, so cash carries an end date and no start.
Repeat runs differ. With the same model and the same prompt, Claude answered four questions in one run that it marked “UNKNOWN” in the other. Keep every raw reply. The SEC’s fair access rules ask for a declared User-Agent and at most 10 requests per second, and this check uses one request per company.
What to watch
ASML filed its fiscal 2025 20-F on 25 February 2026, according to its EDGAR filing index, and the fiscal 2026 report will be the next chance to rerun the memory prompt and see whether GPT and Gemini have caught up on 2025. Model versions change faster than filings do, so the version line below is what these results apply to. The same check works on any model output that names a company, a line and a period, including the DCF Claude Code built for Alphabet and the three-model 10-K test. In both, the models worked from the filings, and the misses were a stale balance sheet and a choice between two stock-based compensation figures.
My longer company research is published on the newsletter Sector Playbook, which is available by email subscription.
Sources
ASML’s Form 20-F for fiscal 2025, its fourth-quarter 2025 results release and its XBRL company facts on SEC EDGAR; the SEC’s EDGAR API documentation and fair access rules; the documentation for Claude Code non-interactive mode and CLAUDE.md files, Codex non-interactive mode and AGENTS.md, and OpenCode’s CLI and rules files.
Tested 12 November 2026 with Claude Code 2.1.321 (claude-opus-5-5), Codex CLI 0.167.0 (gpt-6.1-sol) and OpenCode 2.2.6 (gemini-4-argon); checking code run with Python 3.12.14, matplotlib 3.11.2, pandas 3.1.0, requests 2.34.2.
Disclaimer
This article is general information about a listed company, written for educational purposes. It is not investment advice and not a personal recommendation to buy, sell or hold any security, and it does not take into account anyone’s financial situation or objectives. I am not a registered investment adviser or a licensed financial services provider. Figures come from company filings and the other sources linked in the text, as of the dates given, and may have changed since. I may hold positions in the securities discussed; see the disclosure above. Investment decisions call for independent research or the advice of a licensed professional.
This is my own research, done with the help of AI tools.