How to build an XBRL parser in Python: SEC filings to JSON
Disclosure: I have no position in ASML. I also hold diversified funds (IWDA, QQQ, SPY, VWRL) that may include ASML. Positions checked on 31 October 2026.
This XBRL parser in Python reads all 11,381 facts in ASML’s SEC company facts file, writes the annual lines to a small JSON file, and then parses the XBRL file of the 2025 annual report itself for the numbers the SEC’s API leaves out, such as revenue by country and by machine type. Its revenue figure for fiscal 2025, €32.7 billion, is the total in ASML’s 2025 annual report on Form 20-F, and the regional breakdown it pulls out of the same filing adds up to exactly that total.
ASML makes a good test case. It files a 20-F, reports in euros, and keeps its most useful disclosures in XBRL dimensions that the SEC’s summary API drops. Code written for US 10-K filers trips on all three.
Step 1: download the company facts JSON
The SEC already turns the numbers in XBRL filings into JSON. Its EDGAR APIs on data.sec.gov “do not require any authentication or API keys”, and the companyfacts endpoint returns every standard-taxonomy, entity-wide fact a company has filed in one call. The SEC EDGAR API tutorial on this site used it to rebuild Alphabet’s statements. This post looks inside that JSON, then parses the XBRL of a single filing.
import os
import json
import xml.etree.ElementTree as ET
import requests
import pandas as pd
import matplotlib.pyplot as plt

pd.set_option("display.float_format", "{:,.2f}".format)

# The SEC asks every script to identify itself. Set your own contact first:
#   export SEC_USER_AGENT="Your Name you@example.com"
HEADERS = {"User-Agent": os.environ["SEC_USER_AGENT"]}


def company_facts(ticker):
    """Every XBRL fact a company has filed, from the SEC's companyfacts API."""
    tickers = requests.get("https://www.sec.gov/files/company_tickers.json", headers=HEADERS, timeout=30).json()
    cik = next(v["cik_str"] for v in tickers.values() if v["ticker"] == ticker)
    url = f"https://data.sec.gov/api/xbrl/companyfacts/CIK{cik:010d}.json"
    return requests.get(url, headers=HEADERS, timeout=30).json()


facts = company_facts("ASML")
print(facts["entityName"], "| CIK", facts["cik"])
for taxonomy, concepts in facts["facts"].items():
    print(f"{taxonomy}: {len(concepts)} concepts")
revenue_node = facts["facts"]["us-gaap"]["RevenueFromContractWithCustomerExcludingAssessedTax"]
print(list(revenue_node), list(revenue_node["units"]))
print(json.dumps(revenue_node["units"]["EUR"][-1], indent=1))
ASML HOLDING NV | CIK 937966
dei: 3 concepts
us-gaap: 623 concepts
['label', 'description', 'units'] ['EUR']
{
"start": "2025-01-01",
"end": "2025-12-31",
"val": 32667300000,
"accn": "0001628280-26-011378",
"fy": 2025,
"fp": "FY",
"form": "20-F",
"filed": "2026-02-25",
"frame": "CY2025"
}The nesting runs taxonomy, concept, unit, then a list of facts. ASML is a Dutch company that reports under US GAAP, so its 623 concepts sit under us-gaap, and the only unit for revenue is EUR. Each fact carries its period (start, end), its value, the accession number and form of the filing it came from, the filing date and, sometimes, a frame. That last field decides Step 3.
Step 2: flatten the JSON into one table of facts
Nested JSON is awkward to filter. Four loops turn the whole file into a pandas DataFrame with one row per fact.
def flatten(facts):
    """One row per fact: taxonomy, concept, unit, period, value and the filing it came from."""
    rows = []
    for taxonomy, concepts in facts["facts"].items():
        for concept, node in concepts.items():
            for unit, items in node["units"].items():
                for item in items:
                    rows.append({"taxonomy": taxonomy, "concept": concept, "unit": unit, **item})
    df = pd.DataFrame(rows)
    for col in ["start", "end", "filed"]:
        df[col] = pd.to_datetime(df[col])
    return df


flat = flatten(facts)
print(flat.shape)
print(flat["unit"].value_counts().head(5).to_string())
print(flat["form"].value_counts().to_string())

usgaap = flat[flat["taxonomy"] == "us-gaap"]
eur_concepts = usgaap.loc[usgaap["unit"] == "EUR", "concept"].nunique()
usd_concepts = usgaap.loc[usgaap["unit"] == "USD", "concept"].nunique()

rev = flat[flat["concept"] == "RevenueFromContractWithCustomerExcludingAssessedTax"]
copies = rev[rev["end"] == "2023-12-31"].assign(val_m=lambda d: d["val"] / 1e6)
print(copies[["end", "val_m", "form", "fy", "filed", "frame"]].to_string(index=False))
(11381, 12)
unit
EUR 9865
shares 673
pure 516
EUR/shares 199
employee 33
form
20-F 10529
20-F/A 852
end val_m form fy filed frame
2023-12-31 27,558.50 20-F 2023 2024-02-14 NaN
2023-12-31 27,558.50 20-F 2024 2025-03-05 NaN
2023-12-31 27,558.50 20-F 2025 2026-02-25 CY2023Euros dominate. ASML reports 548 US GAAP concepts in EUR and only 3 in USD, so code that looks for USD, as most US examples do, fails on ASML’s statements, with a KeyError or an empty result depending on how it looks. The same number also appears several times. Revenue for 2023 shows up 3 times, because each 20-F repeats the two prior years, and only one copy carries a frame.
Step 3: keep one value per year and write clean JSON
The frame field is the SEC’s own deduplication. Per its API documentation, the frames aggregate “one fact for each reporting entity that is last filed that most closely fits the calendrical period requested”, and an annual frame (CY2023) covers a duration of 365 days, plus or minus 30. Keeping the framed annual facts gives one value per year, taken from the latest filing.
def annual(flat, concept, unit="EUR"):
    """Full-year values the SEC framed to a calendar year (CY2025), one per year."""
    df = flat[(flat["concept"] == concept) & (flat["unit"] == unit)]
    df = df[df["frame"].fillna("").str.fullmatch(r"CY\d{4}")]
    return df.set_index(df["end"].dt.year)["val"].sort_index()


LINES = {
    "revenue": "RevenueFromContractWithCustomerExcludingAssessedTax",
    "net_income": "NetIncomeLoss",
    "operating_cash_flow": "NetCashProvidedByUsedInOperatingActivities",
    "capex": "PaymentsToAcquirePropertyPlantAndEquipment",
    "intangibles": "PaymentsToAcquireIntangibleAssets",
    "research_and_development": "ResearchAndDevelopmentExpense",
}
table = pd.DataFrame({name: annual(flat, concept) for name, concept in LINES.items()}).dropna()
table["free_cash_flow"] = table["operating_cash_flow"] - table["capex"] - table["intangibles"]
print((table / 1e9).round(2).tail(4).to_string())

fig, ax = plt.subplots(figsize=(9, 4.5))
recent = (table[["revenue", "net_income", "free_cash_flow"]] / 1e9).tail(8)
recent.plot.bar(ax=ax, width=0.8, color=["#1f4e79", "#7fa7c9", "#d08c2f"])
ax.set_title("ASML from SEC XBRL company facts (EUR billions)")
ax.set_xlabel("Fiscal year")
ax.set_ylabel("EUR billions")
ax.legend(["Revenue", "Net income", "Free cash flow (ASML definition)"], frameon=False)
ax.tick_params(axis="x", rotation=0)
plt.savefig("asml-xbrl-annual.png", dpi=150, bbox_inches="tight")


def to_json(flat, lines, path):
    """Write the chosen concepts as {line: {year: {value, unit, accn, filed}}} JSON."""
    out = {"entity": facts["entityName"], "cik": int(facts["cik"]), "source": "SEC companyfacts API", "lines": {}}
    for name, concept in lines.items():
        df = flat[(flat["concept"] == concept) & flat["frame"].fillna("").str.fullmatch(r"CY\d{4}")]
        out["lines"][name] = {
            str(r.end.year): {"value": r.val, "unit": r.unit, "accn": r.accn, "filed": r.filed.date().isoformat()}
            for r in df.sort_values("end").itertuples()
        }
    with open(path, "w") as f:
        json.dump(out, f, indent=2)
    return out


clean = to_json(flat, LINES, "asml_annual.json")
print(json.dumps({"entity": clean["entity"], "revenue": {"2025": clean["lines"]["revenue"]["2025"]}}, indent=2))
print(os.path.getsize("asml_annual.json"), "bytes")
revenue net_income operating_cash_flow capex intangibles research_and_development free_cash_flow
end
2022 21.17 5.62 8.49 1.28 0.04 3.25 7.17
2023 27.56 7.84 5.44 2.16 0.04 3.98 3.25
2024 28.26 7.57 11.17 2.07 0.02 4.30 9.08
2025 32.67 9.61 12.66 1.57 0.06 4.70 11.03
{
"entity": "ASML HOLDING NV",
"revenue": {
"2025": {
"value": 32667300000.0,
"unit": "EUR",
"accn": "0001628280-26-011378",
"filed": "2026-02-25"
}
}
}
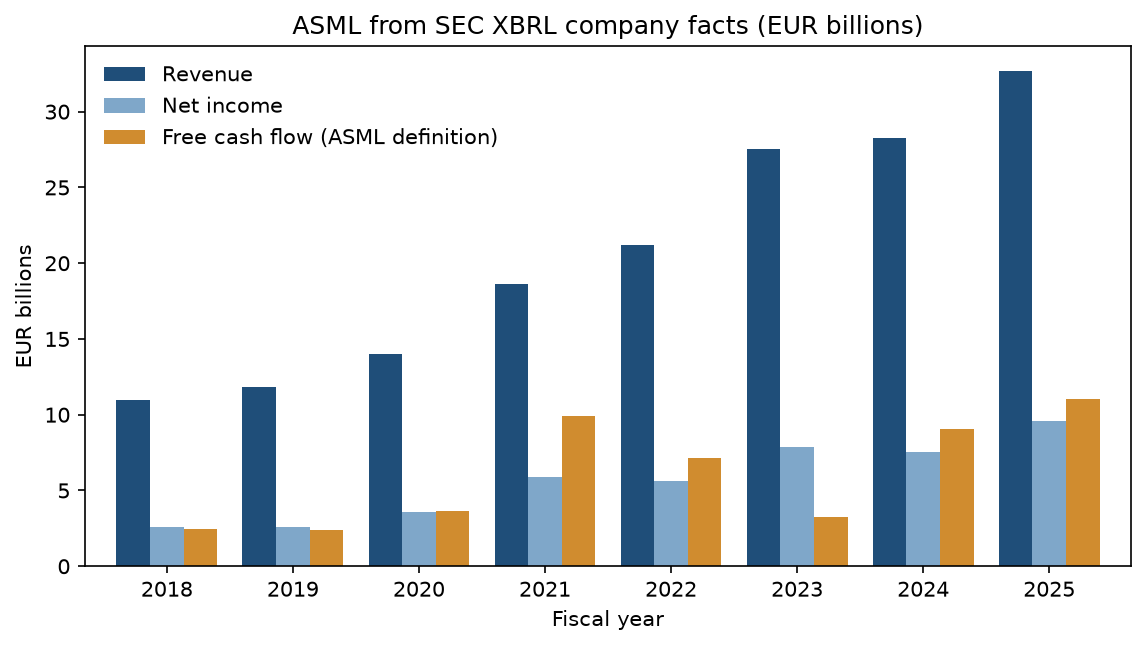
14795 bytesThe 14,795-byte file keeps every year the SEC framed for each line, and every value carries the accession number of the filing it came from, so any number can be traced back. All six lines are available for the 9 fiscal years from 2017 to 2025, which is what the table DataFrame holds; the printout shows the last four. Revenue grew 15.6% in 2025 and net income reached €9.6 billion. Free cash flow here follows ASML’s own definition in the 20-F, which takes operating cash flow and subtracts purchases of property, plant and equipment and of intangible assets. That gives €11.0 billion, from €12.7 billion of operating cash flow, €1.6 billion of capital expenditure and €57.6 million spent on intangibles. The method behind that line is in the free cash flow tutorial.
Step 4: an XBRL parser in Python for the filing itself
The companyfacts file has a hard limit. The SEC’s API page says these APIs only aggregate facts that use a non-custom taxonomy and apply to the entire filing entity. Anything broken down by region, product or segment is left out, and so is every element a company defines for itself. To get those you parse the filing’s XBRL instance, the _htm.xml file that sits in the filing’s folder on EDGAR next to the inline XBRL report.
An instance has two parts that matter. Contexts say what period a fact covers and along which dimensions (an axis such as srt:StatementGeographicalAxis and a member such as country:CN, or a typed member, which carries its own value). Facts are elements whose tag is the concept and whose contextRef, unitRef and decimals attributes point to the rest. Python’s standard library reads both.
XBRLI = "{http://www.xbrl.org/2003/instance}"
XBRLDI = "{http://xbrl.org/2006/xbrldi}"


def instance_url(cik, accn):
    """URL of the XBRL instance document (the *_htm.xml file) in a filing's folder."""
    folder = f"https://www.sec.gov/Archives/edgar/data/{cik}/{accn.replace('-', '')}"
    items = requests.get(f"{folder}/index.json", headers=HEADERS, timeout=30).json()["directory"]["item"]
    name = next(i["name"] for i in items if i["name"].endswith("_htm.xml"))
    return f"{folder}/{name}"


def parse_instance(url):
    """Parse an XBRL instance into one row per numeric fact, with period, unit, precision and dimensions."""
    root = ET.fromstring(requests.get(url, headers=HEADERS, timeout=60).content)
    contexts = {}
    for c in root.iter(XBRLI + "context"):
        period = c.find(XBRLI + "period")
        start = period.findtext(XBRLI + "startDate")
        end = period.findtext(XBRLI + "endDate") or period.findtext(XBRLI + "instant")
        dims = {m.get("dimension"): m.text for m in c.iter(XBRLDI + "explicitMember")}
        dims.update({m.get("dimension"): "".join(m.itertext()).strip() for m in c.iter(XBRLDI + "typedMember")})
        contexts[c.get("id")] = {"start": start, "end": end, "dims": dims}
    rows = []
    for el in root:
        if el.get("contextRef") is None or el.get("unitRef") is None:
            continue  # text blocks carry no unit; this parser keeps numbers
        ns, concept = el.tag[1:].split("}")
        ctx = contexts[el.get("contextRef")]
        rows.append({"concept": concept, "namespace": ns, "value": float(el.text), "unit": el.get("unitRef"),
                     "decimals": el.get("decimals"), "context": el.get("contextRef"),
                     "start": ctx["start"], "end": ctx["end"],
                     "dims": ctx["dims"], "n_dims": len(ctx["dims"])})
    return pd.DataFrame(rows)


def most_precise(df):
    """One fact per concept, context and unit: the copy with the highest decimals (INF means exact)."""
    precision = pd.to_numeric(df["decimals"].replace("INF", "99"))
    df = df.assign(precision=precision).sort_values("precision")
    return df.drop_duplicates(["concept", "context", "unit"], keep="last").drop(columns="precision")


latest = rev.sort_values("filed").iloc[-1]
url = instance_url(facts["cik"], latest["accn"])
print(url.rsplit("/", 1)[-1], latest["form"], latest["filed"].date())
raw = parse_instance(url)
custom = raw[raw["namespace"].str.contains("asml.com")]
print(len(raw), "numeric facts |", (raw["n_dims"] > 0).sum(), "with dimensions |", len(custom), "company-specific")
print(raw["namespace"].value_counts().to_string())

REVENUE = "RevenueFromContractWithCustomerExcludingAssessedTax"
copies_2025 = raw[(raw["concept"] == REVENUE) & (raw["start"] == "2025-01-01") & (raw["n_dims"] == 0)]
print(copies_2025[["context", "value", "decimals"]].assign(value=copies_2025["value"] / 1e6).to_string(index=False))
inst = most_precise(raw)
print(len(inst), "facts after keeping the most precise copy of each")
asml-20251231_htm.xml 20-F 2026-02-25
2262 numeric facts | 1034 with dimensions | 626 company-specific
namespace
http://fasb.org/us-gaap/2025 1608
http://www.asml.com/20251231 626
http://xbrl.sec.gov/dei/2025 26
http://fasb.org/srt/2025 2
context value decimals
c-1 32,667.30 -5
c-1 32,667.30 -5
c-1 32,700.00 -8
2011 facts after keeping the most precise copy of eachOne filing holds 2,262 numeric facts. 1,034 of them carry at least one dimension and 626 use ASML’s own namespace; none of those reach the companyfacts JSON. The parser matches on the concept name and keeps the namespace in a separate column, because the namespace carries the taxonomy year (us-gaap/2025) and changes with every annual taxonomy release.
The last lines show a trap. The 2025 revenue total appears 3 times in the same context of the same filing: twice as €32,667.3 million with decimals -5, accurate to the nearest €100,000, and once as €32.7 billion with decimals -8, tagged where the notes say total net sales rose “to €32.7 billion in 2025” (20-F, notes to the consolidated financial statements). The XBRL 2.1 specification defines decimals as the number of decimal places to which a value is accurate, so most_precise keeps one fact per concept, context and unit, the one with the highest decimals. That leaves 2,011 facts, and every step below works on them.
Step 5: read the dimensions the API leaves out
With dimensions in the table, a breakdown becomes a filter. Keep the facts with exactly one dimension, on the axis you want.
def by_axis(facts_df, axis):
    """Facts broken down along one dimension (axis) and no other."""
    one = facts_df[facts_df["n_dims"] == 1]
    sel = one[one["dims"].apply(lambda d: axis in d)].copy()
    sel["member"] = sel["dims"].apply(lambda d: d[axis].split(":")[-1])
    return sel.drop_duplicates(["member", "start", "end"])


r25 = inst[(inst["concept"] == REVENUE) & (inst["start"] == "2025-01-01")]
geo = by_axis(r25, "srt:StatementGeographicalAxis").set_index("member")["value"].sort_values()
print((geo / 1e9).round(2).to_string())

NAMES = {"CN": "China", "TW": "Taiwan", "KR": "South Korea", "US": "United States", "JP": "Japan",
         "SG": "Singapore", "RestOfEuropeAndMiddleEastMember": "EMEA (excl. Netherlands)",
         "NL": "Netherlands", "RestOfAsiaMember": "Rest of Asia"}
fig, ax = plt.subplots(figsize=(8, 4.5))
ax.barh([NAMES.get(m, m) for m in geo.index], geo / 1e9, color="#1f4e79")
ax.set_title("ASML 2025 revenue by customer location, from dimensional XBRL facts (EUR billions)")
ax.set_xlabel("EUR billions")
for i, v in enumerate(geo / 1e9):
    ax.text(v + 0.1, i, f"{v:.1f}", va="center", fontsize=9)
plt.savefig("asml-xbrl-revenue-by-region.png", dpi=150, bbox_inches="tight")

rev_all = inst[inst["concept"] == REVENUE]
products = by_axis(rev_all, "srt:ProductOrServiceAxis")
products = products[~products["member"].isin(["ProductMember", "ServiceAndFieldOptionsMember"])]
products["year"] = pd.to_datetime(products["end"]).dt.year
mix = products.pivot_table(index="year", columns="member", values="value", aggfunc="first") / 1e9
mix = mix[mix.loc[mix.index.max()].sort_values(ascending=False).index]
print(mix.round(2).to_string())

LABELS = {"NXEMember": "EUV (NXE)", "EXEMember": "High-NA EUV (EXE)", "ArfImmersionMember": "ArF immersion",
          "ArfDryMember": "ArF dry", "KrfMember": "KrF", "IlineMember": "i-line",
          "MetrologyAndInspectionMember": "Metrology and inspection"}
fig, ax = plt.subplots(figsize=(9, 4.5))
mix.rename(columns=LABELS).plot.bar(ax=ax, width=0.85)
ax.set_title("ASML system sales by technology, from the 2025 20-F XBRL instance (EUR billions)")
ax.set_xlabel("Fiscal year")
ax.set_ylabel("EUR billions")
ax.tick_params(axis="x", rotation=0)
ax.legend(frameon=False, fontsize=8, ncol=2)
plt.savefig("asml-xbrl-system-sales.png", dpi=150, bbox_inches="tight")
member
RestOfAsiaMember 0.00
NL 0.00
RestOfEuropeAndMiddleEastMember 0.52
SG 0.61
JP 1.42
US 4.09
KR 8.16
TW 8.34
CN 9.52
member NXEMember ArfImmersionMember EXEMember KrfMember MetrologyAndInspectionMember ArfDryMember IlineMember
year
2023 9.12 9.02 0.00 2.20 0.54 0.78 0.28
2024 7.86 9.67 0.46 1.99 0.65 0.77 0.37
2025 10.45 10.31 1.16 1.00 0.82 0.43 0.31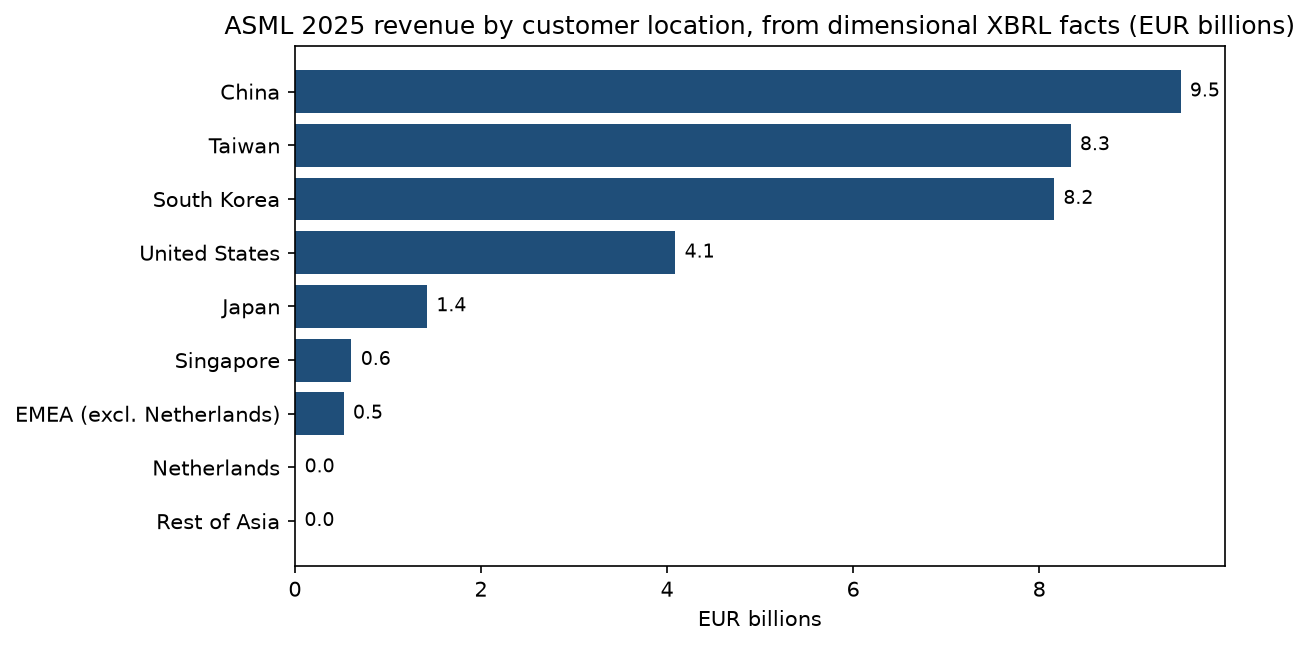
China was the largest region in 2025 at €9.5 billion, 29% of revenue, followed by Taiwan at €8.3 billion and South Korea at €8.2 billion, with the United States at €4.1 billion. The 20-F attributes sales “to the geographic location in which the customers’ facilities are located” (segment note).
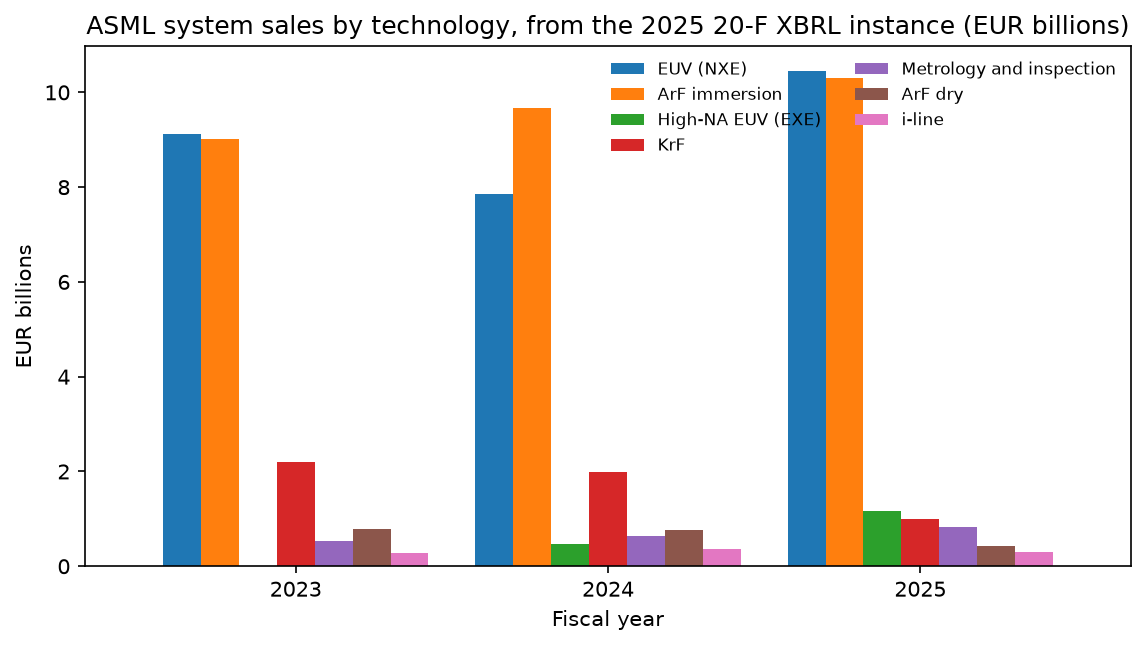
The product axis splits system sales by technology. The NXE line of EUV systems brought in €10.4 billion in 2025 and the EXE line of High-NA EUV systems €1.2 billion, a line with no revenue in 2023. The filter on exactly one dimension matters. The same revenue concept also appears with two axes at once, product type and customer type (logic or memory), and summing those with the single-axis facts would count the same euro twice.
Step 6: check the parser against the 20-F
Three sources should agree on 2025 revenue: the companyfacts JSON, the undimensioned total in the instance and the sum of the regions. If they do not, the parser has a bug.
total_2025 = r25.loc[r25["n_dims"] == 0, "value"].item()
print("companyfacts:", table.loc[2025, "revenue"] / 1e6)
print("instance total:", total_2025 / 1e6)
print("sum of regions:", round(geo.sum() / 1e6, 1))
print(f"https://www.sec.gov/Archives/edgar/data/{facts['cik']}/{latest['accn'].replace('-', '')}/")

figures = {
    "fy_latest": int(table.index[-1]),
    "n_facts": int(len(flat)),
    "n_concepts_usgaap": int(usgaap["concept"].nunique()),
    "eur_concepts": int(eur_concepts),
    "usd_concepts": int(usd_concepts),
    "revenue_2023_copies": int(len(copies)),
    "revenue": float(table["revenue"].iloc[-1]),
    "revenue_exact": float(total_2025),
    "revenue_growth": float(table["revenue"].iloc[-1] / table["revenue"].iloc[-2] - 1),
    "net_income": float(table["net_income"].iloc[-1]),
    "free_cash_flow": float(table["free_cash_flow"].iloc[-1]),
    "operating_cash_flow": float(table["operating_cash_flow"].iloc[-1]),
    "capex": float(table["capex"].iloc[-1]),
    "intangibles": float(table["intangibles"].iloc[-1]),
    "first_year": int(table.index[0]),
    "n_years": int(len(table)),
    "json_bytes": int(os.path.getsize("asml_annual.json")),
    "inst_facts": int(len(raw)),
    "inst_unique": int(len(inst)),
    "revenue_2025_copies": int(len(copies_2025)),
    "inst_dim_facts": int((raw["n_dims"] > 0).sum()),
    "inst_custom_facts": int(len(custom)),
    "china": float(geo["CN"]),
    "taiwan": float(geo["TW"]),
    "korea": float(geo["KR"]),
    "us": float(geo["US"]),
    "china_share": float(geo["CN"] / geo.sum()),
    "geo_sum": float(geo.sum()),
    "euv_nxe": float(mix.loc[mix.index.max(), "NXEMember"] * 1e9),
    "exe": float(mix.loc[mix.index.max(), "EXEMember"] * 1e9),
}
companyfacts: 32667.3
instance total: 32667.3
sum of regions: 32667.3
https://www.sec.gov/Archives/edgar/data/937966/000162828026011378/All three print €32,667.3 million, and the folder holds the 20-F filed on 25 February 2026, whose consolidated statement of operations lists total net sales of €32,667.3 million. The free cash flow line passes the same check: the 20-F reports free cash flow of €11,027.3 million for 2025 as a non-GAAP measure, the figure the code computes from the JSON. Run the reconciliation once for every new company and every new concept.
What can go wrong
The wrong unit. Most code written for US filers reads units["USD"]. ASML’s statement lines exist only in EUR, so that lookup raises a KeyError, and a DataFrame filtered on USD comes back empty without any error. Print list(node["units"]) for a concept before you trust it.
No frame on the value you want. The SEC assigns a frame only to the fact that best fits a calendar period, and a duration has to fall within 365 days, plus or minus 30, to count as annual (API documentation). A company whose fiscal year ends in September gets a CY label for the calendar year its period best fits, so check the end column before you label anything “fiscal 2025”. For quarterly work, use the CY2025Q1 frames for durations and the CY2025Q1I frames for balances.
No quarters at all. ASML’s company facts contain only 20-F and 20-F/A forms, as the Step 2 output shows. Its quarterly results reach the SEC as 6-K reports, and none of their figures appear in this file, so a quarterly series for ASML needs another source.
Duplicated facts inside one filing. One concept in one context can be tagged several times at different precision, as the rounded copy of ASML’s 2025 revenue in Step 4 shows. Run most_precise before any sum or breakdown.
Double counting across dimensions. A fact with two axes, such as product and customer type, is a subset of the single-axis facts. Sum only facts that share the same set of dimensions.
Company-specific elements. Members such as asml:NXEMember and concepts in ASML’s own namespace are defined in the filing’s own taxonomy files, and a company can rename them from one year to the next. Map them by hand once per company and check the map against each new filing.
Parsing XML from the internet. The xml.etree.ElementTree documentation sends anyone who parses untrusted or unauthenticated data to Python’s XML security notes first. Files fetched from sec.gov are a known source; read those notes before you point the parser at XML from anywhere else.
Blocked requests. A request to data.sec.gov without a User-Agent header got an HTTP 403 error when this code was tested, and EDGAR’s fair access page asks scripts to declare one and sets a maximum of 10 requests per second. The instance file for one annual report runs to several megabytes, so download it once and keep a local copy while you develop.
What to watch
ASML’s next annual report on Form 20-F, for fiscal 2026, adds a year to every line here. If it uses a newer US GAAP taxonomy, the namespaces change, and the parser already handles that by matching on concept names. ASML’s custom members for new products are the part to recheck, since the High-NA EUV member first carried revenue in 2024. For ASML in particular, the regional split is the disclosure to follow, and China’s share of revenue is the figure the next instance file will update.
For more on the same data, see the earlier posts on retrieving financial statements with Python, peer company analysis and benchmarking and the site’s earlier deep dive on ASML’s business.
My longer company research is published on the newsletter Sector Playbook, which is available by email subscription.
Sources
ASML 2025 annual report on Form 20-F, filed 25 February 2026, with its XBRL instance asml-20251231_htm.xml in the same filing. ASML’s 20-F filings on EDGAR (CIK 937966). SEC, EDGAR application programming interfaces. SEC, Accessing EDGAR data. XBRL International, XBRL 2.1 specification. Python, xml.etree.ElementTree documentation.
Time: 20 minutes. Python 3.12.14, matplotlib 3.11.2, pandas 3.1.0, requests 2.34.2. API key: none, the SEC only asks for a name and email address in the User-Agent header. Tested 31 October 2026.
Disclaimer
This article is general information about a listed company, written for educational purposes. It is not investment advice and not a personal recommendation to buy, sell or hold any security, and it does not take into account anyone’s financial situation or objectives. I am not a registered investment adviser or a licensed financial services provider. Figures come from company filings and the other sources linked in the text, as of the dates given, and may have changed since. I may hold positions in the securities discussed; see the disclosure above. Investment decisions call for independent research or the advice of a licensed professional.
This is my own research, done with the help of AI tools.