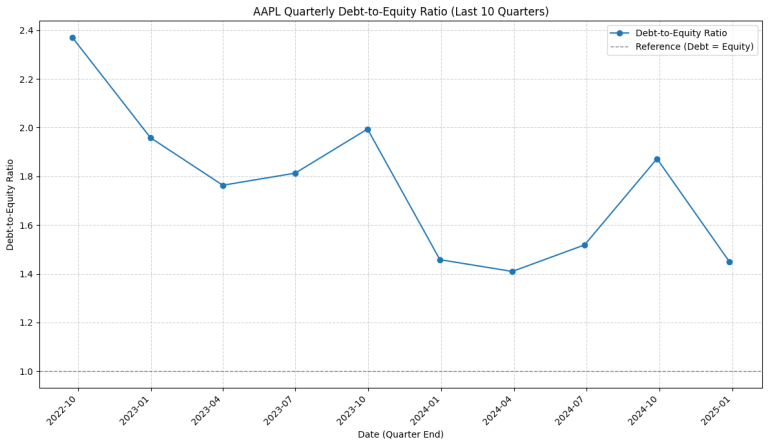
5. Python for Fundamental Analysis: Company Leverage with Debt-to-Equity Ratio
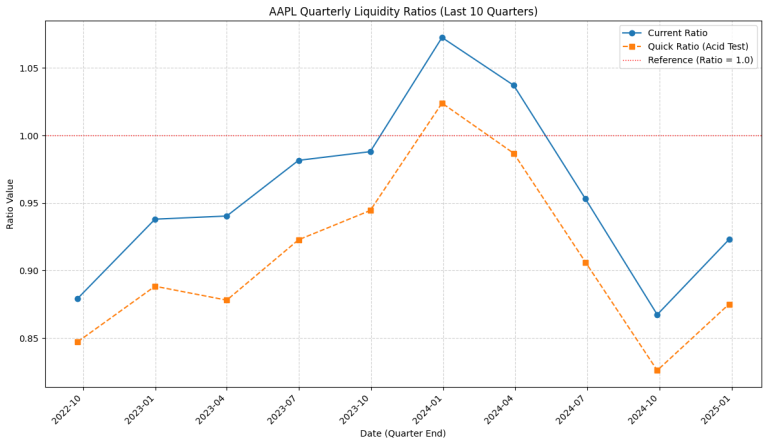
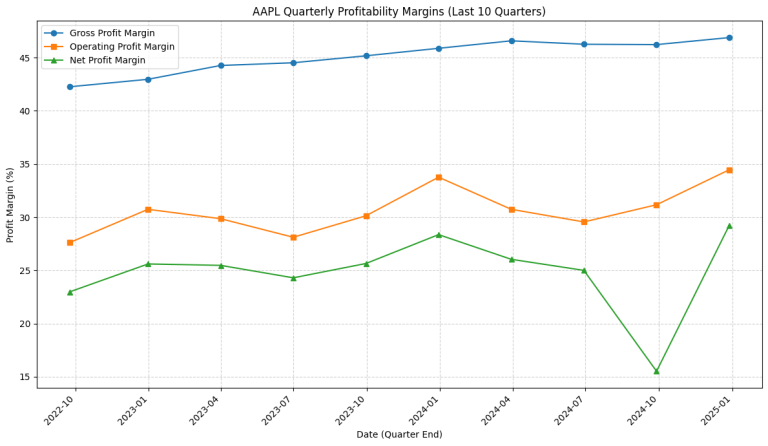
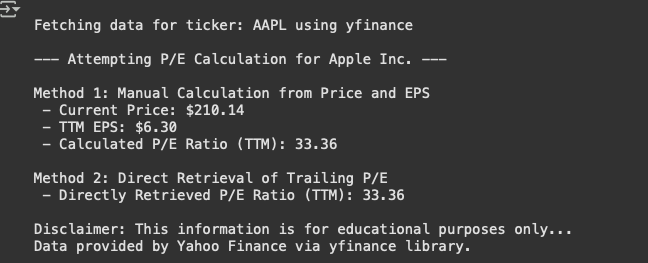
Welcome back to the Python for Finance series! Having explored valuation (Post 1), financial statements (Post 2), profitability (Post 3), and liquidity (Post 4), we now examine another crucial aspect: Leverage. Leverage involves using debt to finance operations and assets. While it can magnify returns, it also increases financial risk, making companies more vulnerable during downturns due to…