Best Python backtesting library? backtesting.py, backtrader, vectorbt
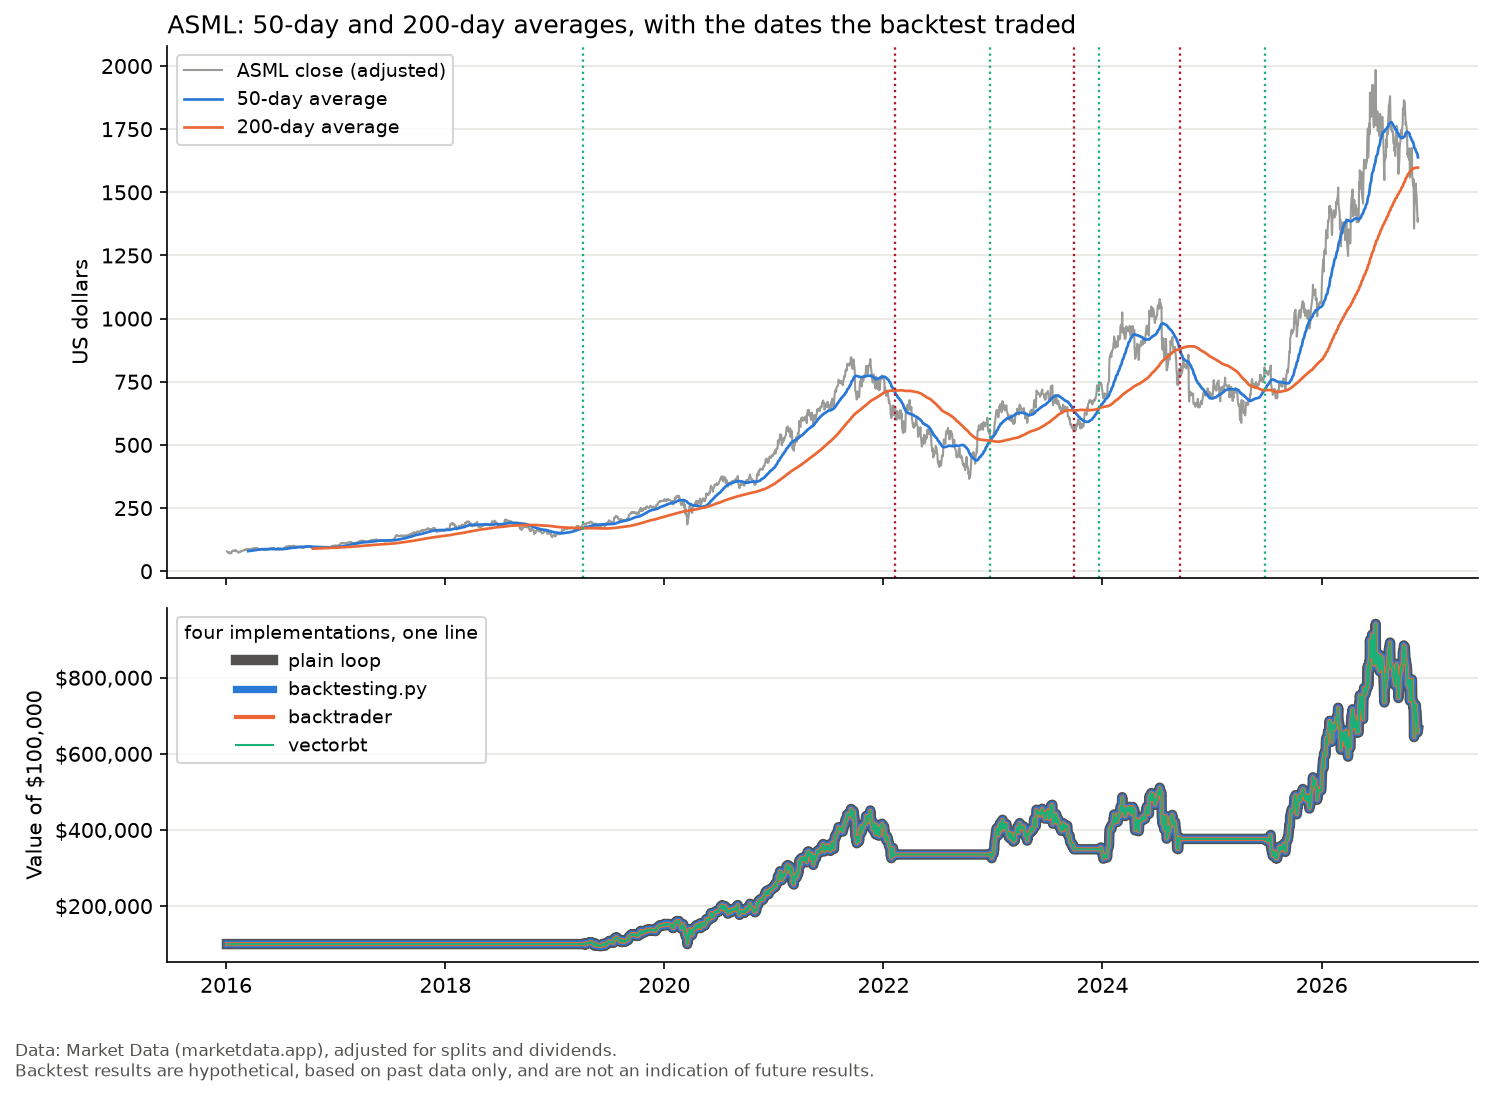
Picking the best Python backtesting library turned out to have nothing to do with getting the right answer. I wrote one rule, a 50/200-day moving-average crossover on ASML, four times: in backtesting.py, in backtrader, in vectorbt and as a plain Python loop. Once all four filled their orders the same way, each turned $100,000 into $662,108 and matched the others to the cent on every one of 2,736 trading days. Backtest results are hypothetical, based on past data only, and are not an indication of future results.
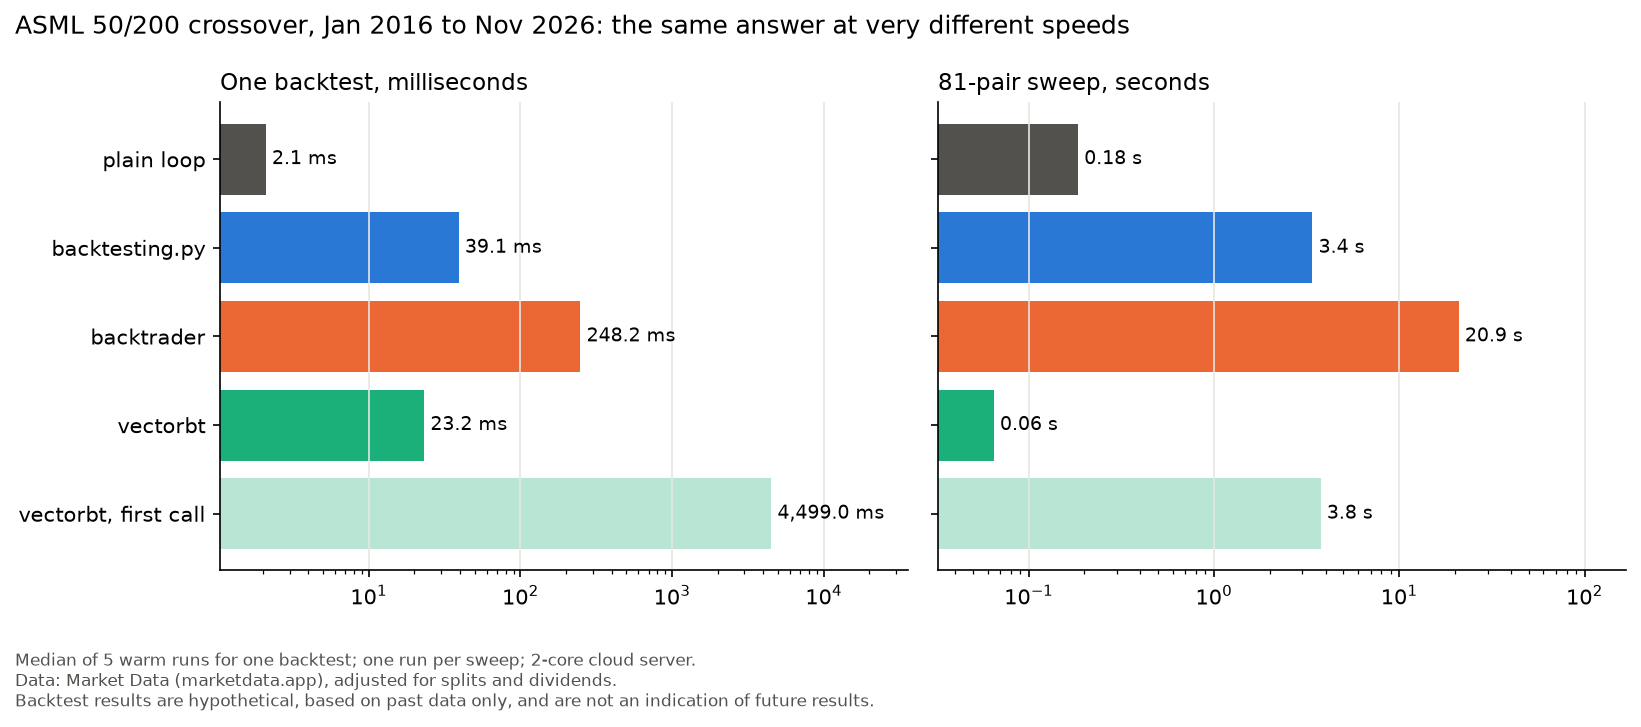
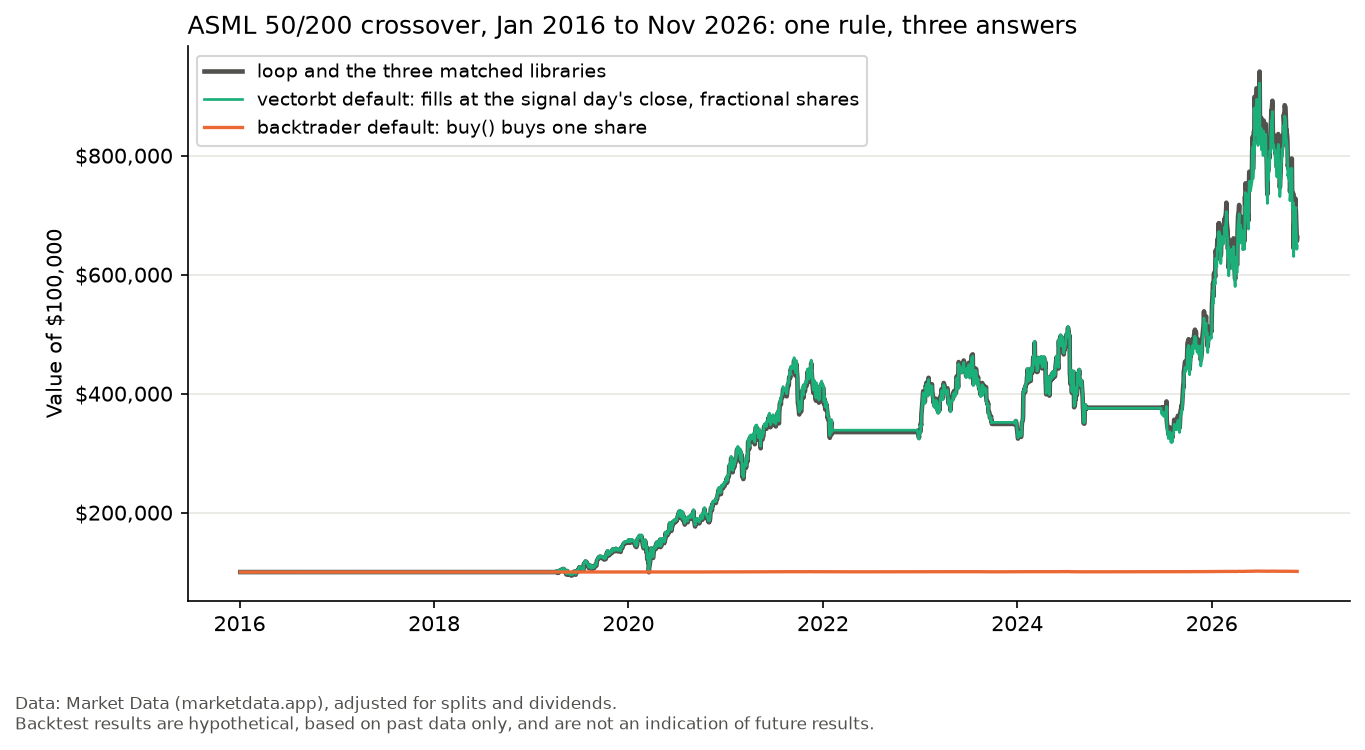
So the choice comes down to speed, code and licences. One backtest took 248 milliseconds in backtrader and 23 in vectorbt. A sweep of 81 parameter pairs took backtrader 20.9 seconds and vectorbt 0.06, once vectorbt had paid a few seconds of compiling on its first call. Getting the four to agree meant aligning their signal timing, fill prices and position sizes. Left on their defaults, they give three different answers, and that’s the part worth reading before you trust any of them.
Step 1: get ASML’s daily prices
ASML’s ordinary shares trade on Nasdaq under the ticker ASML, according to its annual report on Form 20-F for 2025. The prices come from Market Data through its Python SDK. Market Data serves Apple without a token; for any other ticker, create a Market Data account (affiliate link) and set MARKETDATA_TOKEN. Its pricing page gives the free plan one year of daily history and the Starter plan five, so going back to 2016 takes the Trader plan or higher. The self-service plans come with a 30-day free trial. Market Data provides this site’s data access.
import os
import math
import time
import platform
from itertools import product
import numpy as np
import pandas as pd
import matplotlib.pyplot as plt
from marketdata import MarketDataClient  # pip install marketdata-sdk-py

# Market Data serves AAPL without a token; ASML needs one. Set yours first:
#   export MARKETDATA_TOKEN=YOUR_TOKEN
client = MarketDataClient(token=os.environ.get("MARKETDATA_TOKEN"))
START, END = "2016-01-01", "2026-11-18"

candles = client.stocks.candles("ASML", resolution="D", from_date=START, to_date=END,
                                output_format="dataframe")
if not isinstance(candles, pd.DataFrame):
    raise RuntimeError(candles)
ohlc = candles.rename(columns={"o": "Open", "h": "High", "l": "Low", "c": "Close", "v": "Volume"})
ohlc.index = ohlc.index.tz_localize(None).normalize()
print(f"{len(ohlc)} trading days, {ohlc.index[0]:%Y-%m-%d} to {ohlc.index[-1]:%Y-%m-%d}")
print(ohlc.iloc[[0, -1]].round(2).to_string())
print(f"Python {platform.python_version()}, {os.cpu_count()} CPU cores")
2736 trading days, 2016-01-04 to 2026-11-18
Open High Low Close Volume
t
2016-01-04 78.44 78.55 77.2 78.45 2275299
2026-11-18 1397.68 1411.50 1368.0 1395.27 1355635
Python 3.12.14, 2 CPU coresThe column names are the ones backtesting.py insists on; the other two accept them. The daily candles endpoint adjusts for splits and dividends by default, opens included, so buying at the open and valuing at the close happen on one price scale. Note the two CPU cores: every timing here comes from a small cloud server, and a laptop will likely be faster across the board.
Step 2: write the rule once as a plain loop
First, an answer I can check by hand. When the 50-day average of the close crosses above the 200-day, buy as many whole shares as the cash allows at the next day’s open; when it crosses back below, sell everything at the next open. Each trade pays 0.1% of its value for commission and spread, an assumption to change for your own broker.
CASH, FEE = 100_000, 0.001  # starting cash, and 0.1% of each trade for commission and spread (an assumption)
FAST, SLOW = 50, 200        # moving-average windows, in trading days


def crossings(close, fast, slow):
    """Days the fast average closes above (buy) or below (sell) the slow one after being on the other side."""
    slow_ma = close.rolling(slow).mean()
    above = close.rolling(fast).mean() > slow_ma
    was_above = above.shift(1, fill_value=False)
    return above & ~was_above & slow_ma.shift().notna(), ~above & was_above


def run_loop(fast=FAST, slow=SLOW):
    """Reference backtest: signal at the close, whole shares at the next open, fee on both sides."""
    buy, sell = (s.shift(1, fill_value=False).to_numpy() for s in crossings(ohlc["Close"], fast, slow))
    cash, shares, trades, values = CASH, 0, 0, []
    for i, (open_, close) in enumerate(zip(ohlc["Open"].to_numpy(), ohlc["Close"].to_numpy())):
        if buy[i] and not shares:
            shares = math.floor(cash / (open_ * (1 + FEE)))
            cash -= shares * open_ * (1 + FEE)
            trades += 1
        elif sell[i] and shares:
            cash += shares * open_ * (1 - FEE)
            shares = 0
        values.append(cash + shares * close)
    return pd.Series(values, index=ohlc.index), trades


loop_value, loop_trades = run_loop()
buy, sell = crossings(ohlc["Close"], FAST, SLOW)
print("crossed above:", ", ".join(f"{d:%Y-%m-%d}" for d in buy[buy].index))
print("crossed below:", ", ".join(f"{d:%Y-%m-%d}" for d in sell[sell].index))
print(f"trades: {loop_trades} | ending value: ${loop_value.iloc[-1]:,.2f}")
crossed above: 2019-04-04, 2022-12-22, 2023-12-21, 2025-06-25
crossed below: 2018-10-05, 2022-02-04, 2023-09-27, 2024-09-16
trades: 4 | ending value: $662,107.87Backtest results are hypothetical, based on past data only, and are not an indication of future results.
Four buys in almost eleven years. A 50/200 rule is lazy by design. The October 2018 sell signal does nothing because the loop holds nothing yet: when both averages first exist, the fast one is already above the slow one, and the rule waits for a real crossing. Libraries disagree on edge cases like that without telling you, so the loop pins it down. For one long-only rule on one ticker, the loop is also enough on its own.
Step 3: the same rule in backtesting.py
backtesting.py is the most compact of the three: a strategy class with an init that declares indicators and a next that runs once per bar.
from backtesting import Backtest, Strategy  # pip install backtesting
from backtesting.lib import crossover


def sma(values, n):
    """Simple moving average, in the form backtesting.py's self.I() expects."""
    return pd.Series(values).rolling(n).mean()


class SmaCross(Strategy):
    fast, slow = FAST, SLOW

    def init(self):
        self.fast_ma = self.I(sma, self.data.Close, self.fast)
        self.slow_ma = self.I(sma, self.data.Close, self.slow)

    def next(self):
        if crossover(self.fast_ma, self.slow_ma):
            self.buy()
        elif crossover(self.slow_ma, self.fast_ma):
            self.position.close()


def run_backtesting(fast=FAST, slow=SLOW):
    """backtesting.py: market orders fill at the next bar's open unless trade_on_close=True."""
    stats = Backtest(ohlc, SmaCross, cash=CASH, commission=FEE).run(fast=fast, slow=slow)
    return stats["_equity_curve"]["Equity"], stats["# Trades"]


bp_value, bp_trades = run_backtesting()
print(f"trades: {bp_trades} | ending value: ${bp_value.iloc[-1]:,.2f}")
trades: 3 | ending value: $662,107.87Backtest results are hypothetical, based on past data only, and are not an indication of future results.
Same ending value with no extra settings. Market orders fill at the next bar’s open, and buy() with no size spends 99.99% of available liquidity on whole shares (API reference), which produced the same whole-share orders as the loop on this data. The trade count is the odd one out at 3. The fourth position is still open on the last day, and backtesting.py leaves open trades out of its statistics.
Step 4: the same rule in backtrader
backtrader is the event-driven veteran, with a Cerebro engine, a broker, sizers and analyzers. It takes the most code because it’s modelling a broker.
import backtrader as bt  # pip install backtrader


class SmaCrossBT(bt.Strategy):
    params = dict(fast=FAST, slow=SLOW)

    def __init__(self):
        self.cross = bt.ind.CrossOver(bt.ind.SMA(period=self.p.fast), bt.ind.SMA(period=self.p.slow))

    def next_open(self):
        """Runs at each bar's open with the previous bar's indicator values (needs cheat_on_open=True)."""
        if not self.position and self.cross[0] > 0:
            self.buy(size=math.floor(self.broker.getcash() / (self.data.open[0] * (1 + FEE))))
        elif self.position and self.cross[0] < 0:
            self.close()


class DailyValue(bt.Analyzer):
    """Portfolio value at each close."""

    def start(self):
        self.values = {}

    def next(self):
        self.values[pd.Timestamp(self.data.datetime.date(0))] = self.strategy.broker.getvalue()

    def get_analysis(self):
        return self.values


def run_backtrader(fast=FAST, slow=SLOW):
    """backtrader with cheat_on_open, so each buy is sized at the open it fills at."""
    cerebro = bt.Cerebro(stdstats=False, cheat_on_open=True)
    cerebro.adddata(bt.feeds.PandasData(dataname=ohlc))
    cerebro.addstrategy(SmaCrossBT, fast=fast, slow=slow)
    cerebro.broker.setcash(CASH)
    cerebro.broker.setcommission(commission=FEE)
    cerebro.addanalyzer(DailyValue, _name="value")
    cerebro.addanalyzer(bt.analyzers.TradeAnalyzer, _name="trades")
    strat = cerebro.run()[0]
    return pd.Series(strat.analyzers.value.get_analysis()), strat.analyzers.trades.get_analysis().total.total


bt_value, bt_trades = run_backtrader()
print(f"trades: {bt_trades} | ending value: ${bt_value.iloc[-1]:,.2f}")
trades: 4 | ending value: $662,107.87Backtest results are hypothetical, based on past data only, and are not an indication of future results.
The line that matters is cheat_on_open=True. In a normal next() backtrader knows today’s close and fills the order at tomorrow’s open, so an all-in order sized at the close runs short of cash whenever the stock gaps up overnight. With cheat_on_open, backtrader calls next_open() before the broker fills anything, with the indicators still holding the previous day’s values (Cerebro docs). The order is sized at the open it fills at, the signal still comes from yesterday’s close, and nothing looks ahead.
Step 5: the same rule in vectorbt
vectorbt has no per-bar next(). You hand it whole arrays of entry and exit signals, and a simulator compiled with Numba walks through them.
import vectorbt as vbt  # pip install vectorbt


def run_vectorbt(fast=FAST, slow=SLOW):
    """vectorbt: signals moved one day later and filled at that day's open, whole shares only."""
    close = ohlc["Close"]
    fast_ma, slow_ma = vbt.MA.run(close, fast), vbt.MA.run(close, slow)
    pf = vbt.Portfolio.from_signals(
        close,
        entries=fast_ma.ma_crossed_above(slow_ma).shift(1, fill_value=False),
        exits=fast_ma.ma_crossed_below(slow_ma).shift(1, fill_value=False),
        price=ohlc["Open"], init_cash=CASH, fees=FEE, size_granularity=1, freq="1D")
    return pf.value(), pf.trades.count()


started = time.perf_counter()
vbt_value, vbt_trades = run_vectorbt()
vbt_first = time.perf_counter() - started
print(f"trades: {vbt_trades} | ending value: ${vbt_value.iloc[-1]:,.2f}")
print(f"first call: {vbt_first:.1f} s")
trades: 4 | ending value: $662,107.87
first call: 4.5 sBacktest results are hypothetical, based on past data only, and are not an indication of future results.
Matching the loop took three arguments: shift(1) moves each signal to the next day, price=ohlc["Open"] fills it at that day’s open, and size_granularity=1 buys whole shares. The first call took 4.5 seconds, against 23 milliseconds once warm. That’s Numba compiling. vectorbt marks most of its compiled functions cache=True (see its source), which writes the result to disk, so the very first run after installing is slower still and later processes mostly load from the cache. A notebook pays the rest once per kernel; a script rerun from the command line pays it every time.
The best Python backtesting library for one backtest and for a sweep
Now the four side by side. Each timing is the median of five more warm runs, measured with time.perf_counter.
def max_drawdown(values):
    """Largest fall from a previous peak, as a positive fraction."""
    return float(-(values / values.cummax() - 1).min())


def timed(fn, repeat=5):
    """Median wall-clock seconds over `repeat` runs."""
    times = []
    for _ in range(repeat):
        started = time.perf_counter()
        fn()
        times.append(time.perf_counter() - started)
    return float(np.median(times))


runs = {"plain loop": (run_loop, loop_value, loop_trades),
        "backtesting.py": (run_backtesting, bp_value, bp_trades),
        "backtrader": (run_backtrader, bt_value, bt_trades),
        "vectorbt": (run_vectorbt, vbt_value, vbt_trades)}
table = pd.DataFrame({
    name: {"ending_value": value.iloc[-1],
           "max_gap_vs_loop": float((value - loop_value).abs().max()),
           "max_drawdown": max_drawdown(value),
           "trades": trades,
           "ms_per_run": timed(fn) * 1000}
    for name, (fn, value, trades) in runs.items()}).T
print(table.to_string(formatters={"ending_value": "{:,.2f}".format, "max_gap_vs_loop": "{:.1e}".format,
                                  "max_drawdown": "{:.1%}".format, "trades": "{:.0f}".format,
                                  "ms_per_run": "{:.1f}".format}))

GRID = list(product(range(10, 100, 10), range(100, 325, 25)))  # 9 fast x 9 slow windows
PAIRS = pd.MultiIndex.from_tuples(GRID, names=["fast", "slow"])


def sweep_vectorbt():
    """Ending value for every GRID pair in one vectorbt call."""
    close = ohlc["Close"]
    fast_ma = vbt.MA.run(close, [f for f, _ in GRID], short_name="fast")
    slow_ma = vbt.MA.run(close, [s for _, s in GRID], short_name="slow")
    pf = vbt.Portfolio.from_signals(
        close,
        entries=fast_ma.ma_crossed_above(slow_ma).shift(1, fill_value=False),
        exits=fast_ma.ma_crossed_below(slow_ma).shift(1, fill_value=False),
        price=ohlc["Open"], init_cash=CASH, fees=FEE, size_granularity=1, freq="1D")
    return pd.Series(pf.value().iloc[-1].to_numpy(), index=PAIRS)


def sweep(run):
    """Ending value for every GRID pair, one backtest at a time."""
    return pd.Series([run(f, s)[0].iloc[-1] for f, s in GRID], index=PAIRS)


started = time.perf_counter()
grid_vbt = sweep_vectorbt()
sweep_seconds = {"vectorbt, first call": time.perf_counter() - started}
grids = {}
for name, run in [("plain loop", run_loop), ("backtesting.py", run_backtesting),
                  ("backtrader", run_backtrader), ("vectorbt", None)]:
    started = time.perf_counter()
    grids[name] = sweep(run) if run else sweep_vectorbt()
    sweep_seconds[name] = time.perf_counter() - started
print(f"\n{len(GRID)} pairs, seconds per sweep and largest gap from the loop:")
for name, seconds in sweep_seconds.items():
    gap = (grids.get(name, grid_vbt) - grids["plain loop"]).abs().max()
    print(f"  {name:<20} {seconds:7.2f} s   gap {gap:.1e}")
rank = int(grid_vbt.rank(ascending=False)[(FAST, SLOW)])
best_fast, best_slow = grid_vbt.idxmax()
print(f"ending values: min ${grid_vbt.min():,.0f} | median ${grid_vbt.median():,.0f} | "
      f"max ${grid_vbt.max():,.0f} at {best_fast}/{best_slow} | 50/200 ranks {rank} of {len(GRID)}")

COLOURS = {"plain loop": "#52514e", "backtesting.py": "#2a78d6", "backtrader": "#eb6834", "vectorbt": "#1baf7a"}
NOTE = ("Data: Market Data (marketdata.app), adjusted for splits and dividends.\nBacktest results are hypothetical, "
        "based on past data only, and are not an indication of future results.")


def tidy(ax):
    """House style: no top or right spine, light horizontal grid."""
    ax.spines[["top", "right"]].set_visible(False)
    ax.grid(axis="x" if ax.get_xscale() == "log" else "y", color="#e6e6e3", lw=0.8)


# Chart: time per backtest and per sweep (the chart at the top)
fig, (one, many) = plt.subplots(1, 2, figsize=(11, 4.2))
names = list(COLOURS)
one_ms = list(table["ms_per_run"]) + [vbt_first * 1000]
many_s = [sweep_seconds[n] for n in names] + [sweep_seconds["vectorbt, first call"]]
labels = names + ["vectorbt, first call"]
for ax, vals, unit, title in [(one, one_ms, "ms", "One backtest, milliseconds"),
                              (many, many_s, "s", f"{len(GRID)}-pair sweep, seconds")]:
    bars = ax.barh(labels[::-1], vals[::-1], color=[*["#b9e6d4"], *[COLOURS[n] for n in names[::-1]]])
    ax.set_xscale("log")
    ax.bar_label(bars, labels=[f"{v:,.1f} {unit}" if v >= 1 else f"{v:,.2f} {unit}" for v in vals[::-1]],
                 padding=3, fontsize=9)
    ax.set_xlim(min(vals) / 2, max(vals) * 8)
    ax.set_title(title, loc="left", fontsize=11)
    tidy(ax)
many.set_yticklabels([])
fig.suptitle("ASML 50/200 crossover, Jan 2016 to Nov 2026: the same answer at very different speeds",
             x=0.01, ha="left", fontsize=12)
fig.text(0.01, -0.03, "Median of 5 warm runs for one backtest; one run per sweep; 2-core cloud server.\n" + NOTE, va="top",
         fontsize=8, color="#52514e")
plt.tight_layout()
plt.savefig("asml-backtest-speed.png", dpi=150, bbox_inches="tight")

# Chart: price, averages and fills above the four value lines
holding, fills = False, []
for day, b, s in zip(ohlc.index, buy.shift(1, fill_value=False), sell.shift(1, fill_value=False)):
    if (b and not holding) or (s and holding):
        holding = not holding
        fills.append((day, "#1baf7a" if holding else "#b2182b"))
fig, (top, bottom) = plt.subplots(2, 1, figsize=(10, 7), sharex=True, height_ratios=[3, 2])
top.plot(ohlc.index, ohlc["Close"], color="#9a9a96", lw=1, label="ASML close (adjusted)")
top.plot(ohlc.index, ohlc["Close"].rolling(FAST).mean(), color="#2a78d6", lw=1.3, label="50-day average")
top.plot(ohlc.index, ohlc["Close"].rolling(SLOW).mean(), color="#eb6834", lw=1.3, label="200-day average")
for day, colour in fills:
    top.axvline(day, color=colour, ls=":", lw=1.1)
top.set_ylabel("US dollars")
top.set_title("ASML: 50-day and 200-day averages, with the dates the backtest traded", loc="left")
top.legend(loc="upper left", fontsize=9)
for name, value, width in [("plain loop", loop_value, 5), ("backtesting.py", bp_value, 3.5),
                           ("backtrader", bt_value, 2), ("vectorbt", vbt_value, 1)]:
    bottom.plot(value.index, value, color=COLOURS[name], lw=width, label=name)
bottom.yaxis.set_major_formatter(plt.matplotlib.ticker.StrMethodFormatter("${x:,.0f}"))
bottom.set_ylabel("Value of $100,000")
bottom.legend(loc="upper left", fontsize=9, title="four implementations, one line", title_fontsize=9)
for ax in (top, bottom):
    tidy(ax)
fig.text(0.01, 0.0, NOTE, va="top", fontsize=8, color="#52514e")
plt.tight_layout(rect=(0, 0.02, 1, 1))
plt.savefig("asml-sma-crossover.png", dpi=150, bbox_inches="tight")

# Chart: ending value for every pair in the sweep
heat = grid_vbt.unstack("slow") / 1000
fig, ax = plt.subplots(figsize=(9, 5.5))
im = ax.imshow(heat, cmap="Blues", aspect="auto", origin="lower")
ax.set_xticks(range(len(heat.columns)), heat.columns)
ax.set_yticks(range(len(heat.index)), heat.index)
for i in range(len(heat.index)):
    for j in range(len(heat.columns)):
        ax.text(j, i, f"{heat.iat[i, j]:,.0f}", ha="center", va="center", fontsize=7.5,
                color="white" if heat.iat[i, j] > heat.values.mean() + heat.values.std() else "#222222")
ax.add_patch(plt.Rectangle((list(heat.columns).index(SLOW) - 0.5, list(heat.index).index(FAST) - 0.5), 1, 1,
                           fill=False, ec="#eb6834", lw=2))
ax.set_xlabel("Slow average, trading days")
ax.set_ylabel("Fast average, trading days")
ax.set_title("ASML crossover: ending value of 100,000 US dollars, in thousands, Jan 2016 to Nov 2026 (50/200 outlined)",
             loc="left", fontsize=10)
fig.colorbar(im, ax=ax, shrink=0.8, label="US dollars, thousands")
fig.text(0.01, -0.02, NOTE + " Computed with vectorbt.", va="top", fontsize=8, color="#52514e")
plt.savefig("asml-sweep-heatmap.png", dpi=150, bbox_inches="tight")
ending_value max_gap_vs_loop max_drawdown trades ms_per_run
plain loop 662,107.87 0.0e+00 37.9% 4 2.1
backtesting.py 662,107.87 1.2e-10 37.9% 3 39.1
backtrader 662,107.87 1.2e-10 37.9% 4 248.2
vectorbt 662,107.87 1.2e-10 37.9% 4 23.2
81 pairs, seconds per sweep and largest gap from the loop:
vectorbt, first call 3.76 s gap 9.3e-10
plain loop 0.18 s gap 0.0e+00
backtesting.py 3.40 s gap 9.3e-10
backtrader 20.93 s gap 7.0e-10
vectorbt 0.06 s gap 9.3e-10
ending values: min $414,832 | median $662,108 | max $1,901,525 at 30/150 | 50/200 ranks 41 of 81Backtest results are hypothetical, based on past data only, and are not an indication of future results.
The first table is the agreement check. max_gap_vs_loop is the largest difference from the loop’s value on any of the 2,736 days, and it’s floating-point noise far below a cent. The worst fall from a peak was 37.9% in all four, and the trade counts differ only because backtesting.py skips the open position.
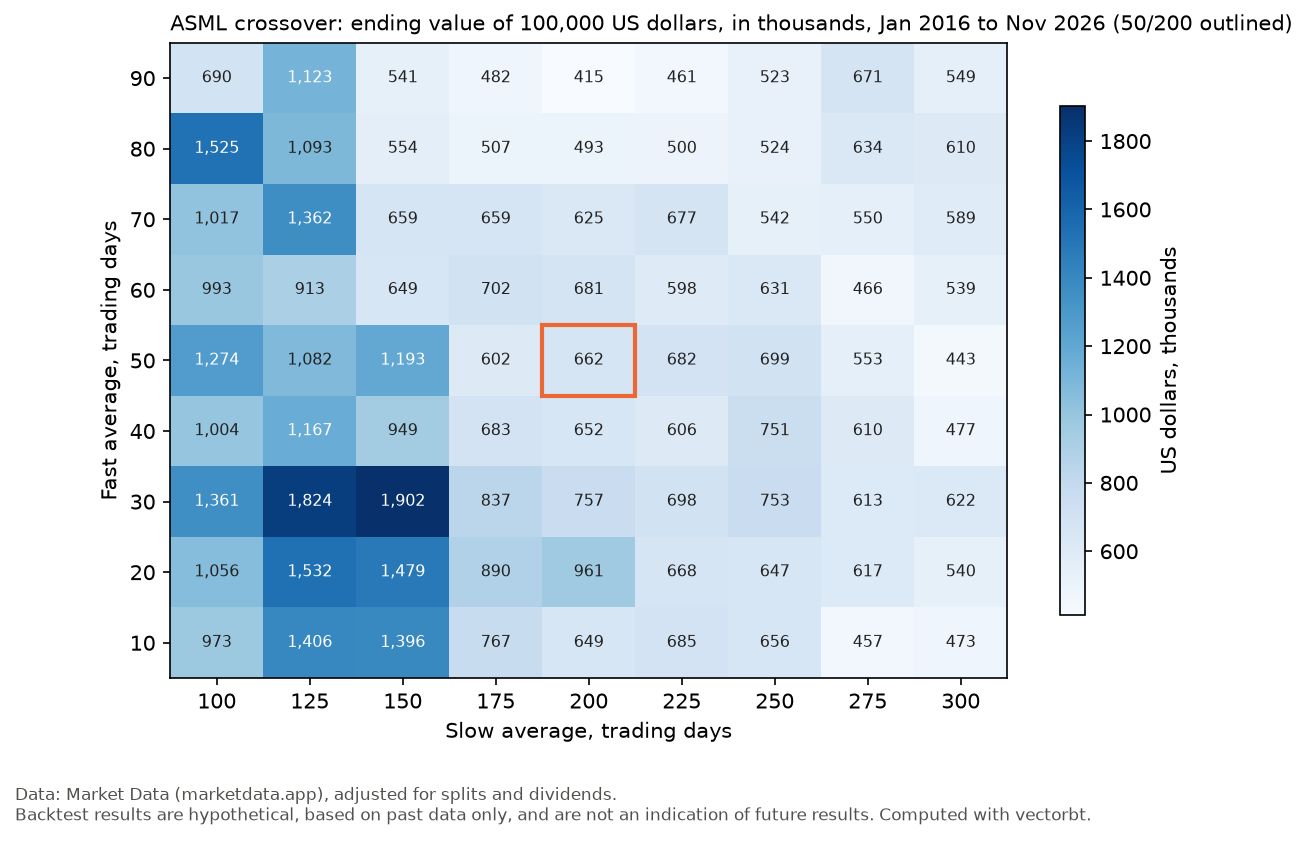
One backtest took the loop 2.1 milliseconds, vectorbt 23, backtesting.py 39 and backtrader 248, about 6 times backtesting.py’s time. The sweep covers all 81 pairs of a 10-to-90-day fast average and a 100-to-300-day slow one, and every library returns the same 81 answers as the loop. backtrader needed 20.9 seconds, backtesting.py 3.4, the loop 0.18 and vectorbt 0.06, after a first call of 3.8 seconds spent mostly compiling for the two-dimensional arrays a sweep passes in. That’s backtrader at 323 times vectorbt’s warm time. In fairness, the other three ran the pairs one at a time in one process, and backtrader’s optimizer can spread a grid over CPU cores, which on two cores would at best halve its time.
The sweep also shows how much rides on two numbers. Across the grid the ending value ran from $414,832 to $1,901,525, and the textbook 50/200 pair ranked 41 of 81, the exact middle. Backtest results are hypothetical, based on past data only, and are not an indication of future results. A sweep is good at showing how fragile a rule is and poor at choosing settings.
So which is the best Python backtesting library? It depends on the job. These are the facts I’d weigh.
| Library | Version tested | Licence | Last release on PyPI | One backtest | 81-pair sweep |
|---|---|---|---|---|---|
| backtesting.py | 0.6.6 | AGPL-3.0 | 22 July 2026 | 39 ms | 3.4 s |
| backtrader | 1.9.78.123 | GPL-3.0 or later | 19 April 2023 | 248 ms | 20.9 s |
| vectorbt | 1.2.1 | Apache 2.0 with Commons Clause | 11 November 2026 | 23 ms | 0.06 s |
Versions, licences and dates come from each project’s PyPI page (backtesting, backtrader, vectorbt) and vectorbt’s licence file. The timings are from this run.
For one strategy on daily bars I’d start with backtesting.py: the least code, defaults that matched the loop with no extra settings, and a stats report and an interactive chart (Backtest.plot) included. For sweeps across parameters or tickers, vectorbt, once you’ve learnt to think in arrays and made peace with the compile wait. backtrader earns its place when you need its broker model, order types and live-trading plumbing, but its last PyPI release was in April 2023, so every pandas or Python upgrade is your problem. And read the licences before building anything you plan to sell. The GPL and AGPL attach conditions to code you distribute, with the AGPL also covering software offered to users over a network, and the Commons Clause on vectorbt bars selling a product whose value comes substantially from it.
What can go wrong
Here’s the same rule written the way each library’s own examples do it.
class SmaCrossDefault(bt.Strategy):
    """backtrader the quickstart way: buy() with no size."""

    def __init__(self):
        self.cross = bt.ind.CrossOver(bt.ind.SMA(period=FAST), bt.ind.SMA(period=SLOW))

    def next(self):
        if not self.position and self.cross > 0:
            self.buy()
        elif self.position and self.cross < 0:
            self.close()


cerebro = bt.Cerebro(stdstats=False)
cerebro.adddata(bt.feeds.PandasData(dataname=ohlc))
cerebro.addstrategy(SmaCrossDefault)
cerebro.broker.setcash(CASH)
cerebro.broker.setcommission(commission=FEE)
cerebro.addanalyzer(DailyValue, _name="value")
bt_default = pd.Series(cerebro.run()[0].analyzers.value.get_analysis())

close = ohlc["Close"]
fast_ma, slow_ma = vbt.MA.run(close, FAST), vbt.MA.run(close, SLOW)
pf_default = vbt.Portfolio.from_signals(close, fast_ma.ma_crossed_above(slow_ma),
                                        fast_ma.ma_crossed_below(slow_ma),
                                        init_cash=CASH, fees=FEE, freq="1D")
vbt_default = pf_default.value()
first_fill = pf_default.orders.records_readable.iloc[0]

final_stats = Backtest(ohlc, SmaCross, cash=CASH, commission=FEE, finalize_trades=True).run()
print(f"backtrader, buy() with no size:   ${bt_default.iloc[-1]:,.2f}")
print(f"vectorbt, no price or shift:      ${vbt_default.iloc[-1]:,.2f}, first buy of "
      f"{first_fill['Size']:.4f} shares at {first_fill['Price']:.2f} on {first_fill['Timestamp']:%Y-%m-%d}")
print(f"backtesting.py, finalize_trades:  ${final_stats['Equity Final [$]']:,.2f}, "
      f"{final_stats['# Trades']} trades")
print(f"loop, for comparison:             ${loop_value.iloc[-1]:,.2f}, {loop_trades} trades")

# Chart: what the defaults do to the same rule
fig, ax = plt.subplots(figsize=(10, 4.8))
ax.plot(loop_value.index, loop_value, color="#52514e", lw=2.2, label="loop and the three matched libraries")
ax.plot(vbt_default.index, vbt_default, color=COLOURS["vectorbt"], lw=1.3,
        label="vectorbt default: fills at the signal day's close, fractional shares")
ax.plot(bt_default.index, bt_default, color=COLOURS["backtrader"], lw=1.6,
        label="backtrader default: buy() buys one share")
ax.yaxis.set_major_formatter(plt.matplotlib.ticker.StrMethodFormatter("${x:,.0f}"))
ax.set_ylabel("Value of $100,000")
ax.set_title("ASML 50/200 crossover, Jan 2016 to Nov 2026: one rule, three answers", loc="left")
ax.legend(loc="upper left", fontsize=9)
tidy(ax)
fig.text(0.01, -0.02, NOTE, va="top", fontsize=8, color="#52514e")
plt.savefig("asml-library-defaults.png", dpi=150, bbox_inches="tight")

# Every number quoted in the text, in one place: rerun with a new END and compare
figures = {
    "n_days": len(ohlc),
    "cash": CASH,
    "fee": FEE,
    "end_value": float(loop_value.iloc[-1]),
    "n_trades": loop_trades,
    "bp_trades": int(bp_trades),
    "dd": max_drawdown(loop_value),
    "max_gap": float(table["max_gap_vs_loop"].max()),
    "vbt_first": vbt_first,
    "ms_loop": float(table.loc["plain loop", "ms_per_run"]),
    "ms_bp": float(table.loc["backtesting.py", "ms_per_run"]),
    "ms_bt": float(table.loc["backtrader", "ms_per_run"]),
    "ms_vbt": float(table.loc["vectorbt", "ms_per_run"]),
    "bt_vs_bp": float(table.loc["backtrader", "ms_per_run"] / table.loc["backtesting.py", "ms_per_run"]),
    "n_grid": len(GRID),
    "sweep_loop": sweep_seconds["plain loop"],
    "sweep_bp": sweep_seconds["backtesting.py"],
    "sweep_bt": sweep_seconds["backtrader"],
    "sweep_vbt": sweep_seconds["vectorbt"],
    "sweep_vbt_first": sweep_seconds["vectorbt, first call"],
    "bt_vs_vbt": sweep_seconds["backtrader"] / sweep_seconds["vectorbt"],
    "grid_min": float(grid_vbt.min()),
    "grid_median": float(grid_vbt.median()),
    "grid_max": float(grid_vbt.max()),
    "rank": rank,
    "bt_default_end": float(bt_default.iloc[-1]),
    "vbt_default_end": float(vbt_default.iloc[-1]),
    "bp_final_trades": int(final_stats["# Trades"]),
    "bp_final_gap": float(abs(final_stats["Equity Final [$]"] - loop_value.iloc[-1])),
}
backtrader, buy() with no size: $101,120.38
vectorbt, no price or shift: $648,338.76, first buy of 543.2932 shares at 183.88 on 2019-04-04
backtesting.py, finalize_trades: $662,587.71, 4 trades
loop, for comparison: $662,107.87, 4 tradesBacktest results are hypothetical, based on past data only, and are not an indication of future results.
backtrader buys one share. Call buy() with no size and backtrader asks its default sizer, which buys a stake of 1. There’s no warning and no error. It ends at $101,120, because $100,000 sat in cash for a decade while a single ASML share did the trading. Backtest results are hypothetical, based on past data only, and are not an indication of future results. The fix is an explicit size, and then you’re back at the next-open problem from Step 4.
vectorbt fills at the signal’s own close. Without price, from_signals fills on the bar that produced the signal, at its close, with fractional shares and all the cash. The first buy lands on the April 2019 crossing day at that day’s close. The rule only knows the averages have crossed once the close prints, so that’s a fill nobody could have got. Here it happened to end lower, at $648,339; on another stock it could as easily end higher. The whole difference is in the setup. Backtest results are hypothetical, based on past data only, and are not an indication of future results.
backtesting.py hides the open trade, then closes it at the open. The default report counts 3 trades because the 2025 position is still open. With finalize_trades=True it counts 4, and the ending value moves by $480. backtesting.py closes the open trade at the last bar’s open price and charges one more commission on the way out. Backtest results are hypothetical, based on past data only, and are not an indication of future results.
No library catches the rest. Market Data rewrites the adjusted history after every dividend, so a rerun shifts price levels slightly. Picking ASML in 2026 is hindsight. A test across many stocks needs the delisted ones too, or it only measures survivors.
What to watch
The figures stop at 18 November 2026. Change END and rerun; the figures dict in the last block holds every number quoted here. The open trade stays open until the 50-day average crosses back under the 200-day, and only then do the three trade counts agree.
vectorbt shipped three releases between 9 October and 11 November 2026, according to its PyPI history, so pin the version you tested. A new pandas major is the likeliest thing to break backtrader, which hasn’t had a release since 2023. The portfolio backtesting post hit exactly that when pandas 3.0 removed a set of frequency aliases.
The moving averages post builds this rule’s indicators in pandas, the RSI tutorial does Wilder’s oscillator, the yfinance alternatives test compares data sources for any of these libraries, and the ASML deep dive covers the company.
My longer company research is published on the newsletter Sector Playbook, which is available by email subscription.
Sources
ASML Holding N.V., annual report on Form 20-F for 2025 (Nasdaq listing under ASML). Market Data, stock candles endpoint (adjustment defaults). backtesting.py API reference (fills, order size, finalize_trades). backtrader documentation: Cerebro (cheat_on_open) and Sizers (default stake). vectorbt Portfolio API (from_signals). PyPI pages for backtesting, backtrader and vectorbt (versions, licences, release dates) and vectorbt’s licence file.
*Time: 25 minutes. Python 3.12.14, backtesting 0.6.6, backtrader 1.9.78.123, marketdata 1.3.0, matplotlib 3.11.2, numpy 2.5.4, pandas 3.1.0, vectorbt 1.2.1. API key: a Market Data token (affiliate link) for ASML; history back to 2016 needs the Trader plan or higher, with a 30-day free trial (Apple works without a token). Market Data provides this site’s data access. Tested 19 November 2026 on a two-core cloud server.*
Disclaimer
Disclosure: I have no position in ASML. I have no position in the other companies discussed (AAPL). I also hold diversified funds (IWDA, QQQ, SPY, VWRL) that may include some of these companies. Positions checked on 19 November 2026.
Affiliate disclosure: some links in this post are affiliate links. If you buy through one, I may earn a commission at no extra cost to you. It does not change what I write about the product.
This article is general information about a listed company, written for educational purposes. It is not investment advice and not a personal recommendation to buy, sell or hold any security, and it does not take into account anyone’s financial situation or objectives. I am not a registered investment adviser or a licensed financial services provider. Figures come from company filings and the other sources linked in the text, as of the dates given, and may have changed since. I may hold positions in the securities discussed; see the disclosure above. Investment decisions call for independent research or the advice of a licensed professional.
This is my own research, done with the help of AI tools.