How to build a finance MCP server for SEC EDGAR data in Python
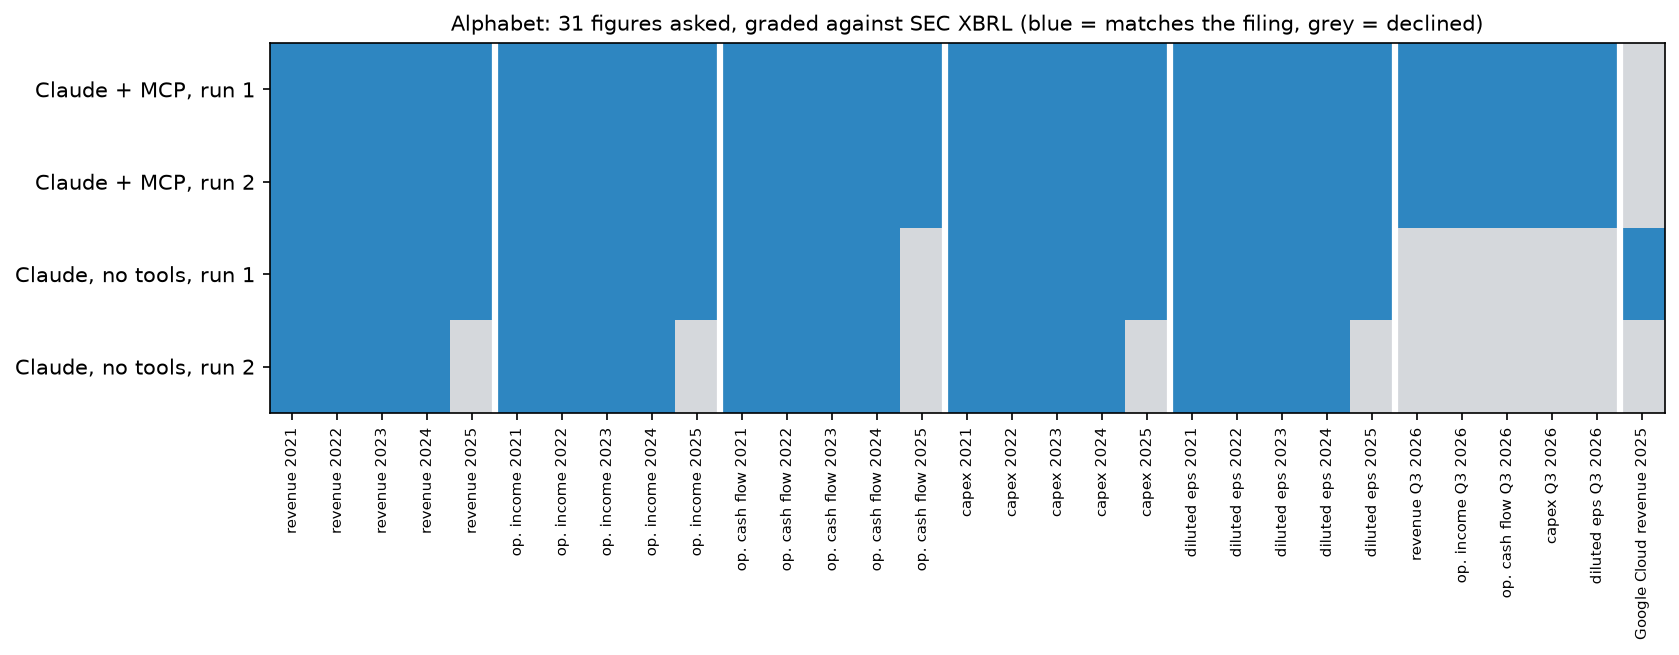
I gave Claude Code a finance MCP server, 130 lines of Python that read SEC EDGAR, and asked it for 31 Alphabet figures. It ran the job twice and got 30 of them exactly as filed both times. That included the third quarter of 2026 from the 10-Q Alphabet filed on 29 October: revenue of $127.6 billion and capex of $51.4 billion. The 10-Q’s cash flow statement only gives capex year to date, so the model had to work out the exact quarterly figure itself. Without the server, the same model declined every Q3 figure. The one miss was Google Cloud revenue, which the 10-K reports at $58.7 billion and which my server couldn’t see. The reason is a rule in the SEC’s own API, and it will catch anyone who builds one of these.
What a finance MCP server does, and why SEC EDGAR is the place to start
The Model Context Protocol is plumbing, and fairly dull plumbing at that. Claude Code starts your server as a child process, and the two pass JSON-RPC messages over stdin and stdout, one per line. The server lists its tools, Claude decides when to call one, and the result lands in the model’s context. The model reads the number off the filing. It doesn’t have to remember it.
SEC EDGAR makes a good first source because it’s free and needs no key. The EDGAR APIs return a company’s XBRL facts as JSON, and the SEC asks for two things: a User-Agent that says who you are, and no more than 10 requests a second. The SEC EDGAR API tutorial covers those endpoints. The server below wraps the same companyfacts call in four tools a model can call.
The setup: four tools, the standard library and requests
I skipped the MCP SDK on purpose. The protocol is small enough to write by hand, and doing it that way shows you exactly what the model gets back, which matters later. Save this as sec_edgar_mcp.py:
import json
import os
import sys
from datetime import date
from functools import lru_cache

import requests

# The SEC asks every script to identify itself. Set your own contact first:
#   export SEC_USER_AGENT="Your Name you@example.com"
HEADERS = {"User-Agent": os.environ["SEC_USER_AGENT"]}
SERVER = {"name": "sec-edgar", "version": "0.2.0"}

TOOLS = [
    {"name": "find_company",
     "description": "Look up a US-listed company by ticker. Returns its SEC CIK and registered name.",
     "inputSchema": {"type": "object", "properties": {"ticker": {"type": "string"}}, "required": ["ticker"]}},
    {"name": "search_concepts",
     "description": "Search the us-gaap XBRL concepts a company has reported (name or label contains the text).",
     "inputSchema": {"type": "object", "properties": {"ticker": {"type": "string"}, "text": {"type": "string"}},
                     "required": ["ticker", "text"]}},
    {"name": "annual_values",
     "description": ("Full-year values of one us-gaap concept from the company's 10-K filings, one row per fiscal "
                     "year end, with the period, the filing date and the accession number."),
     "inputSchema": {"type": "object",
                     "properties": {"ticker": {"type": "string"}, "concept": {"type": "string"},
                                    "years": {"type": "integer", "default": 5}},
                     "required": ["ticker", "concept"]}},
    {"name": "quarterly_values",
     "description": ("Values of one us-gaap concept from the company's 10-Q filings, newest first. Each row has its "
                     "period start and end and its length in days: income statement rows cover three months or the "
                     "year to date, cash flow rows only the year to date."),
     "inputSchema": {"type": "object",
                     "properties": {"ticker": {"type": "string"}, "concept": {"type": "string"},
                                    "limit": {"type": "integer", "default": 12}},
                     "required": ["ticker", "concept"]}},
]


@lru_cache(maxsize=1)
def tickers():
    """Ticker -> (CIK, name), from the SEC's own list."""
    data = requests.get("https://www.sec.gov/files/company_tickers.json", headers=HEADERS, timeout=30).json()
    return {v["ticker"]: (v["cik_str"], v["title"]) for v in data.values()}


@lru_cache(maxsize=8)
def facts(ticker):
    """Every us-gaap fact the company has filed (companyfacts API)."""
    cik, _ = tickers()[ticker.upper()]
    url = f"https://data.sec.gov/api/xbrl/companyfacts/CIK{cik:010d}.json"
    return requests.get(url, headers=HEADERS, timeout=60).json()["facts"]["us-gaap"]


def find_company(ticker):
    cik, name = tickers()[ticker.upper()]
    return {"ticker": ticker.upper(), "cik": cik, "name": name}


def search_concepts(ticker, text):
    hits = [{"concept": c, "label": n.get("label"), "units": list(n["units"])}
            for c, n in facts(ticker).items()
            if text.lower() in c.lower() or text.lower() in (n.get("label") or "").lower()]
    return hits[:40]


def annual_values(ticker, concept, years=5):
    rows = {}
    for unit, items in facts(ticker)[concept]["units"].items():
        for f in items:
            if f.get("form") != "10-K" or "start" not in f:
                continue
            days = (date.fromisoformat(f["end"]) - date.fromisoformat(f["start"])).days
            if 340 <= days <= 390 and f["filed"] >= rows.get(f["end"], {}).get("filed", ""):
                rows[f["end"]] = {"period_start": f["start"], "period_end": f["end"], "value": f["val"],
                                  "unit": unit, "filed": f["filed"], "accession": f["accn"]}
    return [rows[k] for k in sorted(rows)][-years:]


def quarterly_values(ticker, concept, limit=12):
    rows = {}
    for unit, items in facts(ticker)[concept]["units"].items():
        for f in items:
            if f.get("form") != "10-Q" or "start" not in f:
                continue
            key = (f["start"], f["end"])
            if f["filed"] >= rows.get(key, {}).get("filed", ""):
                days = (date.fromisoformat(f["end"]) - date.fromisoformat(f["start"])).days + 1
                rows[key] = {"period_start": f["start"], "period_end": f["end"], "days": days, "value": f["val"],
                             "unit": unit, "filed": f["filed"], "accession": f["accn"]}
    return sorted(rows.values(), key=lambda r: (r["period_end"], -r["days"]), reverse=True)[:limit]


def handle(msg):
    """Answer one JSON-RPC message from the MCP client (None for notifications)."""
    method, params = msg.get("method"), msg.get("params", {})
    if "id" not in msg:
        return None
    if method == "initialize":
        result = {"protocolVersion": params.get("protocolVersion", "2025-06-18"),
                  "capabilities": {"tools": {}}, "serverInfo": SERVER}
    elif method == "tools/list":
        result = {"tools": TOOLS}
    elif method == "tools/call":
        fn = {"find_company": find_company, "search_concepts": search_concepts, "annual_values": annual_values,
              "quarterly_values": quarterly_values}
        try:
            out = fn[params["name"]](**params.get("arguments", {}))
            result = {"content": [{"type": "text", "text": json.dumps(out)}], "isError": False}
        except Exception as e:
            result = {"content": [{"type": "text", "text": f"{type(e).__name__}: {e}"}], "isError": True}
    elif method == "ping":
        result = {}
    else:
        return {"jsonrpc": "2.0", "id": msg["id"], "error": {"code": -32601, "message": f"unknown method {method}"}}
    return {"jsonrpc": "2.0", "id": msg["id"], "result": result}


def serve():
    """Read one JSON message per line on stdin, write each answer as one line on stdout."""
    for line in sys.stdin:
        if line.strip():
            reply = handle(json.loads(line))
            if reply is not None:
                sys.stdout.write(json.dumps(reply) + "\n")
                sys.stdout.flush()


if __name__ == "__main__" and "--stdio" in sys.argv:
    serve()
Three choices in that code shape the results. annual_values keeps one row per fiscal year and takes it from the latest 10-K that reported it, so older years arrive as later filings restated them. quarterly_values hands over every 10-Q period with its length in days and lets the model sort them out, since a 10-Q mixes three-month and year-to-date figures. And everything comes from companyfacts. That last choice is the one that lost Google Cloud.
Test the server before Claude sees it
handle() is the whole protocol, so you can call it from Python and see exactly what a client will receive. Run this in a notebook after the server code, or paste it at the bottom of a scratch copy of the file:
# Talk to the server the way Claude Code does: one JSON-RPC message at a time
init = handle({"jsonrpc": "2.0", "id": 1, "method": "initialize", "params": {"protocolVersion": "2025-06-18"}})
print(init["result"]["serverInfo"])
listed = handle({"jsonrpc": "2.0", "id": 2, "method": "tools/list"})
print([t["name"] for t in listed["result"]["tools"]])
call = handle({"jsonrpc": "2.0", "id": 3, "method": "tools/call",
               "params": {"name": "quarterly_values",
                          "arguments": {"ticker": "GOOGL", "concept": "PaymentsToAcquirePropertyPlantAndEquipment",
                                        "limit": 3}}})
for row in json.loads(call["result"]["content"][0]["text"]):
    print(row["period_start"], row["period_end"], f'{row["days"]:>3} days', f'{row["value"]:>18,}', row["accession"])
{'name': 'sec-edgar', 'version': '0.2.0'}
['find_company', 'search_concepts', 'annual_values', 'quarterly_values']
2026-01-01 2026-09-30 273 days 131,953,000,000 0001652044-26-000084
2026-01-01 2026-06-30 181 days 80,598,000,000 0001652044-26-000071
2026-01-01 2026-03-31 90 days 35,674,000,000 0001652044-26-000048That 273-day row is the trap in any Q3 question. The cash flow statement in Alphabet’s 10-Q reports purchases of property and equipment only year to date, and the XBRL follows it, so that row holds nine months of capex, $132.0 billion. Third-quarter capex is that figure minus the 181-day row. A model that grabs the newest number overstates the quarter about two and a half times.
Connect it to Claude Code
Claude Code picks up project servers from a .mcp.json file in the folder you start it in, and the MCP documentation covers the other scopes. Mine sat next to the server file:
{"mcpServers": {"sec-edgar": {"type": "stdio", "command": "python3", "args": ["sec_edgar_mcp.py", "--stdio"]}}}claude mcp add --scope project sec-edgar -- python3 sec_edgar_mcp.py --stdio writes an equivalent entry. In my runs the server inherited the environment Claude Code was started in, so export SEC_USER_AGENT=... in that shell was enough. I ran Claude Code headless with claude -p and --dangerously-skip-permissions, in a scratch folder holding only those two files, because nobody is there to approve tool calls in a headless run. The headless docs show the narrower route, pre-approving tools with --allowedTools, and on your own machine approving the server’s tools when Claude asks is the saner default.
The prompt asked for 31 figures and contained two traps, the quarterly capex and the segment revenue:
Use only the tools from the sec-edgar MCP server for the figures. Do not search the web and do not fill anything in from memory.

For Alphabet Inc. (ticker GOOGL), give:

A. For each fiscal year 2021 through 2025: revenue (total revenues), operating_income (income from operations), operating_cash_flow (net cash provided by operating activities), capex (purchases of property and equipment) and diluted_eps (diluted net income per share).

B. For the third quarter of 2026, the three months ended September 30, 2026: revenue, operating_income, operating_cash_flow, capex and diluted_eps.

C. google_cloud_revenue_2025: Google Cloud segment revenue for fiscal 2025.

For each figure, state the XBRL concept and the accession number of the filing it came from, and say how you got it if it was not reported directly. If the tools do not return a figure, write "NOT AVAILABLE" and say why in one sentence.
It ended by asking for a JSON reply. I ran it twice with the server and twice without. The no-tools version swapped the first paragraph for “Answer from what you already know. Do not search the web, open files or use any tools”, asked for “UNKNOWN” in place of “NOT AVAILABLE”, and dropped the requests for concepts, accessions, derivations and commentary, so it asked for the JSON alone. One caveat if you want to reproduce this: the scratch folder sat inside my research notes, and Claude Code loads the CLAUDE.md files in the folders above where it starts. Mine asks for sources and for missing facts to be flagged, which may have nudged the runs toward those honest “NOT AVAILABLE” answers.
What Claude did with the server
Grading needs the filed figures, and the server’s own functions provide them. The code spells out the two things the model had to work out for itself: Alphabet changed its revenue tag, and 10-Q cash flow is year to date.
import matplotlib.pyplot as plt
import numpy as np

YEARS = ["2021", "2022", "2023", "2024", "2025"]
CONCEPTS = {"revenue": ["Revenues", "RevenueFromContractWithCustomerExcludingAssessedTax"],
            "operating_income": ["OperatingIncomeLoss"],
            "operating_cash_flow": ["NetCashProvidedByUsedInOperatingActivities"],
            "capex": ["PaymentsToAcquirePropertyPlantAndEquipment"],
            "diluted_eps": ["EarningsPerShareDiluted"]}


def filed_annual(metric):
    """Fiscal-year values by year, trying each concept in turn (Alphabet switched its revenue tag)."""
    out = {}
    for concept in CONCEPTS[metric]:
        for row in annual_values("GOOGL", concept, years=10):
            out.setdefault(row["period_end"][:4], row["value"])
    return out


def filed_q3_2026(metric):
    """Three months to 30 September 2026; cash flow lines are year to date in a 10-Q, so subtract."""
    rows = quarterly_values("GOOGL", CONCEPTS[metric][0], limit=20)
    ytd = {(r["period_start"], r["period_end"]): r["value"] for r in rows}
    if ("2026-07-01", "2026-09-30") in ytd:
        return ytd[("2026-07-01", "2026-09-30")]
    return ytd[("2026-01-01", "2026-09-30")] - ytd[("2026-01-01", "2026-06-30")]


truth = {f"{m} {y}": filed_annual(m)[y] for m in CONCEPTS for y in YEARS}
truth.update({f"{m} Q3 2026": filed_q3_2026(m) for m in CONCEPTS})
print(f"{len(truth)} filed figures to check against")
30 filed figures to check againstGoogle Cloud revenue is out of the server’s reach, so the grading code reads it straight from the 10-K’s XBRL instance. The next section explains why the server can’t.
import xml.etree.ElementTree as ET


def segment_value(cik, accn, instance, concept, member, start, end):
    """One concept for one business segment, read from a filing's own XBRL instance."""
    url = f"https://www.sec.gov/Archives/edgar/data/{cik}/{accn.replace('-', '')}/{instance}"
    root = ET.fromstring(requests.get(url, headers=HEADERS, timeout=60).content)
    contexts = set()
    for ctx in root.iter("{http://www.xbrl.org/2003/instance}context"):
        members = [m.text for m in ctx.iter("{http://xbrl.org/2006/xbrldi}explicitMember")]
        dates = [d.text for d in ctx.iter() if d.tag.endswith(("startDate", "endDate"))]
        if members == [member] and dates == [start, end]:
            contexts.add(ctx.get("id"))
    return next(float(el.text) for el in root.iter()
                if el.tag.endswith("}" + concept) and el.get("contextRef") in contexts)


cloud = segment_value(1652044, "0001652044-26-000018", "goog-20251231_htm.xml",
                      "RevenueFromContractWithCustomerExcludingAssessedTax", "goog:GoogleCloudMember",
                      "2025-01-01", "2025-12-31")
truth["Google Cloud revenue 2025"] = cloud
print(f"Google Cloud revenue, fiscal 2025: ${cloud:,.0f}")
Google Cloud revenue, fiscal 2025: $58,705,000,000Then the saved JSON replies go through a strict grade. An answer counts as right only if it matches the filed figure exactly, to the dollar or, for EPS, to the cent. Everything else is declined or wrong.
U = None  # "UNKNOWN" or "NOT AVAILABLE" in the saved reply
# Each saved JSON reply, in truth order: five metrics x 2021-2025, the five Q3 2026 figures, then Google Cloud
MCP = [257_637_000_000, 282_836_000_000, 307_394_000_000, 350_018_000_000, 402_836_000_000,
       78_714_000_000, 74_842_000_000, 84_293_000_000, 112_390_000_000, 129_039_000_000,
       91_652_000_000, 91_495_000_000, 101_746_000_000, 125_299_000_000, 164_713_000_000,
       24_640_000_000, 31_485_000_000, 32_251_000_000, 52_535_000_000, 91_447_000_000,
       5.61, 4.56, 5.80, 8.04, 10.81,
       127_577_000_000, 40_576_000_000, 42_290_000_000, 51_355_000_000, 2.12, U]
MEMORY_1 = MCP[:14] + [U] + MCP[15:25] + [U] * 5 + [58_705_000_000]
MEMORY_2 = [v if i % 5 != 4 else U for i, v in enumerate(MCP[:25])] + [U] * 6
ANSWERS = {"Claude + MCP, run 1": MCP, "Claude + MCP, run 2": MCP,
           "Claude, no tools, run 1": MEMORY_1, "Claude, no tools, run 2": MEMORY_2}


def grade(answer, filed):
    """2 = matches the filing exactly (to the cent), 1 = declined (UNKNOWN / NOT AVAILABLE), 0 = wrong."""
    if answer is None:
        return 1
    return 2 if round(answer, 2) == round(filed, 2) else 0


scores = {run: [grade(a, f) for a, f in zip(vals, truth.values())] for run, vals in ANSWERS.items()}
for run, s in scores.items():
    print(f"{run:<24} right {s.count(2):>2}   declined {s.count(1):>2}   wrong {s.count(0)}")

fig, ax = plt.subplots(figsize=(12, 3.2))
ax.imshow(np.array(list(scores.values())), cmap=plt.matplotlib.colors.ListedColormap(["#c0392b", "#d5d8dc", "#2e86c1"]),
          vmin=0, vmax=2, aspect="auto")
ax.set_yticks(range(len(scores)), list(scores))
ax.set_xticks(range(len(truth)), [k.replace("operating_", "op. ").replace("_", " ") for k in truth], rotation=90, fontsize=7)
for x in (4.5, 9.5, 14.5, 19.5, 24.5, 29.5):
    ax.axvline(x, color="white", lw=3)
ax.set_title("Alphabet: 31 figures asked, graded against SEC XBRL (blue = matches the filing, grey = declined)", fontsize=10)
plt.savefig("googl-mcp-scorecard.png", dpi=150, bbox_inches="tight")
Claude + MCP, run 1 right 30 declined 1 wrong 0
Claude + MCP, run 2 right 30 declined 1 wrong 0
Claude, no tools, run 1 right 25 declined 6 wrong 0
Claude, no tools, run 2 right 20 declined 11 wrong 0With the server, the runs took 47 and 56 seconds and returned the same 30 figures, each with its concept and accession number. Both caught the revenue tag switch without being told about it. The Revenues series has no 2022 row because Alphabet’s 10-Ks for 2022, 2023 and 2024 tagged total revenue as RevenueFromContractWithCustomerExcludingAssessedTax, and the 2025 10-K went back to Revenues. Both runs spotted the gap, took $282.8 billion for 2022 from the other concept and checked that the two concepts agree in the years they share. Both also derived Q3 cash flow by subtracting the six-month figure from the nine-month one, which is how a 10-Q has to be read.
The runs without tools made nothing up this time, and the wrong-answer count across all four runs is 0. They still disagreed with each other. One knew Alphabet’s fiscal 2025 revenue and Google Cloud revenue; the other, given the identical prompt, declined every 2025 figure. Both declined every Q3 2026 figure, so that column is grey in both rows. The ASML version of this test went worse for memory, with wrong R&D, capex and cash figures. With a server, nobody has to guess what the model happens to remember on a given run.
The same functions give the cash flow picture quarter by quarter:
def quarters_2026(concept):
    """Q1, Q2 and Q3 2026 from year-to-date 10-Q values."""
    ytd = {r["period_end"]: r["value"] for r in quarterly_values("GOOGL", concept, limit=20)
           if r["period_start"] == "2026-01-01"}
    q = [ytd["2026-03-31"], ytd["2026-06-30"], ytd["2026-09-30"]]
    return [q[0], q[1] - q[0], q[2] - q[1]]


ocf_q = quarters_2026("NetCashProvidedByUsedInOperatingActivities")
capex_q = quarters_2026("PaymentsToAcquirePropertyPlantAndEquipment")
ocf_a = [filed_annual("operating_cash_flow")[y] for y in YEARS]
capex_a = [filed_annual("capex")[y] for y in YEARS]
for label, o, c in zip(["Q1 2026", "Q2 2026", "Q3 2026"], ocf_q, capex_q):
    print(f"{label}: operating cash flow ${o / 1e9:.1f}B, capex ${c / 1e9:.1f}B")

fig, (a1, a2) = plt.subplots(1, 2, figsize=(11, 4), gridspec_kw={"width_ratios": [5, 3]})
x = np.arange(len(YEARS))
a1.bar(x - 0.2, np.array(ocf_a) / 1e9, 0.4, label="Operating cash flow", color="#2e86c1")
a1.bar(x + 0.2, np.array(capex_a) / 1e9, 0.4, label="Capex (purchases of PP&E)", color="#e67e22")
a1.set_xticks(x, [f"FY{y}" for y in YEARS])
a1.set_ylabel("$ billion")
a1.set_title("Fiscal years, from the 10-Ks")
a1.legend(frameon=False)
x = np.arange(3)
a2.bar(x - 0.2, np.array(ocf_q) / 1e9, 0.4, color="#2e86c1")
a2.bar(x + 0.2, np.array(capex_q) / 1e9, 0.4, color="#e67e22")
a2.set_xticks(x, ["Q1 2026", "Q2 2026", "Q3 2026"])
a2.set_title("2026 quarters, derived from year-to-date 10-Qs")
fig.suptitle("Alphabet: operating cash flow and capex, as the MCP server returns them (SEC XBRL)", y=1.04)
plt.savefig("googl-capex-vs-cash-flow.png", dpi=150, bbox_inches="tight")
Q1 2026: operating cash flow $45.8B, capex $35.7B
Q2 2026: operating cash flow $39.1B, capex $44.9B
Q3 2026: operating cash flow $42.3B, capex $51.4B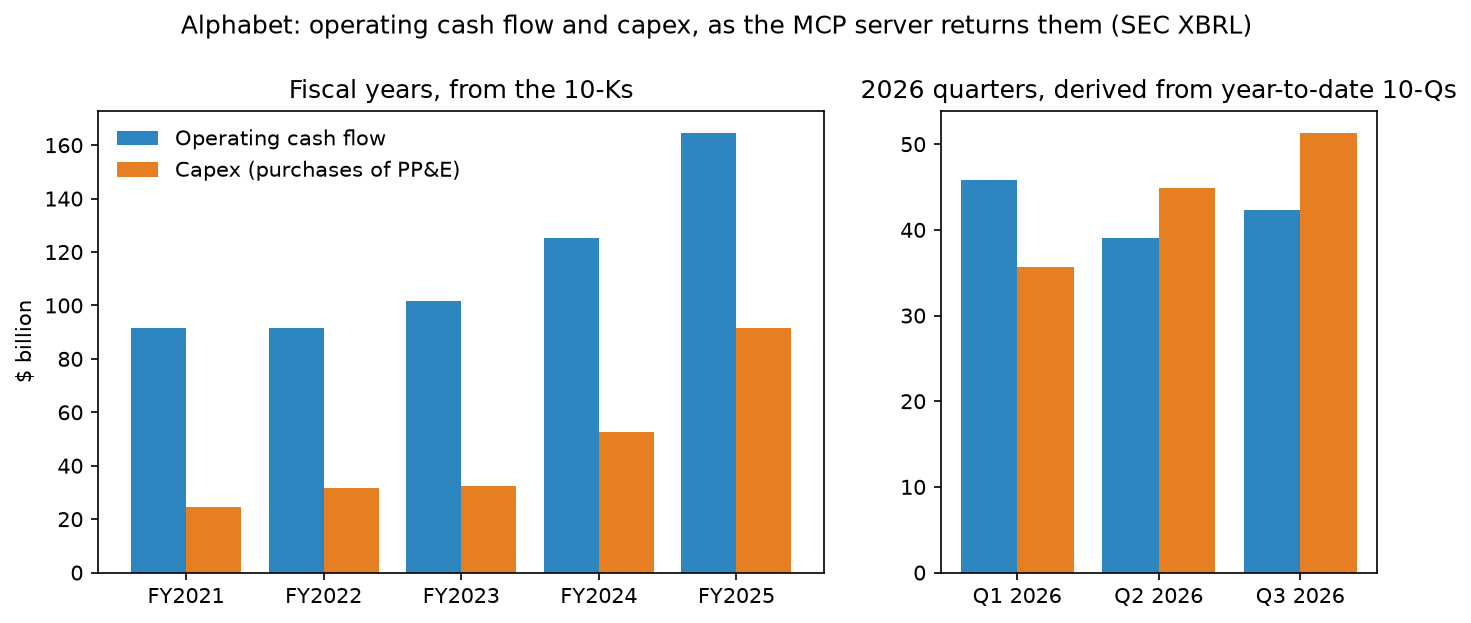
The fresh data is the reason to bother. In the first nine months of 2026, Alphabet’s capex of $132.0 billion ran ahead of its operating cash flow of $127.1 billion, and the third quarter alone had $51.4 billion of capex against $42.3 billion of operating cash flow. That’s a figure you want from a filing dated 29 October, and only the tool had it.
Where it went wrong
Google Cloud revenue. Both server runs answered “NOT AVAILABLE” and said a concept search for “Cloud” found nothing. That’s an honest answer, and the fault is my server’s. The SEC’s XBRL APIs only aggregate facts that use a standard taxonomy and apply to the entire filing entity. Segment revenue doesn’t qualify. In XBRL it’s the same revenue concept attached to a context that says StatementBusinessSegmentsAxis = GoogleCloudMember, and Alphabet’s companyfacts file doesn’t contain the Cloud figure anywhere. The filing’s own XBRL instance does, and segment_value in the grading code above is the fix: it reads that file and finds $58.7 billion, which matches the segment table in the fiscal 2025 10-K. There’s one more oddity in there. That 10-K tags consolidated revenue as Revenues and the segment rows as RevenueFromContractWithCustomerExcludingAssessedTax, so a segment tool that reuses the consolidated concept comes back empty. Turning segment_value into a fifth tool takes a few lines in TOOLS and handle(). The XBRL parser post does the same kind of digging for ASML’s revenue by region, another breakdown the summary API drops.
Restatements the server hides. Taking each year from the latest 10-K is usually what you want. Here’s when it isn’t. Alphabet’s fiscal 2021 10-K reported diluted EPS of $112.20. The server never shows that figure, because later 10-Ks restated it to $5.61 after the 20-for-one stock split announced on 1 February 2022. One run wrote that it assumed the EPS figures were restated for the split, “but the tool doesn’t say so”, and it had good reason to hedge. A server for research should put the accession and filing date next to every value, which this one does, and ideally the original figure as well.
nine_m = {k: next(r["value"] for r in quarterly_values("GOOGL", c, limit=20)
                  if (r["period_start"], r["period_end"]) == ("2026-01-01", "2026-09-30"))
          for k, c in [("ocf", "NetCashProvidedByUsedInOperatingActivities"),
                       ("capex", "PaymentsToAcquirePropertyPlantAndEquipment")]}
eps_2021_original = next(f["val"] for f in facts("GOOGL")["EarningsPerShareDiluted"]["units"]["USD/shares"]
                         if f["accn"] == "0001652044-22-000019" and f["end"] == "2021-12-31" and f.get("fp") == "FY")
print(f"FY2021 diluted EPS as first filed: ${eps_2021_original}, as the server returns it: ${truth['diluted_eps 2021']}")

figures = {
    "n_figures": len(truth),
    "mcp_right": scores["Claude + MCP, run 1"].count(2),
    "wrong_total": sum(s.count(0) for s in scores.values()),
    "q3_revenue": truth["revenue Q3 2026"],
    "q3_ocf": truth["operating_cash_flow Q3 2026"],
    "q3_capex": truth["capex Q3 2026"],
    "ocf_9m": nine_m["ocf"],
    "capex_9m": nine_m["capex"],
    "capex_2025": truth["capex 2025"],
    "capex_growth_2025": truth["capex 2025"] / truth["capex 2024"] - 1,
    "revenue_2022": truth["revenue 2022"],
    "cloud_2025": cloud,
    "eps_2021_original": eps_2021_original,
    "eps_2021_restated": truth["diluted_eps 2021"],
}
FY2021 diluted EPS as first filed: $112.2, as the server returns it: $5.61Adjectives. The numbers were exact. The commentary around them was looser. One run said annual capex had “nearly doubled” in 2025, when it rose 74% to $91.4 billion. Check the words around a tool’s numbers as carefully as the numbers.
What can go wrong with a finance MCP server
Anything printed to stdout breaks the protocol. The transport spec says the server must not write anything to stdout that isn’t a valid MCP message, so one stray print() in a tool corrupts the stream; log to stderr. Skip the User-Agent and you’re ignoring the SEC’s request that automated tools declare one. And companyfacts files are large, which is why the server keeps the last eight companies in memory.
The XBRL itself causes more trouble than the protocol. Companies switch concepts, as Alphabet did with revenue, so a tool that asks for one concept returns a series with a hole in it. Fiscal years don’t all end in December; the 340-to-390-day window catches a June year end, but the year label is the period end date. Filers that report under IFRS keep their facts under ifrs-full, and this server only reads us-gaap, so every tool except find_company errors out for them. Tool output also eats into the model’s context, which is why search_concepts stops at 40 hits.
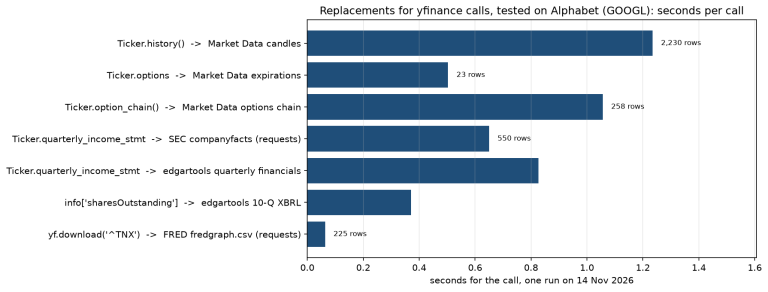
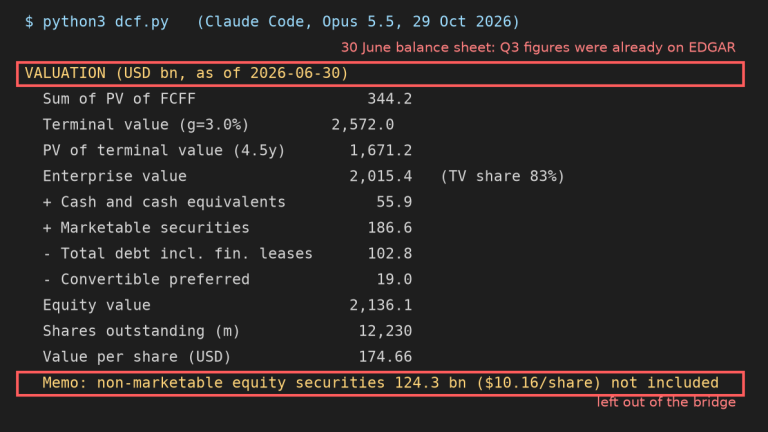
Then there’s trust. The model named the concept and accession behind every figure, and that’s the habit worth keeping, because it turns the Python check above into a five-minute job. The Claude Code DCF post shows what goes wrong when the model collects its own inputs, and the yfinance alternatives test covers price data, which EDGAR doesn’t carry.
What to watch
Alphabet’s fiscal 2026 10-K is the next test. The last two arrived on 5 February, so early February 2027 is a fair guess. If it stays on Revenues, any tool that asks only for the older concept will keep losing the newest year. The same filing will show whether capex kept running ahead of operating cash flow in the fourth quarter. On the tooling side, my server echoes whatever protocol version the client requests. That shortcut holds until a spec revision changes one of the messages it handles, so the next Claude Code release that moves the version is the one to retest.
My longer company research is published on the newsletter Sector Playbook, which is available by email subscription.
Sources
Alphabet’s fiscal 2025 10-K, Q3 2026 10-Q and fiscal 2021 10-K; the SEC’s EDGAR APIs and fair access rules; the MCP transport specification; Claude Code’s MCP, headless mode and memory documentation. Earlier on this site: Alphabet’s growth.
Tested 17 November 2026 with Claude Code 2.1.322 and its default model, claude-opus-5-5; Python 3.12.14, matplotlib 3.11.2, numpy 2.5.4, requests 2.34.2.
Disclaimer
Disclosure: I hold long GOOGL shares. I have no position in the other companies discussed (ASML). I also hold diversified funds (IWDA, QQQ, SPY, VWRL) that may include some of these companies. Positions checked on 17 November 2026.
This article is general information about a listed company, written for educational purposes. It is not investment advice and not a personal recommendation to buy, sell or hold any security, and it does not take into account anyone’s financial situation or objectives. I am not a registered investment adviser or a licensed financial services provider. Figures come from company filings and the other sources linked in the text, as of the dates given, and may have changed since. I may hold positions in the securities discussed; see the disclosure above. Investment decisions call for independent research or the advice of a licensed professional.
This is my own research, done with the help of AI tools.