A Modern Playbook for Spotting the Next Financial Crisis
Financial crises are often spoken of in the past tense, like historical cataclysms or “black swan” events that arrive without warning. But what if they aren’t? What if, instead of random bolts from the blue, they are the predictable final act of a long, slow, and observable process?
The economists Hyman Minsky and Charles Kindleberger dedicated their careers to this idea, arguing that the seeds of a crisis are sown not in times of trouble, but in periods of stability and prosperity. Their combined framework, a powerful lens for viewing market cycles, posits that “stability is destabilizing”. Prolonged calm breeds complacency, encouraging the very risk-taking that guarantees an eventual reckoning.
Today, as the global financial system evolves, their insights are more critical than ever. The core mechanisms of crisis have migrated from the familiar territory of regulated banks into the opaque world of non-bank financial intermediaries (NBFIs)—the hedge funds, private credit funds, and asset managers that now constitute the system’s “shadow plumbing”. Understanding how to spot the next crisis requires updating the classic playbook to see these new ghosts in the machine.
The Anatomy of a Bubble: Minsky and Kindleberger’s Timeless Framework
To anticipate a crisis, you must first understand its anatomy. Minsky provided the mechanics, while Kindleberger provided the narrative arc.
Minsky’s Financial Instability Hypothesis argues that capitalist economies are inherently unstable because of how they are financed. He saw an evolutionary cycle in lending, progressing through three stages as confidence and greed overtake caution:
- Hedge Finance: The most stable stage. Borrowers have enough cash flow to cover both the principal and interest on their debts. Think of a classic, affordable mortgage.
- Speculative Finance: As the good times roll, some shift to a riskier posture. Here, cash flows only cover the interest payments. The borrower is betting that they can roll over the principal, depending on functioning credit markets and stable asset prices.
- Ponzi Finance: The final, most fragile stage. Cash flows cover neither principal nor interest. The borrower’s survival depends entirely on asset prices continuing to rise, allowing them to sell at a profit or borrow even more just to service existing debt.
Kindleberger overlaid this mechanical process with a five-act drama that has repeated throughout financial history, from 17th-century Tulip bubble to the dot-com bust:
- Displacement: An external shock creates a new, exciting investment opportunity (a new technology, financial deregulation).
- Boom: Credit expands to fuel investment in this new area, driving up asset prices.
- Euphoria (or Mania): Prices detach from reality. The expectation of future price gains becomes the only reason to buy—a classic feature of Ponzi finance.
- Revulsion (The “Minsky Moment”): A point of realization arrives. Insiders start selling, a central bank tightens policy, or a key player defaults. The spell is broken.
- Crash (or Panic): The rush for the exits becomes a stampede. Forced selling to meet margin calls creates a deleveraging spiral, collapsing asset prices and freezing credit markets.
The crucial insight is that this is an endogenous process. The system generates its own instability. The key to prediction, therefore, is not to guess what will pop the bubble, but to measure the fragility of the bubble itself.
The New Fault Lines: Risk Has Migrated Beyond the Banks
The 2008 Global Financial Crisis was a classic banking crisis. Today, the greatest risks are accumulating elsewhere. Post-crisis regulations have made banks safer but have pushed risk-taking into the less regulated, more opaque world of NBFIs. Recent tremors, like the March 2020 Treasury market seizure and the 2022 UK pension fund (LDI) crisis, were centered not in banks, but in the leveraged activities of hedge funds and other non-bank players.
Two areas in this new landscape demand particular attention:
- Hidden Hedge Fund Leverage: While overall leverage in the financial system may seem modest, leverage exist within hedge funds. This leverage is often built up through financial plumbing like repurchase agreements (repos) and margin lending. This creates systemic risk through several channels: forced deleveraging can amplify asset price moves, and a shock can trigger a cascade of counterparty credit risks. The European Central Bank has noted that this leverage is often sourced in foreign currencies (primarily US dollars) from non-euro area lenders, making the system vulnerable to external shocks.
- The Treasury “Basis Trade”: A prime example of this hidden risk is the Treasury basis trade, an arbitrage strategy that exploits small price differences between Treasury bonds and their corresponding futures contracts. Because the price differences are tiny, hedge funds use immense leverage—sometimes up to 100-to-1—to make the trade profitable. This makes the strategy acutely vulnerable to funding and liquidity risks. A sudden market shock can trigger margin calls, forcing a rapid and massive unwind of these positions, which can destabilize the U.S. Treasury market—the supposed bedrock of the global financial system. This is precisely what contributed to the market turmoil in March 2020.
An Early-Warning Dashboard for the Modern Strategist
A modern crisis playbook must be multi-layered, tracking the slow build-up of vulnerabilities before turning to the high-frequency indicators of acute stress. Here are some of the most potent signals to watch.
Long-Lead Indicators (1-3 Years Out): Measuring the Fuel Load
These metrics track the slow, Minskyan process of rising financial fragility.
- Credit-to-GDP Gap: Championed by the Bank for International Settlements, this measures the deviation of private credit from its long-term trend. A large and sustained gap is one of the most reliable long-lead predictors of a future banking crisis.
- Covenant-Lite Loan Share: “Cov-lite” loans offer fewer protections for lenders. Their proliferation is a direct measure of deteriorating lending standards and heightened risk appetite. Having once been a rarity, cov-lite loans now represent over 85% of the leveraged loan market, a clear sign we are late in the credit cycle.
Medium-Lead Indicators (3-12 Months Out): The First Tremors
These signals capture the transition from latent vulnerability to emerging stress.
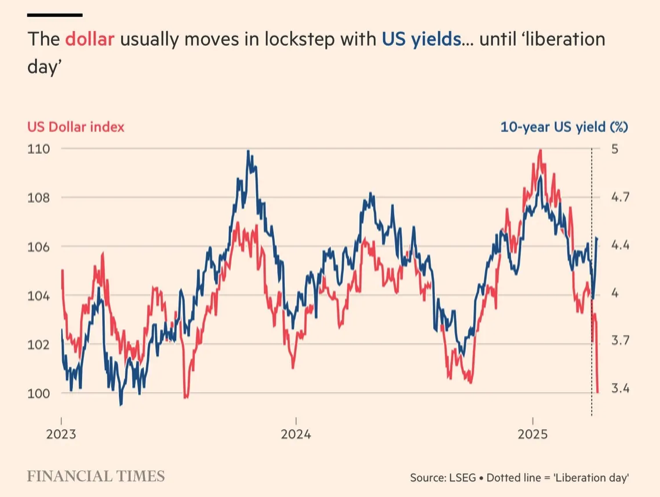
- Yield Curve Inversion (10-Year vs. 3-Month): A classic. An inverted yield curve, where short-term rates are higher than long-term rates, has preceded every U.S. recession since 1960. It signals that the market expects the central bank to cut rates to fight a future slowdown. However, it’s important to acknowledge that some indicators can generate false signals. The yield curve first inverted in October 2022, yet the expected recession failed to materialize by late 2024, leading to debate about whether the indicator’s reliability has diminished. This doesn’t invalidate the framework, but it adds crucial nuance, reminding us that these are probabilistic signals, not deterministic predictions.
- Bank Distance-to-Default: This market-based metric, derived from the Merton model, treats a bank’s equity like a call option on its assets. It measures how many standard deviations a bank’s asset value is from its default point. A declining trend is a powerful, forward-looking warning of rising credit risk, far superior to lagging accounting data.
Short-Lead Indicators (0-3 Months Out): The Spark in the Tinderbox
These are high-frequency, market-based indicators that signal the financial plumbing is actively breaking down.
- Cross-Currency Basis Swaps: This is a premier indicator of a global US dollar shortage. It measures the extra cost to borrow dollars synthetically through the FX swap market. A sharp move into more negative territory (e.g., from -20 bps to -100 bps) signals intense funding stress, a hallmark of the 2008 and March 2020 crises.
- VIX Term Structure Inversion: In normal times, long-term volatility expectations are higher than short-term ones. When this flips—a condition known as “backwardation”—it signals intense near-term market stress and a scramble for immediate downside protection. It’s the market screaming “danger ahead!”.
- ETF NAV Discounts: During extreme stress, fixed-income ETFs can trade at a significant discount to their Net Asset Value (NAV). Because the NAV is often calculated using stale bond prices, the ETF’s live market price can become a more accurate, real-time indicator of the true (and lower) clearing price for the illiquid underlying assets. It’s also worth noting that central bank interventions have become more aggressive since 2008, which can alter crisis dynamics. For instance, the Federal Reserve’s rapid response in March 2020, which included purchasing ETFs through the Secondary Market Corporate Credit Facility (SMCCF), helped prevent these NAV dislocations from spiraling into a broader crisis.
The Takeaway: Seeing the Minsky Moment Before It Arrives
Financial crises are not random acts of nature; they are features of the system. They are the result of a predictable cycle where prosperity and stability encourage the very leverage and speculation that lead to fragility and collapse.
The challenge for today’s strategist is that the fault lines have shifted. The most significant risks are no longer solely on bank balance sheets but are embedded in the complex, leveraged, and opaque strategies of non-bank financial players.
By adopting a Minsky-Kindleberger lens and updating our dashboards to monitor the new plumbing of the financial system, we can move from reacting to panics to anticipating them. The goal is not to predict the exact day of the crash, but to recognize the growing fragility long before the “Minsky Moment” becomes front-page news. The ghosts are always there; you just have to know where to look.