1. Python for Fundamental Analysis: Calculate P/E Ratio with Python
Welcome to the inaugural post of our exciting series: Python for Finance! In this series, we’ll explore the powerful intersection of Python programming and financial analysis, specifically focusing on Fundamental Analysis. If you’ve ever wondered about the real value behind a stock price, beyond the daily market noise, then fundamental analysis is your toolkit. It’s the practice of evaluating a company’s financial health, competitive positioning, and economic environment to estimate its intrinsic value and make informed investment decisions.
Traditionally, fundamental analysis involved manually sifting through dense financial reports, crunching numbers in spreadsheets, and spending hours collecting data. While the core principles remain timeless, the process has been revolutionized. Enter Python – a versatile, powerful programming language with an incredible ecosystem of libraries perfectly suited for financial tasks. Python allows us to automate data collection, perform complex calculations at scale, visualize trends, and ultimately, gain deeper insights faster than ever before. This series aims to equip you with the practical Python skills to enhance your fundamental analysis workflow, whether you’re a seasoned investor or just starting your financial journey.
Today, we begin with a key metric of stock valuation: the Price-to-Earnings (P/E) ratio. We’ll learn how to easily retrieve the necessary data and calculate this ratio using the popular yfinance library, which accesses data directly from Yahoo Finance. It’s often the first number investors look at, but understanding its nuances is key. Let’s dive in!
Understanding the Price-to-Earnings (P/E) Ratio
What Exactly Is the P/E Ratio?
At its core, the Price-to-Earnings (P/E) ratio is a simple concept: it compares a company’s current stock price to its earnings per share (EPS). Think of it as the market’s price tag for each dollar of a company’s profit.
Let’s break down the components:
- Market Price per Share: This is the current price at which a single share of the company’s stock is trading on the open market.
yfinanceprovides access to various price points (current, previous close, etc.). - Earnings Per Share (EPS): This represents the portion of a company’s profit allocated to each outstanding share of its common stock. It’s a crucial indicator of profitability on a per-share basis.
- (Components: Net Income, Preferred Dividends, Avg. Shares)
- We’ll focus on getting the Trailing Twelve Months (TTM) EPS directly using
yfinance.
Trailing vs. Forward P/E
You’ll often encounter two main flavors of P/E available via yfinance:
- Trailing P/E (P/E TTM): This uses the Trailing Twelve Months of actual, reported EPS (
trailingEpsinyfinance). It’s based on historical performance and is the focus of our calculation.yfinanceoften provides this pre-calculated astrailingPE. - Forward P/E: This uses estimated future EPS (
forwardEpsinyfinance) and is often provided pre-calculated asforwardPE. It reflects future expectations but relies on analyst estimates.
Why is the P/E Ratio So Important in Fundamental Analysis?
Despite its simplicity, the P/E ratio is a fundamental starting point for several reasons:
Screening Tool: Investors often use P/E ratios as an initial filter to screen for potential investment candidates (e.g., searching for low P/E “value” stocks or high P/E “growth” stocks – like we did in our previous screener posts!).
Valuation Gauge: It offers a quick, albeit rough, indication of whether a stock might be expensive or cheap relative to its earnings power. A very high P/E might suggest the market has high growth expectations baked into the price, while a low P/E could signal undervaluation, lower growth prospects, or higher perceived risk.
Comparative Analysis: Its real power often lies in comparison. How does Company A’s P/E stack up against Company B in the same industry? How does a company’s current P/E compare to its own historical average? Are the highest multiples in Company A justified by their fundamentals?
Market Sentiment Indicator: The P/E ratio implicitly captures the market’s mood and expectations regarding a company’s future prospects. A rising P/E might indicate growing optimism, while a falling P/E could suggest waning confidence.
Crucial Caveats and Limitations
Before we jump into the code, it’s vital to understand that the P/E ratio is not a magic bullet. Relying on it in isolation is dangerous. Keep these limitations in mind:
- Doesn’t Account for Debt: A company might have low P/E but be burdened by huge debt, making it riskier than a company with a higher P/E but a clean balance sheet. Metrics like EV/EBITDA (Enterprise Value to Earnings Before Interest, Taxes, Depreciation, and Amortization) can provide a more holistic view.
- Earnings Quality Matters: Net Income (the ‘E’ in P/E) can be influenced by accounting choices, one-off events (like asset sales), or even manipulation. Analysts often look at “quality of earnings” to ensure the reported profit is sustainable and reflects true operating performance.
- Negative Earnings: If a company has negative EPS (i.e., it’s losing money), the P/E ratio becomes meaningless or undefined. Our code will handle this.
- Cyclicality: For cyclical industries (e.g., automakers, construction), P/E ratios can be misleading. They might look low at the peak of an economic cycle (when earnings are high) and high at the bottom (when earnings are depressed).
- Growth Matters: A low P/E isn’t always good, and a high P/E isn’t always bad. A company growing its earnings rapidly might justify a higher P/E ratio than a company with stagnant earnings. The PEG ratio (P/E to Growth) attempts to account for this.
Think of the P/E ratio as one instrument on a dashboard – useful, but only providing part of the picture.
Python Implementation: Calculating P/E
Now, let’s use the yfinance library to fetch the necessary data (stock price and TTM EPS) and calculate the P/E ratio, or retrieve the pre-calculated value directly from Yahoo Finance data.
Library Requirement: If you haven’t used yfinance before, you’ll need to install it. Open your terminal or command prompt and run: pip install yfinance
No API Key Needed: A major advantage of yfinance is that it doesn’t typically require an API key for accessing publicly available Yahoo Finance data.
Here’s the Python code:
import yfinance as yf
import pandas as pd # Only used for optional raw data display
import warnings

# Ignore specific warnings from yfinance if necessary (optional)
warnings.filterwarnings("ignore", category=FutureWarning)

def get_pe_ratio_yfinance(ticker_symbol):
    """
    Fetches stock data using yfinance and calculates or retrieves the TTM P/E ratio.

    Args:
        ticker_symbol (str): The stock ticker symbol.

    Returns:
        None: Prints the results directly.
    """
    print(f"\nFetching data for ticker: {ticker_symbol} using yfinance")
    try:
        # Create Ticker object
        stock = yf.Ticker(ticker_symbol)

        # Fetch the .info dictionary
        # This can sometimes fail for various reasons (delisted ticker, network issue, etc.)
        info = stock.info
        # print(info) # Uncomment this to see all available keys in the info dict

        company_name = info.get('shortName', ticker_symbol) # Get name or use ticker

        print(f"\n--- Attempting P/E Calculation for {company_name} ---")

        # --- Method 1: Manual Calculation ---
        print("\nMethod 1: Manual Calculation from Price and EPS")
        current_price = info.get('currentPrice') or info.get('regularMarketPrice') or info.get('previousClose') # Try different price keys
        eps_ttm = info.get('trailingEps')

        # Validation Checks for Manual Calculation
        if current_price is None:
            print(" - Error: Could not find current price in yfinance info.")
        elif eps_ttm is None:
            print(" - Error: Could not find 'trailingEps' in yfinance info.")
        elif not isinstance(current_price, (int, float)):
            print(f" - Error: Price data is not numeric ({type(current_price)}).")
        elif not isinstance(eps_ttm, (int, float)):
            print(f" - Error: Trailing EPS data is not numeric ({type(eps_ttm)}).")
        elif eps_ttm <= 0:
            print(f" - Current Price: ${current_price:.2f}")
            print(f" - TTM EPS: ${eps_ttm:.2f}")
            print(f" - Calculated P/E Ratio (TTM): N/A (Negative or Zero EPS)")
        else:
            calculated_pe = current_price / eps_ttm
            print(f" - Current Price: ${current_price:.2f}")
            print(f" - TTM EPS: ${eps_ttm:.2f}")
            print(f" - Calculated P/E Ratio (TTM): {calculated_pe:.2f}")

        # --- Method 2: Direct Retrieval ---
        print("\nMethod 2: Direct Retrieval of Trailing P/E")
        trailing_pe = info.get('trailingPE')

        # Validation Checks for Direct Retrieval
        if trailing_pe is None:
            print(" - Error: Could not find 'trailingPE' key in yfinance info.")
        elif not isinstance(trailing_pe, (int, float)):
            print(f" - Error: Trailing P/E data is not numeric ({type(trailing_pe)}).")
        elif trailing_pe <=0:
             print(f" - Directly Retrieved P/E Ratio (TTM): {trailing_pe:.2f} (Meaningless or Negative)")
        else:
            print(f" - Directly Retrieved P/E Ratio (TTM): {trailing_pe:.2f}")

    except Exception as e:
        # Catch potential errors during yf.Ticker() or accessing .info
        print(f"Error processing {ticker_symbol} with yfinance: {e}")
        print("       (Ticker might be invalid, delisted, or temporary data issue)")

# --- Main Execution Block ---
if __name__ == "__main__":
    TICKER = 'AAPL' # Change this to analyze different stocks

    get_pe_ratio_yfinance(TICKER)

    # You could loop through multiple tickers:
    # ticker_list = ['AAPL', 'MSFT', 'GOOGL', 'NONEXISTENT']
    # for t in ticker_list:
    #     get_pe_ratio_yfinance(t)
    #     print("-" * 30)

    print("\nDisclaimer: This information is for educational purposes only...")
    print("Data provided by Yahoo Finance via yfinance library.")
Code Explanation: Step-by-Step
Let’s break down the yfinance-based Python script:
- Import Libraries: We import
yfinanceasyf.pandasis included optionally if you want to uncomment the raw data display later.warningshelps suppress non-critical library messages. get_pe_ratio_yfinanceFunction: This function now encapsulates the logic for getting P/E usingyfinance. It takes theticker_symbolas input.- Fetching Data:
stock = yf.Ticker(ticker_symbol)creates a Ticker object, which is the entry point for getting data about that specific stock.info = stock.infoattempts to fetch the.infodictionary. This dictionary is a collection of summary information about the stock provided by Yahoo Finance (price, volume, fundamentals, company info, etc.). Crucially, the availability and exact names of keys within.infocan sometimes vary, making error handling important. The entire fetch is wrapped in atry...exceptblock to catch errors if the ticker is invalid or data retrieval fails.
- Method 1: Manual Calculation:
- Data Extraction: It attempts to get the price using
info.get('currentPrice')or falls back to other common price keys (regularMarketPrice,previousClose) if the first isn’t found. It gets the TTM EPS usinginfo.get('trailingEps'). Using.get()preventsKeyErrorif a specific key doesn’t exist in the dictionary for that ticker, returningNoneinstead. - Validation: Checks if both price and EPS were successfully retrieved (
is not None), ensures they are numeric types (intorfloat), and handles the case whereeps_ttmis zero or negative (where P/E is meaningless). - Calculation & Output: If validation passes, it calculates
current_price / eps_ttmand prints the result clearly.
- Data Extraction: It attempts to get the price using
- Method 2: Direct Retrieval:
- Data Extraction: It directly attempts to retrieve the pre-calculated trailing P/E ratio using
info.get('trailingPE'). - Validation: Checks if the
trailingPEkey exists and if the value is numeric. It also notes if the retrieved P/E is zero or negative (which can happen if EPS is negative). - Output: Prints the directly retrieved
trailingPEvalue. Often, this is the simplest way if the key is available.
- Data Extraction: It directly attempts to retrieve the pre-calculated trailing P/E ratio using
- Error Handling: The main
try...except Exception as e:block catches broader errors during theyf.Ticker()or.infocall. - Main Execution Block (
if __name__ == "__main__":): Standard practice to ensure the example code runs only when the script is executed directly. It calls the function for a sampleTICKER.
Interpreting the P/E Ratio Results
The code output should look something similar to below:
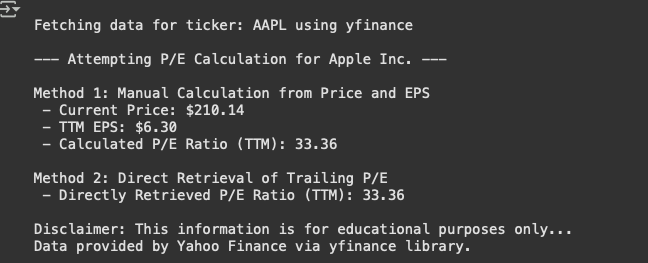
This number means that on April 28, 2025, the stock market valued Apple at $33.36 for every $1 of its earnings over the previous twelve months. To understand if this is high, low, or fair, you would need to compare it to:
- Apple’s historical P/E: Is it higher or lower than its average over recent years?
- Competitors’ P/E: How does it compare to other large tech companies (e.g., Microsoft, Google)?
- Market Average P/E: How does it compare to the overall market P/E (e.g., S&P 500 average)?
- Growth Expectations: Does Apple’s expected future earnings growth justify this valuation?
Practical Uses & Next Steps
How might you use this script?
- Quick Valuation Check: Quickly get the current P/E for stocks on your watchlist using
yfinance. - Competitor Comparison: Modify the script to loop through a list of competitor tickers and compare their P/E ratios (either calculated or directly retrieved).
- Basis for Screening: Integrate this logic into a broader screener (like those in our previous posts) that filters stocks based on P/E and other metrics available in
yfinance.info.
Conclusion: Your First Step in Python-Powered Analysis
Congratulations! You’ve successfully taken a fundamental financial concept, the P/E ratio, and implemented a Python script to calculate it using the popular and accessible yfinance library. You’ve seen how Python can automate data gathering from Yahoo Finance and perform basic calculations, or even retrieve pre-calculated metrics, freeing you up to focus on interpretation and analysis.
We’ve explored what the P/E ratio represents, why it’s a common starting point for valuation, its crucial limitations, and how to interpret the results in context. We also demonstrated two ways yfinance can provide this data and the importance of handling potential data inconsistencies gracefully using .get() and validation checks. Remember, this is just one piece of the puzzle.
Next Up: Now that we’ve calculated a key ratio using yfinance, our next logical step is to gather the raw ingredients for deeper analysis directly from financial statements. In the next post in our ‘Python for Fundamental Analysis’ series, we’ll focus on Automating Financial Statement Data Retrieval. We’ll write Python code to pull entire Income Statements, Balance Sheets, and Cash Flow Statements laying the groundwork for calculating a much wider range of financial ratios and metrics.
Disclaimer: This blog post is for educational purposes only and does not constitute financial advice. Data is sourced from Yahoo Finance via the yfinance library; its accuracy, completeness, and availability are not guaranteed. Always conduct your own thorough research or consult with a qualified financial advisor before making any investment decisions.This blog post was drafted with the assistance of AI tools and reviewed and edited by the author.