7. Python for Fundamental Analysis: Automate Peer Company Analysis & Benchmarking
Welcome back to the Python for Fundamental Analysis series! We’ve built a solid foundation by calculating individual metrics and ratios for single companies. Check out the previous posts:
- Calculating P/E Ratio
- Automating Financial Statement Retrieval
- Calculating & Visualizing Profitability Ratios
- Analyzing Liquidity Ratios (Current & Quick)
- Analyzing Debt Ratios (Debt-to-Equity)
- Measuring Operational Efficiency (Turnover Ratios)
Analyzing a company in isolation, however, only tells part of the story. Is a P/E ratio of 25 high or low? Is a Net Profit Margin of 15% good or bad? The answer often depends on the industry and how the company stacks up against its competitors. This is where Peer Company Analysis comes in.
Peer analysis involves comparing a company’s financial metrics against a group of similar companies (its peers). It provides crucial context, helps identify strengths/weaknesses, and allows effective benchmarking.
In this post, we’ll use Python to automate fetching key pre-calculated Trailing Twelve Months (TTM) ratios for a group of peer companies directly from the FMP API and visualize the comparison using pandas and matplotlib bar charts.
Understanding Peer Company Analysis
Why is Peer Analysis Important?
- Contextual Benchmarking: See if performance is strong, weak, or average relative to competitors.
- Identifying Outliers: Spot companies significantly outperforming or underperforming, prompting investigation.
- Valuation Insights: Compare multiples (P/E, P/S, P/B, EV/EBITDA) to find potentially mispriced stocks within the sector.
- Strategic Assessment: Compare operational metrics (margins, ROE) for insights into competitive positioning.
- Industry Trends: Reveal broader industry performance or challenges.
Selecting the Peer Group
Choosing relevant peers is crucial. They should ideally share:
- Industry/Sector: Similar products/services and customer base.
- Business Model: Similar revenue generation and cost structures.
- Size (Optional): Similar market cap or revenue can make comparisons more direct.
- Geography (If relevant): Consider local regulations/economic factors.
Key Metrics for Comparison (via FMP’s /ratios-ttm/ endpoint)
The FMP /ratios-ttm/ endpoint conveniently provides many pre-calculated TTM ratios. We can compare metrics like:
- Valuation:
peRatioTTM,priceToSalesRatioTTM,priceToBookRatioTTM,enterpriseValueMultipleTTM(EV/EBITDA) - Profitability:
grossProfitMarginTTM,operatingProfitMarginTTM,netProfitMarginTTM,returnOnEquityTTM,returnOnAssetsTTM - Leverage:
debtEquityRatioTTM,debtRatioTTM - Liquidity:
currentRatioTTM,cashRatioTTM,quickRatioTTM - (Check FMP documentation for the exact names and availability)
We’ll select a few key ones for our example.
Python Implementation: Comparing Peer Metrics
Let’s write the code to fetch TTM ratios for our peer group and create comparison bar charts.
API Key & Libraries: Use your FMP API key (replace placeholder or use environment variables). Ensure pandas, requests, and matplotlib are installed (pip install pandas requests matplotlib).
import requests
import pandas as pd
import matplotlib.pyplot as plt
import numpy as np
import os

# --- Configuration ---
# API Key provided by user (Normally, use environment variables for security)
API_KEY = "your api key"
# Base URL for FMP API version 3
BASE_URL = "https://financialmodelingprep.com/api/v3"

# Define the peer group tickers
PEER_TICKERS = ['AAPL', 'MSFT', 'GOOGL', 'META', 'NVDA', 'TSM'] # Example: Large Cap Tech
# Define the TTM metrics to compare (ensure these match FMP API /ratios-ttm/ output names)
METRICS_TO_COMPARE = [
    'peRatioTTM',
    'priceToSalesRatioTTM',
    'netProfitMarginTTM',
    'debtEquityRatioTTM',
    'returnOnEquityTTM',
    'currentRatioTTM'
]

# --- Function to Fetch Data from FMP API (Adapted for single item list) ---
def get_financial_data(url):
    """
    Fetches data from the specified FMP API endpoint.
    Handles endpoints that return a list containing a single dictionary (like /ratios-ttm/).
    """
    print(f"Attempting to fetch data from: {url}")
    try:
        response = requests.get(url, timeout=15)
        response.raise_for_status()
        data = response.json()
        # Expecting a list with one dictionary inside for TTM ratios
        if isinstance(data, list) and len(data) > 0:
            if isinstance(data[0], dict):
                print(f"Successfully fetched TTM data.")
                return data[0] # Return the dictionary directly
            else:
                 print(f"Warning: Unexpected item type inside list from {url}. Type: {type(data[0])}")
                 return None
        elif isinstance(data, list) and len(data) == 0:
             print(f"Warning: Received empty list from {url}.")
             return None
        elif isinstance(data, dict) and 'Error Message' in data:
             print(f"Error from API at {url}: {data['Error Message']}")
             return None
        else:
            print(f"Warning: Received unexpected data format from {url}. Type: {type(data)}. Data: {str(data)[:200]}...")
            return None
    except requests.exceptions.RequestException as e:
        print(f"Error fetching data from {url}: {e}")
        return None
    except requests.exceptions.JSONDecodeError as e:
        print(f"Error decoding JSON response from {url}: {e}\nResponse text: {response.text}")
        return None
    except Exception as e:
        print(f"An unexpected error occurred while fetching {url}: {e}")
        return None

# --- Main Execution Logic ---
if __name__ == "__main__":
    print(f"\n--- Performing Peer Analysis for {', '.join(PEER_TICKERS)} ---")

    peer_data_list = []
    # Loop through each ticker to fetch its TTM ratios
    for ticker in PEER_TICKERS:
        print(f"\nFetching TTM ratios for {ticker}...")
        # Construct the URL for the TTM ratios endpoint
        ratios_url = f"{BASE_URL}/ratios-ttm/{ticker}?apikey={API_KEY}"
        ticker_data = get_financial_data(ratios_url)

        if ticker_data:
            # Add the ticker symbol to the dictionary for identification
            ticker_data['ticker'] = ticker
            peer_data_list.append(ticker_data)
        else:
            print(f"Could not fetch data for {ticker}. Skipping.")

    # Proceed only if we fetched data for at least one peer
    if peer_data_list:
        # Convert the list of dictionaries to a pandas DataFrame
        df_peers = pd.DataFrame(peer_data_list)
        print(f"\nRaw Peer Data DataFrame shape: {df_peers.shape}")

        # Set ticker as index
        if 'ticker' in df_peers.columns:
            df_peers.set_index('ticker', inplace=True)
        else:
            print("Error: 'ticker' column not found after fetching data. Cannot set index.")
            df_peers = pd.DataFrame() # Halt

        if not df_peers.empty:
            # --- Select and Clean Metrics for Comparison ---
            # Check if desired metrics exist as columns
            available_metrics = [m for m in METRICS_TO_COMPARE if m in df_peers.columns]
            missing_metrics = [m for m in METRICS_TO_COMPARE if m not in df_peers.columns]
            if missing_metrics:
                print(f"\nWarning: The following requested metrics were not found in the fetched data: {missing_metrics}")
            if not available_metrics:
                print("\nError: None of the requested metrics were found in the fetched data. Cannot proceed.")
                df_metrics = pd.DataFrame() # Halt
            else:
                print(f"\nComparing available metrics: {available_metrics}")
                df_metrics = df_peers[available_metrics].copy()

                # Convert selected metric columns to numeric
                for metric in available_metrics:
                    df_metrics[metric] = pd.to_numeric(df_metrics[metric], errors='coerce')

                print("\n--- Peer Comparison Data ---")
                print(df_metrics.round(2)) # Display the numeric data

            # --- Visualization ---
            if not df_metrics.empty:
                print("\n--- Generating Comparison Plots ---")

                num_metrics = len(available_metrics)
                # Adjust layout dynamically based on number of metrics? Maybe just plot each separately.
                for i, metric in enumerate(available_metrics):
                    # Skip plotting if all values for a metric are NaN after conversion
                    if df_metrics[metric].isnull().all():
                        print(f"Skipping plot for '{metric}' as all values are missing/invalid.")
                        continue

                    plt.figure(figsize=(10, 6)) # Create a new figure for each metric

                    # Sort data for better visualization in the bar chart
                    # Drop NaNs for sorting and plotting this specific metric
                    metric_data_sorted = df_metrics[metric].dropna().sort_values()

                    # Create bar chart
                    bars = plt.bar(metric_data_sorted.index, metric_data_sorted.values)
                    plt.title(f'Peer Comparison: {metric}')
                    plt.ylabel(metric)
                    plt.xlabel('Company Ticker')
                    plt.xticks(rotation=45, ha='right')
                    plt.grid(axis='y', linestyle='--', alpha=0.7) # Grid lines on y-axis only

                    # Add data labels on top of bars
                    plt.bar_label(bars, fmt='%.2f', padding=3)

                    plt.tight_layout()
                    plt.show()

            else:
                 print("\nNo valid metrics data available for plotting.")
        else:
             print("\nDataFrame became empty after setting index. Cannot proceed.")

    else:
        print("\nFailed to fetch data for any peers. Cannot perform analysis.")

    print("\n--- Script Finished ---")
Code Explanation: Step-by-Step
- Imports & Config: Imports
requests,pandas,matplotlib.pyplot,os. Sets API key (replace or use environment variable),BASE_URL, defines a list ofPEER_TICKERSfor comparison, and a list ofMETRICS_TO_COMPARE(these must match the keys returned by the FMP/ratios-ttm/endpoint). get_financial_data(url)Function: This version is adapted for endpoints like/ratios-ttm/which typically return a list containing a single dictionary with TTM ratios. It extracts and returns this dictionary if successful, while still handling errors and other potential response formats.- Fetch Peer Data Loop:
- Initializes an empty list
peer_data_list. - Iterates through each
tickerinPEER_TICKERS. - Constructs the specific URL for the
/ratios-ttm/{ticker}endpoint. - Calls
get_financial_data. If successful (returns a dictionary), it adds a ‘ticker’ key to the dictionary (to identify which company the data belongs to) and appends the dictionary topeer_data_list. It skips tickers if data fetching fails.
- Initializes an empty list
- Create DataFrame: Converts the
peer_data_listinto apandasDataFrame (df_peers) and sets the ‘ticker’ column as the index for easy row selection by company. - Select and Clean Metrics:
- Checks which of the
METRICS_TO_COMPAREactually exist as columns in the fetched data (some ratios might be missing for certain companies/industries). It warns about missing metrics. - Creates a new DataFrame
df_metricscontaining only the available, requested metrics. - Converts the data in
df_metricsto numeric types usingpd.to_numeric(errors='coerce'), turning any non-numeric values intoNaN. - Prints the cleaned data table.
- Checks which of the
- Visualization:
- Iterates through each
metricavailable indf_metrics. - Skips plotting if a metric column contains only
NaNvalues. - Creates a separate figure (
plt.figure) for each metric to avoid clutter. - Sorts the data for the current metric (
dropna().sort_values()) so the bars in the chart are ordered from smallest to largest, making visual comparison easier. - Creates a bar chart (
plt.bar) using the sorted data, with tickers on the x-axis and ratio values on the y-axis. - Adds data labels above each bar using
plt.bar_label()for precise value comparison. - Sets the title and labels, rotates x-axis labels, adds a horizontal grid, adjusts layout, and displays the plot (
plt.show()) before moving to the next metric.
- Iterates through each
- Error Handling: Includes checks for failed API fetches, missing ticker/metric columns, and empty DataFrames at various stages.
Interpreting the Peer Comparison Charts
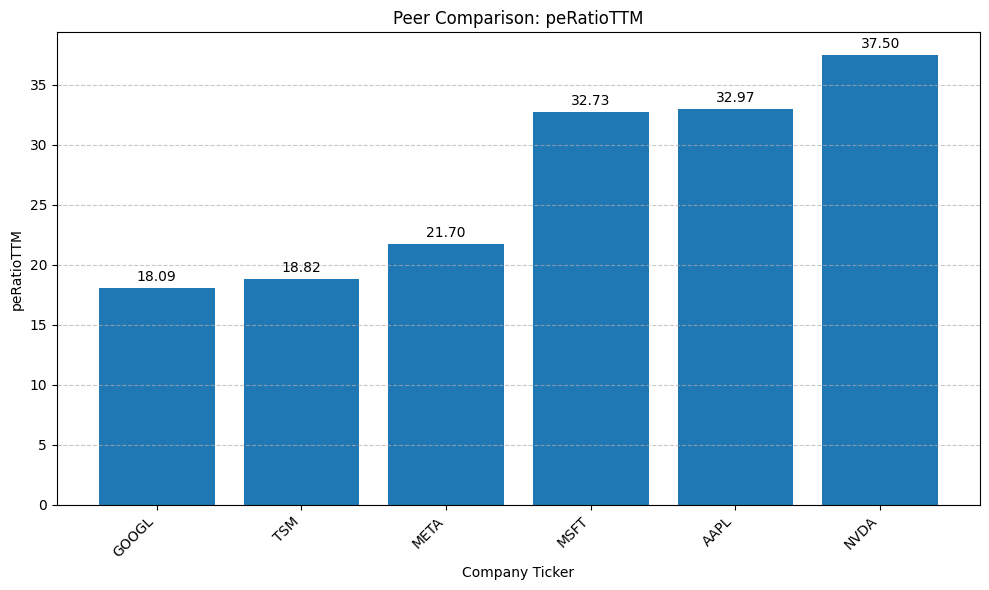
Let’s analyze the output generated by our script for the example peer group: AAPL, MSFT, GOOGL, META, NVDA.
Note that you should get six graphs like the one shown below. For simplicity, I have added only the picture of one of them. The interpretation below, is referring to the six metrics.
Interpretation Highlights:
- Valuation (P/E & P/S):
- NVDA stands out with the highest P/E (37.50) and a significantly higher Price-to-Sales (P/S) ratio (20.87), indicating the market places a very high premium on its revenue and earnings, likely due to high growth expectations (especially in AI). The bar chart makes NVDA’s P/S premium visually striking.
- AAPL and MSFT have similar high P/E ratios (~33), but MSFT has a higher P/S ratio (11.71 vs. 8.00), suggesting the market values Microsoft’s revenue more highly per dollar than Apple’s at this time.
- GOOGL and TSM show the lowest P/E ratios (~18-19), potentially signaling lower growth expectations or relative undervaluation compared to peers. GOOGL also has the lowest P/S ratio (5.48). I guess the problem with GOOGL is the current concern that LLMs (like Chat GPT) may take away market share from traditional search, which is the main revenue driver for GOOGL.
- META sits in the middle ground on P/E (21.70), with a P/S ratio (8.48) similar to AAPL and TSM.
- Profitability (Net Margin & ROE):
- NVDA leads significantly in profitability with an exceptional Net Profit Margin (56%) and a very high Return on Equity (ROE) of 115%.
- TSM (42%) and META (39%) also boast impressive Net Profit Margins.
- AAPL shows the lowest Net Profit Margin in this specific group (24%), yet paradoxically displays the highest ROE (151%). This extremely high ROE alongside a reported low D/E (see next point) is unusual. Apple generates large profits through its innovative products, strong brand, and efficient operations. It then uses a significant portion of these profits (and sometimes borrowed funds) to buy back its own stock. This reduces shareholder equity, leading to a mathematically much higher ROE compared to companies that don’t engage in such extensive buyback programs. While indicating profitability, Apple’s very high ROE is heavily influenced by this financial strategy.
- MSFT, GOOGL, META, and TSM show strong and more conventional ROE figures between 31% and 39%.
- Leverage (D/E):
- Data Caveat: The Debt-to-Equity ratios shown in the table (using
debtEquityRatioTTMlikely based ontotalDebt) appear very low for most companies, especially AAPL (0.09). This contrasts sharply with visualizations from previous posts (like AAPL’s D/E chart showing values >1.4). This highlights a potential inconsistency or a very specific definition being used by this API endpoint (totalDebtvstotalLiabilities). It’s crucial to verify the definition or check against other sources before drawing strong conclusions about leverage from this specific metric alone. Remember that in our prior post, we used interest bearing liabilities. Probably, the end key metric used on this post, includes all debt. - Based only on the table data, GOOGL (0.07) and AAPL (0.09) appear to use the least debt relative to equity, while META (0.27) uses the most within this low range.
- Data Caveat: The Debt-to-Equity ratios shown in the table (using
- Liquidity (Current Ratio):
- NVDA shows extremely high liquidity (Current Ratio 4.44). META (2.66) and TSM (2.39) also have very healthy liquidity ratios.
- GOOGL (1.77) and MSFT (1.37) are comfortably liquid (>1.0).
- AAPL (0.82) is the only company in this group with a Current Ratio below 1.0, consistent with our previous analysis, suggesting tighter short-term liquidity management relative to peers based on this metric.
Overall Takeaway: This peer comparison immediately highlights NVDA’s premium valuation and exceptional profitability. It shows GOOGL and TSM trading at lower valuation multiples. It reveals AAPL’s standout ROE but lower net margin and current ratio compared to this group. The apparent discrepancy in D/E ratios underscores the vital importance of understanding the precise definitions behind API data points and potentially cross-referencing with other sources or calculating manually from full statements for consistency. The bar chart for P/S provides an instant visual gauge of relative revenue valuation.
Conclusion: Benchmarking Made Efficient
Peer company analysis is an indispensable part of thorough fundamental analysis, providing the context needed to properly evaluate a company’s performance and valuation. Automating the data collection and visualization process with Python allows us to perform these comparisons quickly and efficiently across various key metrics. By leveraging APIs like Financial Modeling Prep and libraries like `pandas` and `matplotlib`, we can easily benchmark companies against their competitors and gain deeper insights.
Where do we go from here? We could enhance this analysis by Incorporating more qualitative factors alongside the quantitative data. Lets analyze earning call transcripts using Python.
Disclaimer: This blog post is for educational purposes only. Financial data APIs provide data “as is”; always verify critical data from official sources (e.g., SEC filings) before making investment decisions. Ensure compliance with API provider terms of service. this post was drafted with help of AI and reviewed and changed by the author.