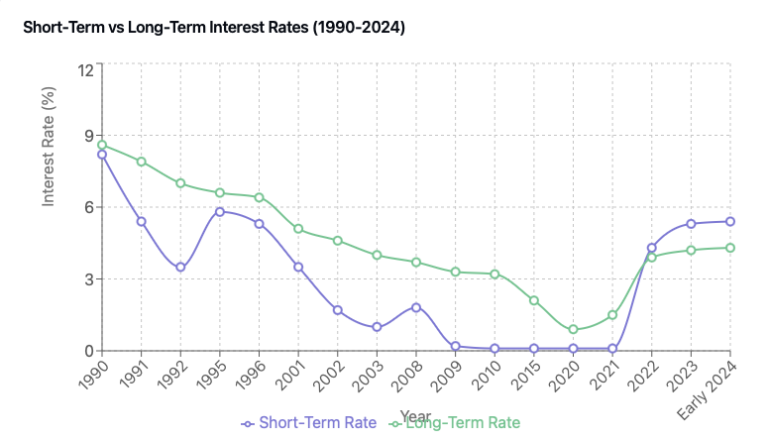
Market Outlook – Mid-November 2024
Welcome to the market outlook. The idea of this section is to give an overview of current market performance and trends. We will include bond yields, commodity trends, key economic calendar activities, and more. New Market Outlooks will be published biweekly.
US Bond Market Yields
As of the week ending November 15th, long-term U.S. Treasury yields (10+ years) increased by approximately 13 basis points, with the 30-year yield reaching 4.60%.

Source: https://home.treasury.gov/resource-center/data-chart-center/interest-rates/TextView?type=daily_treasury_yield_curve&field_tdr_date_value=2024

In general, long term rates keep increasing driven by renewed fears of inflation. Fears of inflation are back on the table due to the potential introduction of new tariffs under the Trump administration. Tariffs generally lead to an increase in the cost of importing goods. In addition, local producers would benefit from reducing competition which may lead them to set higher prices, and therefore, introducing new inflationary pressures.
From my point of view, having higher long rates for a long period of time may bring economic challenges into the US Economy:
- Home sales are financed with long term loans. The 10 year fix mortgage rate is above 6% in the US which may lead to potential home buyers to think twice before pulling the trigger. The housing market is a vital sector of the US economy. Higher rates do not help to make homes more affordable.
- Another key industry in the US is auto manufacturers. Auto manufacturers rely on consumer credit. Higher interest rates will likely reduce demand as higher interest rates increase the cost of financing.
- On top, the US should pay interest on its debt. The higher the interest rates, the more difficult it is for the US to have a balance budget. In 2023 alone, the US paid interest costs of $659 billion. That represents around 2.5% of the GDP that is used just to pay interest expenses.
For the 3 reasons listed above, it is unlikely that the US economy will keep elevated long end rates for an extended period of time.
Future Rate Cuts – Federal Funds Futures
Federal Funds Futures are currently implying 69 basis points of rate cuts over the next 12 months, suggesting a market expectation of nearly three 25 basis point cuts. Based on recent market data, I believe the market may be underestimating the number of cut rates on the next few months.

Economic Calendar Highligts
US economy calendar:
This past week, we had some key events in the US and Europe. On Wednesday, we saw inflation rate YoY and MoM coming in line with the expectations. Year-over-year core inflation remains around 3.3%, while non-core inflation is at the 2.6% mark. This suggests that the Federal Reserve’s fight with inflation is not yet over and the FED has some work ahead in order to bring back inflation to the 2% target.

Source: https://tradingeconomics.com/calendar
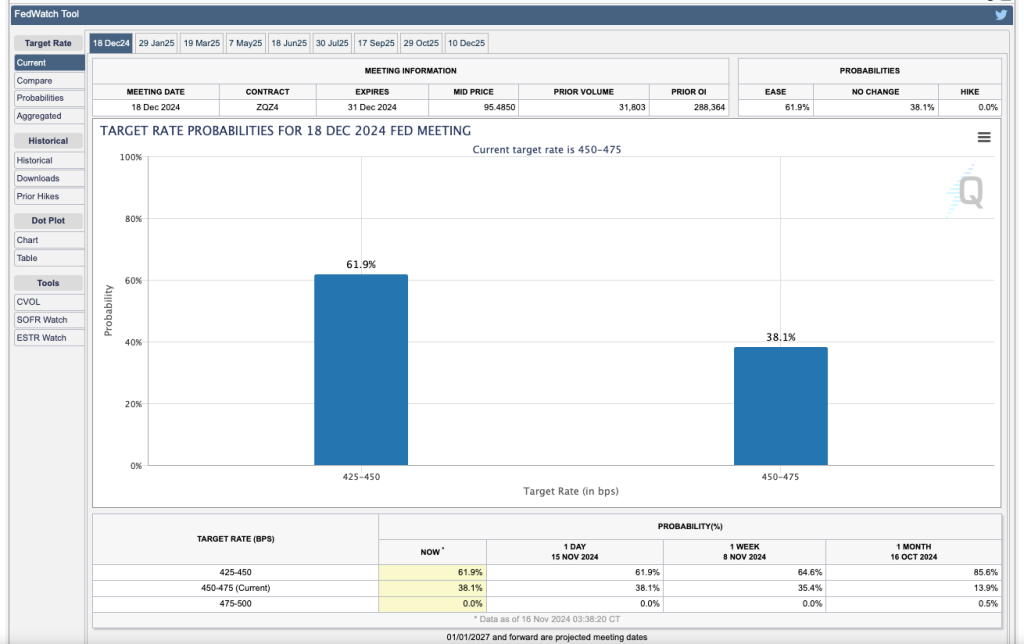
If the FED sees potential that inflation may come back, chances are that short term rates will stay higher than initially expected. In the FED Watch tool, we see a 62% probability for the FED to lower the target rate from the current range (450 -475 to 450 425).
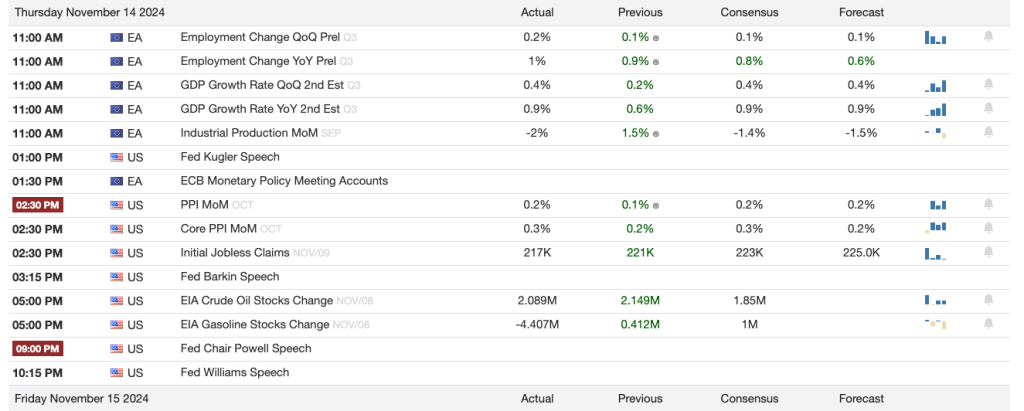
Meanwhile, the U.S. Producer Price Index (PPI) for October, shows a small increase of 0.2% in line with expectations. Price of services went up 0.3% in October while prices of goods went up 0.1%. Year over year PP increased 2.4%.
Jerome Powell, FED Chair, provide a few interesting statements on Thursday at the Dallas Regional Chamber. The main takeaways from the his talk are summarized below:
The U.S. economy remains robust with solid employment conditions, the Federal Reserve will maintain a patient and careful approach to monetary policy adjustments. He noted that inflation has significantly decreased from its peak but hasn’t yet reached the 2% target, with core PCE prices up 2.8% and total PCE prices rising 2.3% through October. He mentioned that the economy shows no urgency for rapid rate reductions, so the FED will follow a patient approach assessing future data points. Source: https://ieu-monitoring.com/editorial/speech-by-u-s-federal-reserve-chair-jerome-powell-on-the-economic-outlook/468013
On Friday, retail Sales MoM for October showed an increase of 0.4% which was slightly above the consensus indicating strong consumer spending despite the high interest rates.
One more week, we can see that the US Economy remains strong and consumers are willing to keep spending.
Europe economy calendar:
In Europe, GDP growth rate YoY has been 0.9% on the 2nd estimate release (which contains more complete source data than the first release), in line with the consensus. Europe growth is lagging behind the US GDP growth since quite long time.
The industrial production in Europe showed a -2% MoM decrease for September compared to August. The decrease was quite below the -1.4% consensus. The industrial production indicates the output of the industrial sector (i.e. Manufacturing, mining, etc) within the European economy.
European economy keeps sowing signs of stress and deterioration.
China economy calendar:
The wave of stimulus provided by the Chinese government seems to be having a positive effect in the Chinese economy. Retail sales for October show an increase YoY of 4.8%. 100 basis points above the consensus.

On the other side, Industrial Production YoY was slightly below the 5.4% consensus. House prices decreased 5.9% in October keeping a more than 12 months record of month declines on house pricing. China introduced stimulus through lowered mortgage rates and reduced down payment requirements fo second home. However, the property market in China has still a significant supply available putting downward pressure on prices.

Source: https://tradingeconomics.com/china/housing-index
Economy calendar for next week
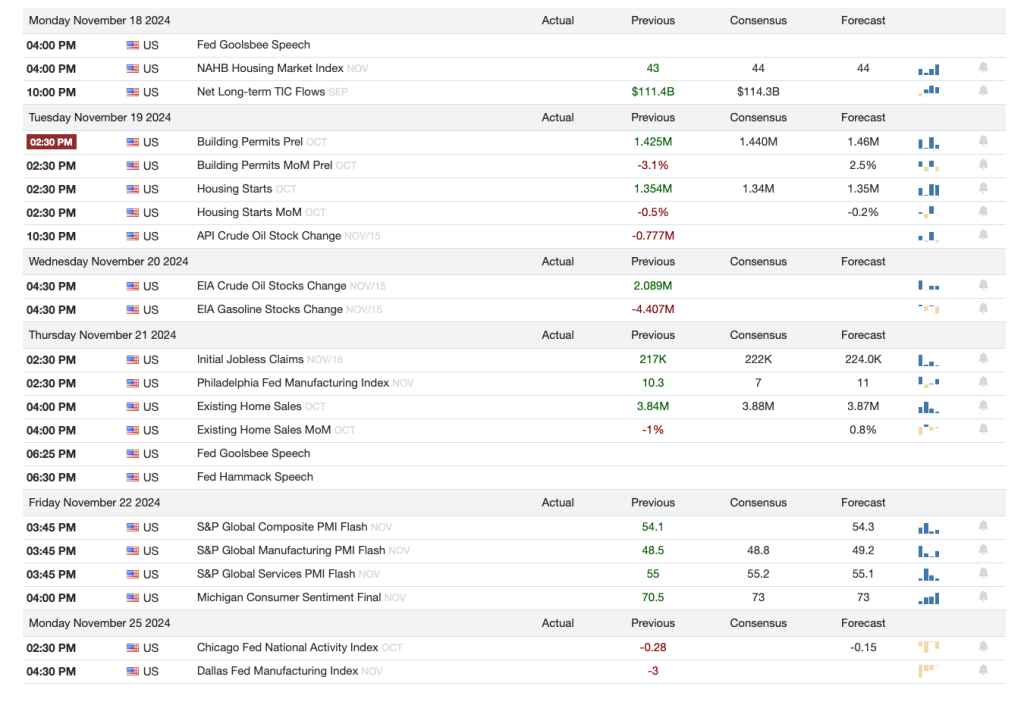
For next week, we can expect a interesting release on Tuesday with the release of the preliminary building permits. Building permits signal future construction activity which are a key sector for the economy. And we get initial jobless claims on Thursday.
Commodities
Regarding commodities, I will place special emphasis to Copper and Gold. Copper is a key element to enable the AI expansion, renewable energy build out and the expansion of Internet of Things. And gold is the biggest physical asset in the markets.
Copper (HG1)
Since the presidential election, Copper prices have gone down from 4.41 in November 7th to 4.05 in November 15th. That is a decrease of around 8% week over week. This decline appears to be driven by two factors:
- Potential tariffs impose by the Trump administration will very likely impact China and other economies leading to a slow down in demand of Copper. US Tariffs will impact China’s GDP growth. This is a key point to understand Copper prices since China consumes more than half of the world copper.
- The USD has appreciated significantly. Copper and other commodities are priced based on the USD. Therefore, for other countries like China, Europe, etc. Copper has become relatively more expensive impacting the demand levels.
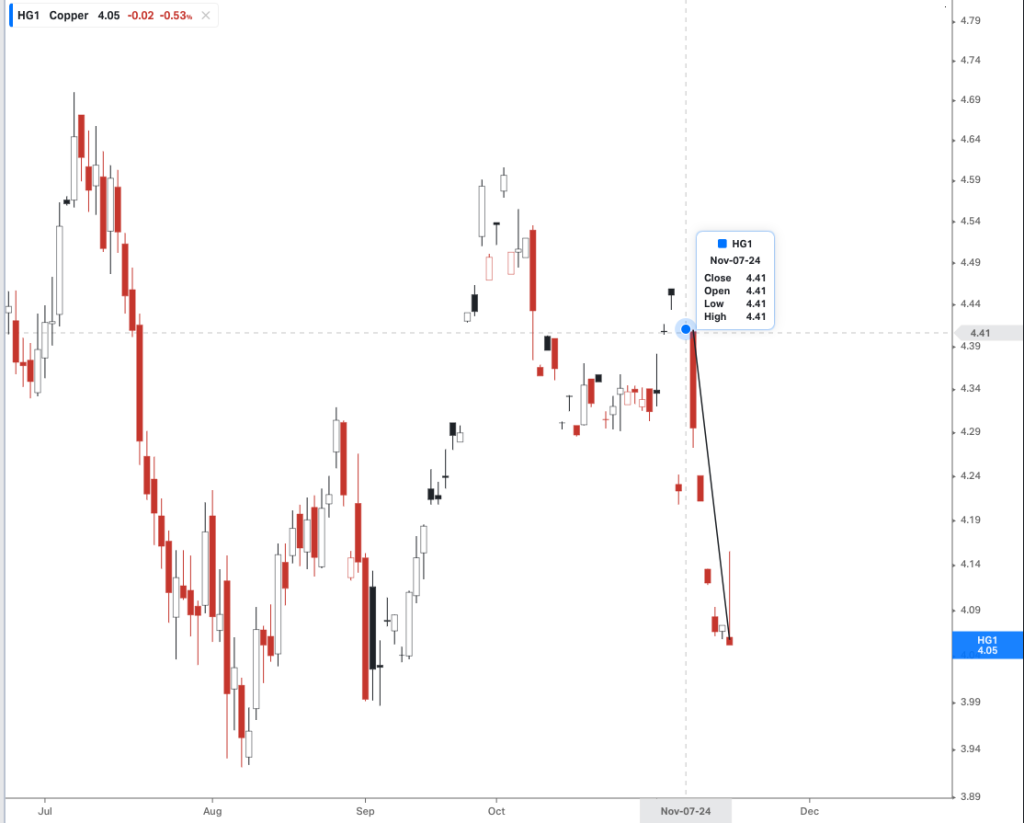
Copper inventory levels as shown by Shanghai and London have increased in recent months. Note that the London Metal Exchange (LME) and Shanghai Futures Exchange (SHFE) warehouses are the main global copper inventory monitoring locations.
- Copper inventory levels on London shows an increase level of Copper Inventories over the last months as shown by the blue blocks in the chart below.. If the trend continues, Copper prices may feel additional downward pressure.
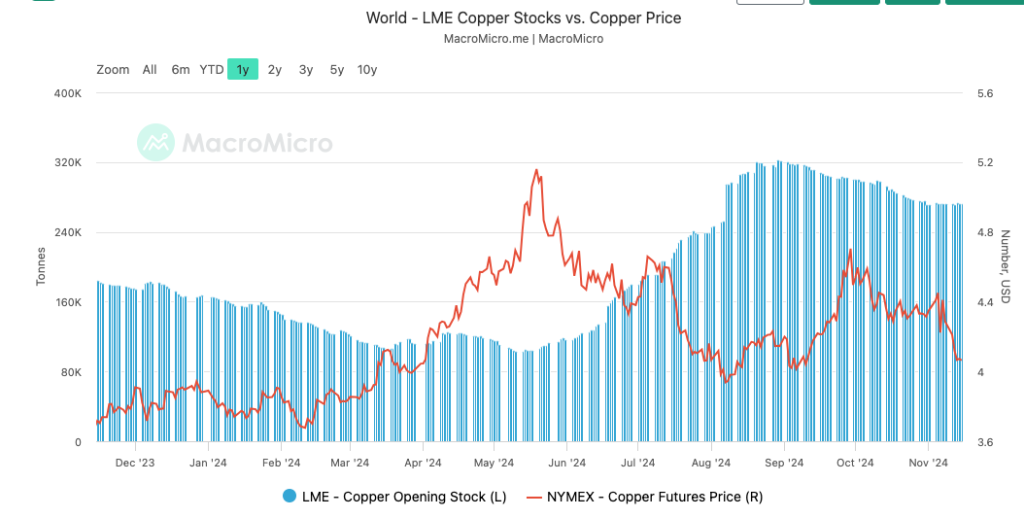
Source: https://en.macromicro.me/charts/943/lme-copper-warehouse-stock-vs-copper-price
- However, in Shanghai, inventory levels of Copper seem to be increasing in the last months putting downward pressure to Copper prices.

Source: https://www.ceicdata.com/en/china/shanghai-futures-exchange-commodity-futures-stock/cn-warehouse-stock-shanghai-future-exchange-copper#:~:text=China%20Warehouse%20Stock%3A%20Shanghai%20Future%20Exchange%3A%20Copper%20data%20is%20updated,Ton%20in%2007%20Nov%202023.
Long term I feel bullish about Copper due to the decreasing Copper availability in the long term as explain in my previous post.
Gold
Similar to Copper, Gold prices keeps going down from the October all-time highs. As per today, an oz of gold is priced at $2,562. Despite the recent sell off, gold is still up around 24% YTD. The current downward trajectory seems to be driven by the strengthen of the U.S. Dollar (same reason as stated for Copper) and a reduced probability of faster rate cuts from by the FED. Higher rates mean that the opportunity cost of investing in Gold (a not yielding asset) is much higher than when rates are lower.

Source: https://goldprice.org/
Long term, I still feel bullish about the gold price of gold due to average gold minings decreasing in life with a ore grade deterioration. Also, it is very rare to find new gold mines that are economically viable to mine. Even if found, it takes a long time (more than 10 years) from mine discovery to production. Therefore, the difficulty to bring new supplies online, may lead to higher gold prices if we assume a constant Demand.
Major Market Indexes
SPY
The S&P 500 ETF (SPY) has continued to rally post-election, reaching an all-time high of 600 points, with a YTD cumulative price return of 24.4%. On the last trading couple of sessions in the week, the index lost a bit of momentum.
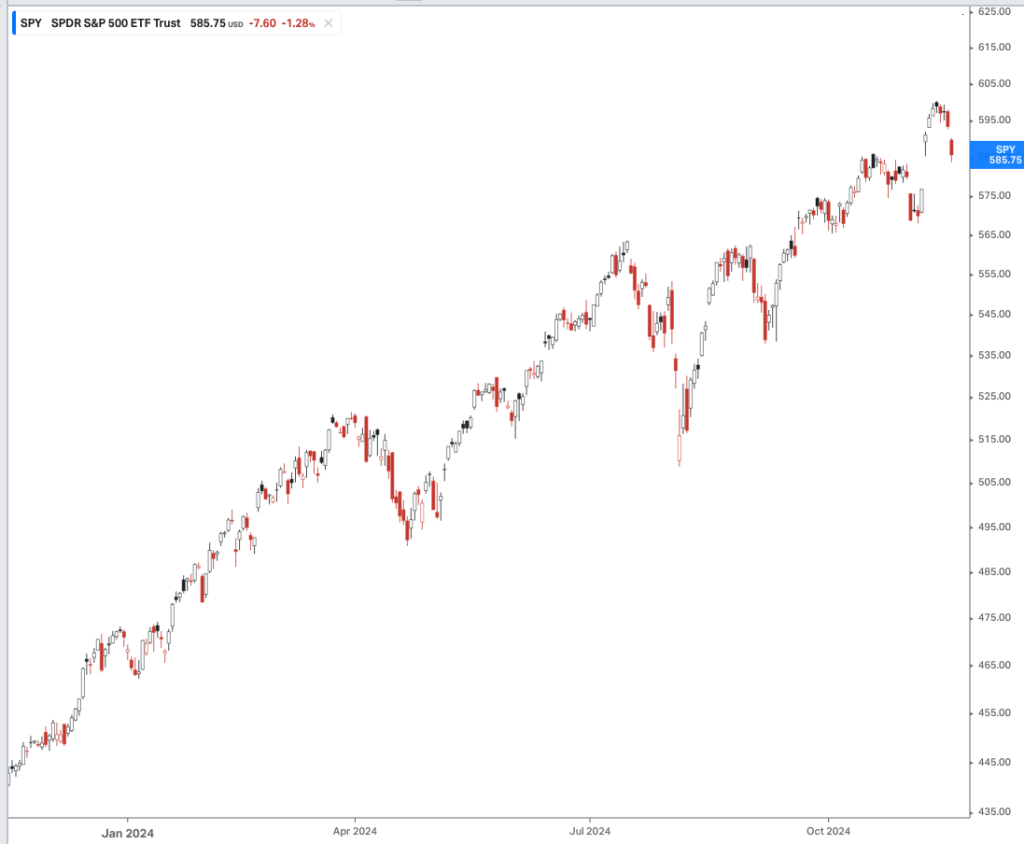
The SPY is trading at 22.6X forward P/E ratio well above the historical average of 19.4x. If earnings disappoint in upcoming quarters, we may see quite a bit of a correction.
Next week NVDIA, the largest market cap with a 7% weight in the SPY, is reporting earnings. If earnings are bad, analysts and news may start putting on doubt the potential growth of the AI play. This scenario may lead to a market correction. So consider next week as a risky week for the SPY.
Small caps
The Russell 2000 Index ETF (IWM) tracks small-cap US stocks. This is particularly interesting since a big part of the companies in the index are not profitable. Therefore, companies in this index are very sensitive to interest rate changes since they tend to rely more on debt financing and higher borrowing costs. The index is up almost 14% year to date. It had a very nice post election rally.
However, IWM has dropped quite a bit last week after last week economic data and the FED indicating that there is no urgency for urgency cut rates.
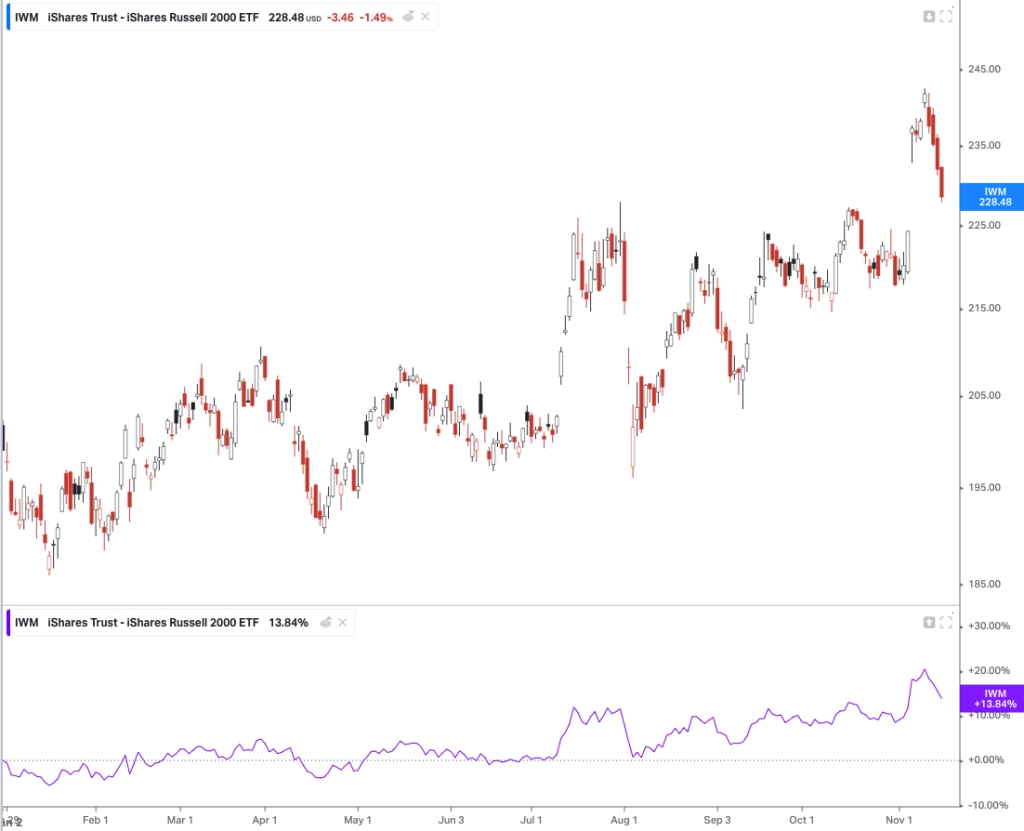
Source: https://app.koyfin.com/charts/g/et-9vkyni
TLT (Duration)
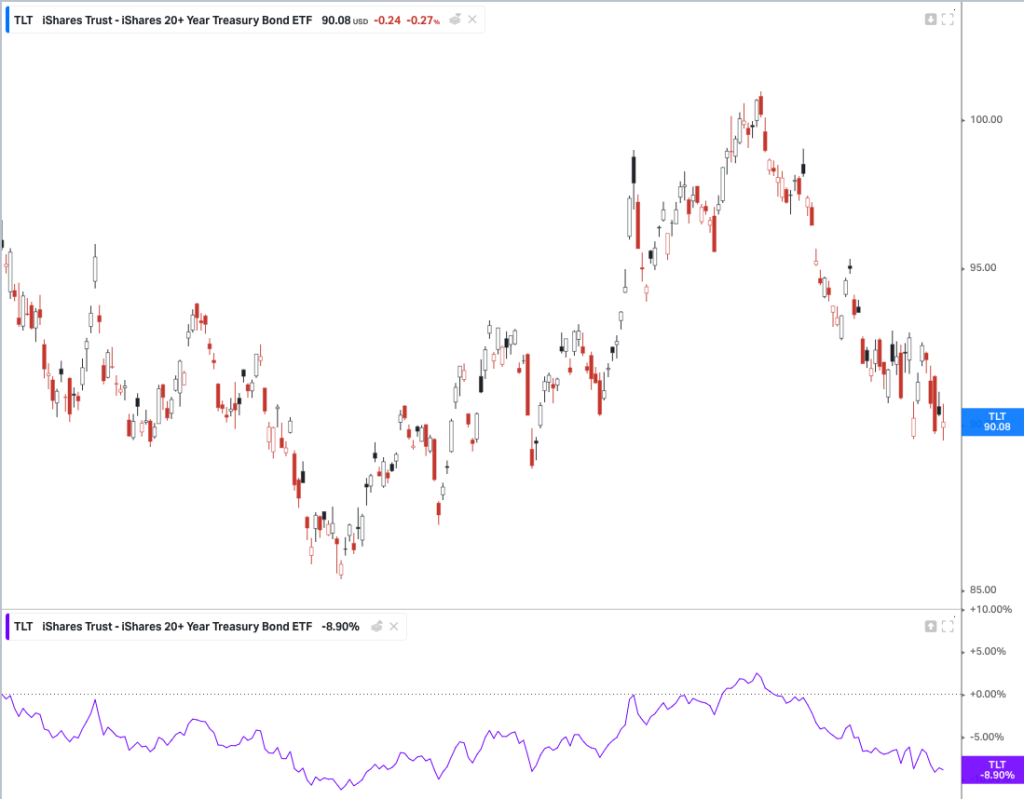
TLT (The iShares 20+ Year Treasury Bond ETF (TLT)) tracks long-term U.S. Treasury bonds. The index is a pure play of duration. TLT has an average duration of approximately 16 years. Therefore, when interest rates in the long end of the curve drop, TLT prices go higher.
In the last few weeks, we have seen how TLT price has dropped in value significantly from the 102 highs. The narrative for the price drop is that investors are seeing growing deficits in the US economy. Higher deficits may lead to an oversupply of future treasury bonds in the future since the treasury will have to issue new bonds to finance the deficit.
Based on historical observations, the long end of the curve end up having lower rates within a few months after the FED starts cutting rates on the short end of the curve. I see lower yields in the near future since keeping the yields higher are not really helping reducing the deficit (through higher interest expense) and it also does not help the auto or the building industry. On top, inflation is getting closer to the 2% target.
Sector performance:
And to finalize this week market outlook, below is an overview of the sector performance. In the last month, we can see the financial sector really going strong with an increase of almost 7%. Utilities also had a nice run in the last 3 months with a 7% increase. These are two sectors that benefit from a decrease of interest rates.

Source: https://digital.fidelity.com/prgw/digital/research/sector
Please feel free to share your comments and your views in the current market trends!
Disclaimer:
The views and analyses presented in this market outlook reflect my personal opinions and interpretations of market conditions. All information provided, including but not limited to market commentary, interest rate predictions, and trading strategies, should not be considered as financial advice or recommendations to buy or sell any securities. Market conditions are subject to change, and past performance does not guarantee future results. The Federal Funds Futures data and other market statistics referenced are for informational purposes only. Readers should conduct their own research and consult with qualified financial professionals before making any investment decisions. Trading in financial markets carries substantial risk, and you should carefully consider your financial situation and risk tolerance before acting on any information presented.


