4. Python for Fundamental Analysis: Analyze Liquidity Ratios with Python
Welcome back to the Python for Finance series! In our previous posts, we’ve fetched specific metrics like P/E (
Liquidity refers to a company’s ability to meet its short-term financial obligations (those due within roughly a year). It’s about financial flexibility – does the company have enough cash or assets easily convertible to cash to cover its immediate debts? Poor liquidity can cause distress even for profitable companies, while excessively high liquidity might mean inefficient asset use.This post uses Python to analyze two common liquidity ratios from the Balance Sheet: the Current Ratio and the Quick Ratio (Acid-Test Ratio). We’ll fetch quarterly Balance Sheet data via the FMP API, calculate these ratios using pandas, and visualize their trends over the last 10 quarters with matplotlib to gauge the company’s short-term financial health.
Understanding Liquidity Ratios
Liquidity ratios primarily use Balance Sheet figures to assess short-term solvency.
1. The Current Ratio
What it is: Compares total current assets to total current liabilities. (Current = typically within one year).
Why it’s important: Measures ability to cover short-term debts with short-term assets. Ratio > 1 suggests coverage, < 1 suggests potential difficulty. Very high ratios might indicate inefficiency.
Components: Total Current Assets (Cash, Receivables, Inventory, etc.), Total Current Liabilities (Payables, Short-Term Debt, etc.).
2. The Quick Ratio (Acid-Test Ratio)
What it is: A stricter liquidity measure excluding Inventory from current assets, as inventory might not be quickly convertible to cash.
Why it’s important: Tests ability to meet immediate obligations without selling inventory. Ratio >= 1 is generally considered strong. A ratio < 1 indicates potential reliance on inventory sales.
Components: Same as Current Ratio, but subtracts Inventory from the numerator. Less relevant for businesses with very fast inventory turnover.
Python Implementation: Calculating and Visualizing Liquidity
Let’s use Python, pandas, and matplotlib to fetch Balance Sheet data, calculate these ratios, and plot them.API Key & Libraries: You’ll need your FMP API key (replace the placeholder below or use environment variables as shown in the comments) and the required libraries (pip install pandas requests matplotlib).
import requests
import pandas as pd
import matplotlib.pyplot as plt
import os

# --- Configuration ---
# API Key provided by user (Normally, use environment variables for security)
API_KEY = "your api key"
# Ticker symbol of the company to analyze
TICKER = "AAPL"
# Number of past quarters to retrieve
LIMIT = 10
# Base URL for FMP API version 3
BASE_URL = "https://financialmodelingprep.com/api/v3"

# --- Function to Fetch Data from FMP API ---
# Reusing the function from previous posts
def get_financial_data(url):
    """
    Fetches data from the specified Financial Modeling Prep API endpoint.
    Designed to handle endpoints that return a list of records.

    Args:
        url (str): The API endpoint URL.

    Returns:
        list or None: A list of dictionaries containing the fetched data if successful,
                      otherwise None.
    """
    print(f"Attempting to fetch data from: {url}")
    try:
        response = requests.get(url, timeout=15)
        response.raise_for_status() # Check for HTTP errors
        data = response.json()
        if isinstance(data, list):
            if len(data) > 0:
                print(f"Successfully fetched {len(data)} periods of data.")
                return data
            else:
                print(f"Warning: Received empty list from {url}.")
                return None
        elif isinstance(data, dict) and 'Error Message' in data:
             print(f"Error from API at {url}: {data['Error Message']}")
             return None
        else:
            print(f"Warning: Received unexpected data format from {url}. Type: {type(data)}")
            return None
    except requests.exceptions.RequestException as e:
        print(f"Error fetching data from {url}: {e}")
        return None
    except requests.exceptions.JSONDecodeError as e:
        print(f"Error decoding JSON response from {url}: {e}\nResponse text: {response.text}")
        return None
    except Exception as e:
        print(f"An unexpected error occurred while fetching {url}: {e}")
        return None

# --- Main Execution Logic ---
if __name__ == "__main__":
    print(f"\n--- Calculating Liquidity Ratios for {TICKER} ({LIMIT} Quarters) ---")

    # Construct the URL for the quarterly balance sheet statement
    balance_sheet_url = f"{BASE_URL}/balance-sheet-statement/{TICKER}?period=quarter&limit={LIMIT}&apikey={API_KEY}"

    # Fetch the balance sheet data
    balance_data = get_financial_data(balance_sheet_url)

    if balance_data:
        # Convert the list of dictionaries to a pandas DataFrame
        df = pd.DataFrame(balance_data)
        print(f"\nBalance Sheet DataFrame created with shape: {df.shape}")

        # --- Data Cleaning and Preparation ---
        # Define required columns for liquidity ratios
        required_cols = ['date', 'totalCurrentAssets', 'totalCurrentLiabilities', 'inventory']
        print(f"Checking for required columns: {required_cols}")

        # Check if all required columns exist
        if not all(col in df.columns for col in required_cols):
            print("Error: DataFrame is missing one or more required columns for liquidity calculations.")
            missing = [col for col in required_cols if col not in df.columns]
            print(f"Missing columns: {missing}")
        else:
            print("All required columns found.")

            # Select only necessary columns + identifier columns like 'symbol', 'reportedCurrency' etc.
            id_cols = ['symbol', 'calendarYear', 'period', 'reportedCurrency', 'cik', 'fillingDate', 'acceptedDate', 'link', 'finalLink']
            cols_to_keep = required_cols + [col for col in id_cols if col in df.columns]
            df = df[cols_to_keep]


            # Convert financial columns to numeric, coercing errors to NaN
            numeric_cols = ['totalCurrentAssets', 'totalCurrentLiabilities', 'inventory']
            print(f"Converting columns to numeric: {numeric_cols}")
            for col in numeric_cols:
                df[col] = pd.to_numeric(df[col], errors='coerce')

            # Drop rows with NaN values in essential numeric columns
            initial_rows = len(df)
            df.dropna(subset=numeric_cols, inplace=True)
            rows_after_dropna = len(df)
            if initial_rows > rows_after_dropna:
                 print(f"Dropped {initial_rows - rows_after_dropna} rows due to missing numeric data in required columns.")

        # Proceed only if DataFrame is not empty after checks and cleaning
        if not df.empty:
            # Convert 'date' column to datetime objects
            df['date'] = pd.to_datetime(df['date'])
            # Sort DataFrame by date in ascending order (oldest to newest)
            df.sort_values(by='date', ascending=True, inplace=True)

            # --- Calculate Liquidity Ratios ---
            print("Calculating Current and Quick Ratios...")
            # Handle potential division by zero for liabilities
            df['Current Ratio'] = df.apply(
                lambda row: row['totalCurrentAssets'] / row['totalCurrentLiabilities'] if row['totalCurrentLiabilities'] != 0 else pd.NA,
                axis=1
            )
            df['Quick Ratio'] = df.apply(
                lambda row: (row['totalCurrentAssets'] - row['inventory']) / row['totalCurrentLiabilities'] if row['totalCurrentLiabilities'] != 0 else pd.NA,
                axis=1
            )

             # Drop rows where ratios could not be calculated (e.g., due to division by zero resulting in NA)
            df.dropna(subset=['Current Ratio', 'Quick Ratio'], inplace=True)


            if not df.empty:
                print("\n--- Calculated Liquidity Ratios (Last 10 Quarters) ---")
                # Display relevant columns: date and the calculated ratios
                print(df[['date', 'Current Ratio', 'Quick Ratio']].round(2)) # Round for display

                # --- Visualization ---
                print("\n--- Generating Plot ---")
                plt.figure(figsize=(12, 7))

                # Plot Current Ratio
                plt.plot(df['date'], df['Current Ratio'], label='Current Ratio', marker='o', linestyle='-')
                # Plot Quick Ratio
                plt.plot(df['date'], df['Quick Ratio'], label='Quick Ratio (Acid Test)', marker='s', linestyle='--')

                # Add a horizontal line at y=1.0 for reference
                plt.axhline(y=1.0, color='r', linestyle=':', linewidth=1, label='Reference (Ratio = 1.0)')

                # Add titles and labels
                plt.title(f'{TICKER} Quarterly Liquidity Ratios (Last {len(df)} Quarters)')
                plt.xlabel('Date (Quarter End)')
                plt.ylabel('Ratio Value')

                # Add legend, grid, and rotate x-axis labels
                plt.legend()
                plt.grid(True, linestyle='--', alpha=0.6)
                plt.xticks(rotation=45, ha='right')

                # Improve layout and display the plot
                plt.tight_layout()
                plt.show()
            else:
                print("\nDataFrame became empty after calculating ratios (possibly due to zero liabilities). Cannot plot.")

        else:
             print("\nDataFrame is empty after cleaning or missing required columns. Cannot calculate ratios.")

    else:
        print("\nFailed to fetch Balance Sheet data. Cannot calculate ratios.")

    print("\n--- Script Finished ---")
Code Explanation: Step-by-Step
- Imports & Config: Imports
requests,pandas,matplotlib.pyplot,os. SetsAPI_KEY(using your api key),TICKER,LIMIT,BASE_URL. get_financial_data(url)Function: Reuses the error-handling function from previous posts to fetch the list of quarterly data dictionaries.- Fetch Balance Sheet Data: Constructs the URL for the quarterly
/balance-sheet-statement/endpoint and callsget_financial_data. - Data Processing & Ratio Calculation:
- Check & DataFrame: Verifies data was fetched, converts to a
pandasDataFrame (df). - Column Check: Explicitly checks if
date,totalCurrentAssets,totalCurrentLiabilities, andinventorycolumns exist. Prints an error and stops if any are missing. - Column Subsetting: Selects only the required financial columns plus common identifier columns (
symbol,period, etc.) if they exist, creating a more focused DataFrame. - Convert to Numeric: Converts
totalCurrentAssets,totalCurrentLiabilities,inventoryto numeric types usingpd.to_numeric(errors='coerce'). - Handle Missing Data: Drops rows where any of these essential columns are
NaNusingdf.dropna(). - Date Conversion & Sorting: Converts
datecolumn to datetime objects and sorts the DataFrame chronologically. - Calculate Ratios: Computes ‘Current Ratio’ and ‘Quick Ratio’. Uses
df.apply()with a lambda function to handle potential division by zero (if row['totalCurrentLiabilities'] != 0 else pd.NA). If division by zero occurs, pandas’NA(Not Available) is used instead of 0. - Handle NA Ratios: Drops any rows where either ratio calculation resulted in
pd.NAusingdropna(subset=...). - Display Ratios: If the DataFrame still contains data, prints the
date,Current Ratio, andQuick Ratiocolumns, rounded.
- Check & DataFrame: Verifies data was fetched, converts to a
- Visualization:
- Check for Data: Ensures the DataFrame is not empty before plotting.
- Create Plot: Uses
matplotlib.pyplot(plt):- Plots Current Ratio (solid line, circle marker) and Quick Ratio (dashed line, square marker) against
date. - Adds a red dotted horizontal line (
plt.axhline) aty=1.0as a key reference point, including it in the legend. - Sets title, labels, legend, grid, and rotates x-axis labels.
- Optionally sets the y-axis minimum to 0.
- Uses
plt.tight_layout()andplt.show()to display.
- Plots Current Ratio (solid line, circle marker) and Quick Ratio (dashed line, square marker) against
- Error Handling: Includes checks for API failures, missing required columns, and the DataFrame becoming empty after cleaning or ratio calculation.
Interpreting the Liquidity Ratio Results
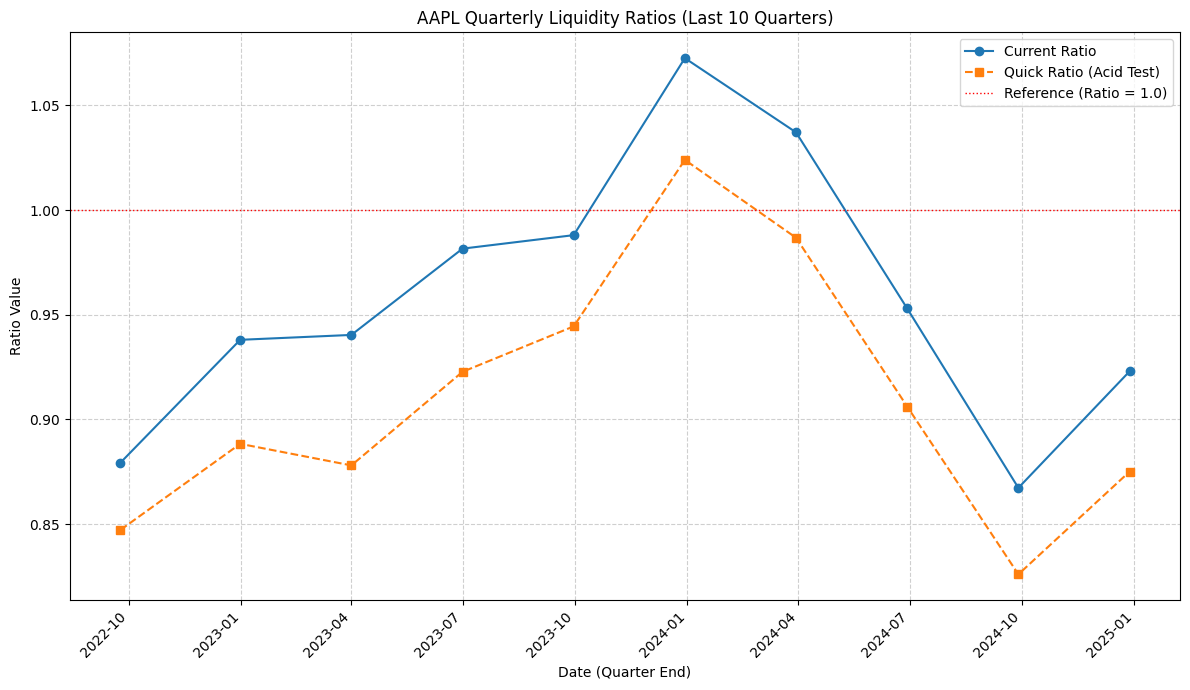
Let’s examine the chart generated by our script for Apple (AAPL) over the 10 quarters ending in early 2025:
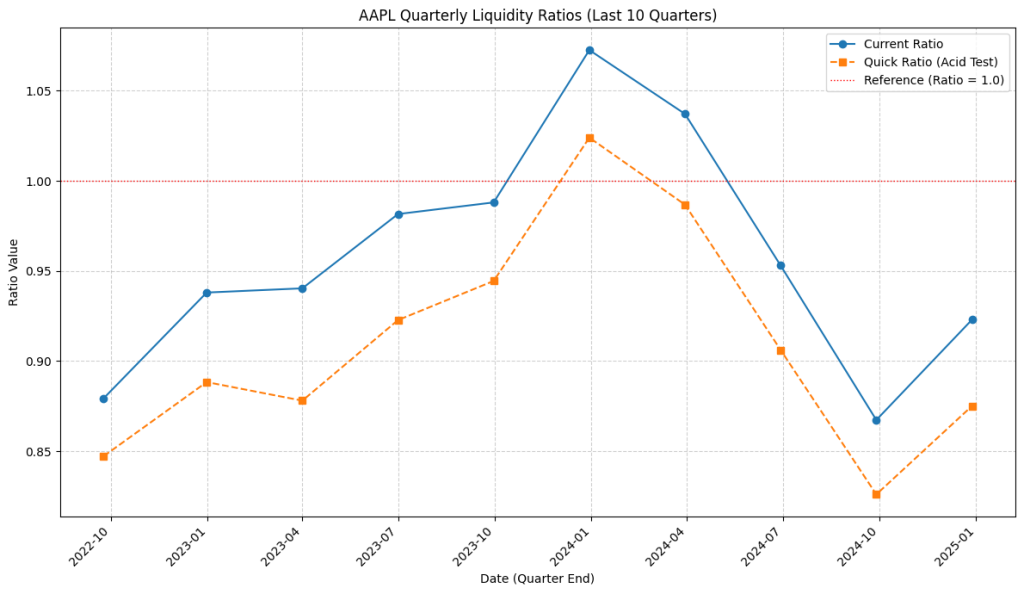
- Overall Trend: The chart displays both the Current Ratio (blue solid line) and the Quick Ratio (orange dashed line). We can see both ratios generally move together, starting below 0.9, rising to a peak in early 2024, and then declining significantly through late 2024 before a slight uptick in early 2025.
- Benchmark Comparison (Ratio = 1.0): The red dotted reference line at 1.0 is crucial. Notice that for most of the 10 quarters shown, both the Current Ratio and the Quick Ratio are below this benchmark. They only briefly exceeded 1.0 around the peak in early 2024. Traditionally, ratios consistently below 1 can signal potential difficulty in meeting short-term obligations.
- Quick Ratio vs. Current Ratio: The Quick Ratio consistently tracks below the Current Ratio. The gap between them represents the impact of inventory on Apple’s current assets. The gap appears relatively stable throughout the period, suggesting inventory didn’t drastically alter the trend of liquidity, though it clearly constitutes a portion of current assets.
- Volatility and Recent Trend: Liquidity appears to have tightened considerably from early 2024 to late 2024, with both ratios falling significantly. The slight recovery in early 2025 might indicate stabilization, but the ratios remain below the levels seen a year prior and below the 1.0 mark.
- Context is Crucial: Does this mean Apple is facing liquidity problems? Not necessarily, based solely on this chart. Large, highly profitable companies like Apple often have sophisticated cash management, strong access to credit markets, and high cash flow generation (as seen in the Cash Flow Statement). They might operate efficiently with lean working capital, resulting in traditional liquidity ratios appearing low. Therefore, while the trend shows tightening liquidity over the past year (as of early 2025), interpreting whether ratios below 1 are problematic for Apple requires comparing them to:
- Apple’s own historical norms over a longer period.
- Liquidity ratios of direct competitors in the tech hardware industry.
- A deeper analysis of Apple’s cash flow generation and debt structure.
Takeaway: The visualization quickly highlights Apple’s recent liquidity trend (peaking in early 2024, declining thereafter) and its general position relative to the 1.0 benchmark. It emphasizes the importance of inventory (the gap between the lines) and, most importantly, underscores that ratio analysis must always be contextualized, especially for unique companies like Apple.
Conclusion: Gauging Short-Term Financial Health
Calculating and visualizing the Current and Quick Ratios provides valuable insights into a company’s short-term financial resilience. By automating this process with Python, `pandas`, and `matplotlib`, we can efficiently track liquidity trends and identify potential risks or improvements over time using Balance Sheet data. Remember that these ratios are just one part of the puzzle and should be analyzed alongside profitability, debt levels, cash flow, and qualitative factors.
Having looked at profitability and liquidity, we’ll likely turn our attention to leverage in the next post. We will calculate Debt Ratios (like Debt-to-Equity) in Python, using the Balance Sheet again to understand a company’s long-term solvency and financial risk. Stay tuned!
Disclaimer: This blog post is for educational purposes only. Financial data APIs provide data “as is”; always verify critical data from official sources (e.g., SEC filings) before making investment decisions. Ensure compliance with API provider terms of service. this post was drafted with help of AI and reviewed and changed by the author.