Initial Unemployment Claims: The Economic Canary in the Coal Mine
Picture this: You’re driving down the highway, and your car’s check engine light starts blinking. Do you ignore it and keep cruising? Or do you pull over to investigate before your engine seizes up completely?
Initial unemployment claims are basically the economy’s check engine light—and right now, that light is blinking pretty frantically. The latest data shows 247,000 Americans filed for unemployment benefits in the week ending May 31, 2025, marking an 8-month high that has economists raising their eyebrows and reaching for their recession playbooks.
But here’s the thing: unlike your car’s cryptic dashboard warnings, unemployment claims actually tell a pretty straightforward story once you know how to read them. And if you’re building Python models for financial analysis (which, let’s face it, is why you’re here), understanding this indicator could be the difference between catching the next market downturn early or getting caught with your portfolio pants down.
Why Unemployment Claims Matter More Than You Think
Think of initial unemployment claims as the economic equivalent of a social media trending topic—they capture what’s happening right now, not what happened three months ago when the official employment report was compiled. Every week, the Department of Labor tallies up how many people filed for unemployment benefits for the first time, giving us a real-time pulse check on the labor market.
Here’s why this matters: When companies start feeling economic pressure—whether from tariffs, inflation, or that general “uh-oh” feeling that pervades corporate boardrooms—the very first thing they do isn’t slash CEO bonuses or cancel the office Christmas party. They start laying people off. And when those newly unemployed folks file for benefits, boom—it shows up in the weekly claims data faster than bad news travels through a WhatsApp group chat.
The current reading of 247,000 is particularly noteworthy because it represents a 3.35% jump from the previous week and sits 11.76% higher than the same period last year. For context, economists typically consider anything above 300,000 claims as a red flag, while readings below 250,000 suggest a healthy labor market. We’re right on that dividing line, teetering between “fine” and “hmm, maybe we should worry.”
The Tariff Elephant in the Room
Now, let’s talk about the economic equivalent of adding jalapeños to your morning coffee: President Trump’s tariff policies. Nearly three-quarters of consumers are spontaneously mentioning tariffs in economic surveys, up from 60% in April.That’s not just small talk—it’s translating into real business decisions.
Companies across the country are facing the economic equivalent of a surprise tax bill. John Starr, who runs UltraSource (a meat-processing equipment company), put it bluntly: “How am I supposed to pay this?” The uncertainty isn’t just hitting profits; it’s forcing businesses to preserve cash by freezing hiring and, yes, cutting jobs.
The Federal Reserve’s latest Beige Book report noted that “comments about uncertainty delaying hiring were widespread,” with all districts reporting decreased labor demand through reduced hours, hiring freezes, and planned staff reductions. It’s like watching dominoes fall in slow motion—first comes uncertainty, then hiring freezes, then layoffs, then higher unemployment claims.
What Your Python Code Should Be Tracking
Alright, let’s get practical. If you want to stay ahead of these trends, here’s how you can set up your own unemployment claims monitoring system using Python:
# Accessing Initial Unemployment Claims via FRED APIimport pandas as pd
import matplotlib.pyplot as plt
import requests
# Get your free API key from: https://fred.stlouisfed.org/docs/api/api_key.html
API_KEY = "YOUR_FRED_API_KEY_HERE"
# Fetch unemployment claims data
url = "https://api.stlouisfed.org/fred/series/observations"
params = {
'series_id': 'ICSA', # Initial Claims Seasonally Adjusted
'api_key': API_KEY,
'file_type': 'json',
'observation_start': '2020-01-01'
}
response = requests.get(url, params=params)
data = response.json()['observations']
# Create DataFrame and plot
df = pd.DataFrame(data)
df['date'] = pd.to_datetime(df['date'])
df['value'] = pd.to_numeric(df['value'], errors='coerce')
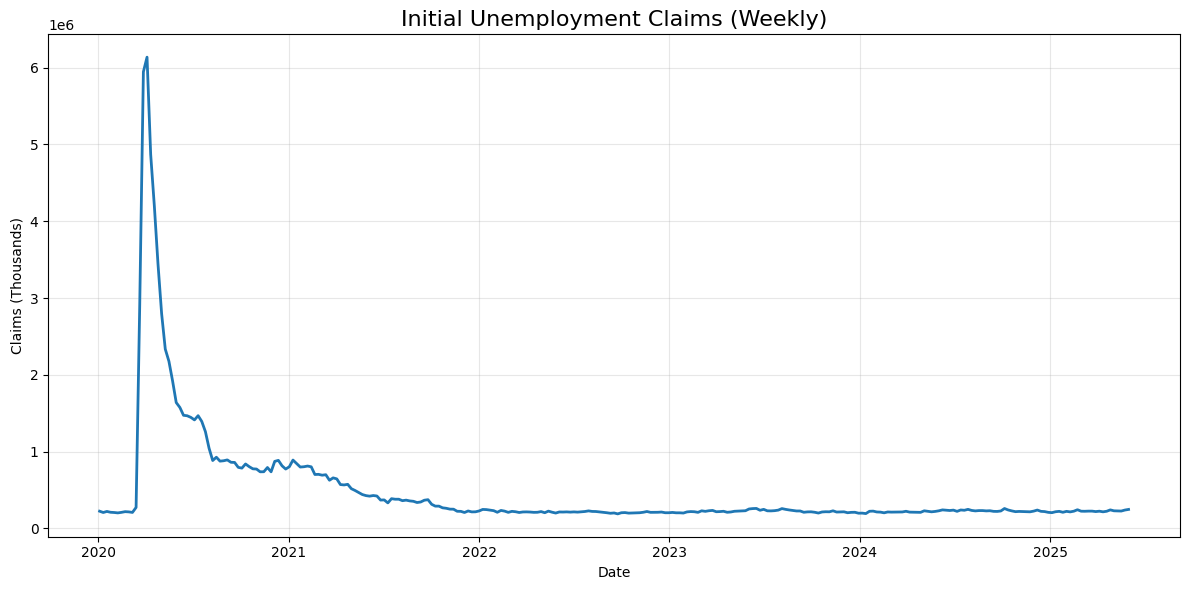
plt.figure(figsize=(12, 6))
plt.plot(df['date'], df['value'], linewidth=2)
plt.title('Initial Unemployment Claims (Weekly)', fontsize=16)
plt.xlabel('Date')
plt.ylabel('Claims (Thousands)')
plt.grid(True, alpha=0.3)
plt.tight_layout()
plt.show()
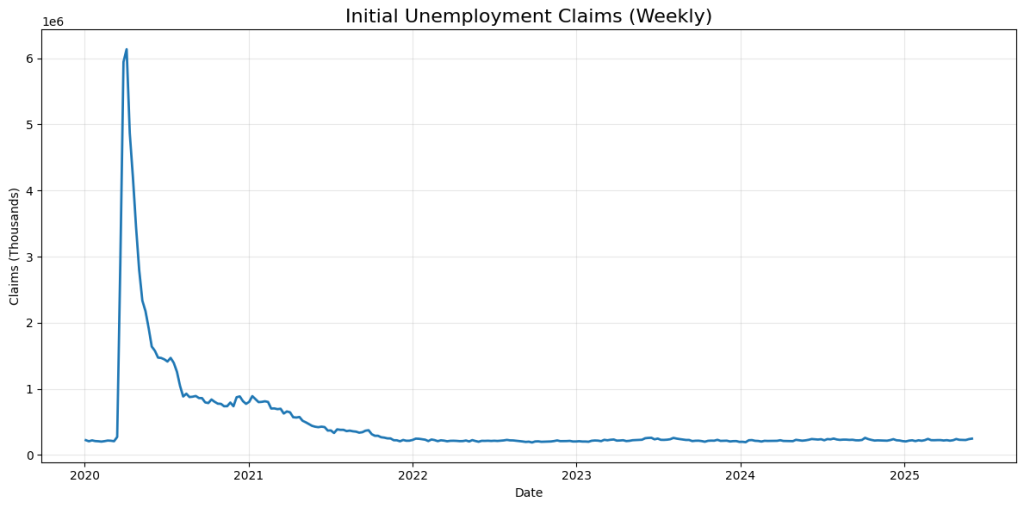
The beauty of the FRED API is that it updates every Thursday morning at 8:30 AM Eastern, so you can automate alerts when claims spike above certain thresholds. I typically watch for:
- Weekly increases above 15,000: Suggests something significant happened
- Four-week moving average above 250,000: Time to pay attention
- Monthly trend changes: Better indicator than weekly noise
Reading the Tea Leaves: What 247K Really Means
So what does this 8-month high actually tell us? It’s not screaming “recession incoming!” but it’s definitely clearing its throat loudly. The four-week moving average now sits at 235,000, which is elevated but not panic-inducing. Think of it as your economic check engine light going from steady green to occasional yellow.
The concerning part isn’t just the absolute number—it’s the trajectory. We’ve seen claims rise for two consecutive weeks, and the trend since early 2025 has been decidedly upward. When you combine this with other economic indicators showing stress (hello, Conference Board Leading Economic Index dropping 1.0% in April), you start seeing a pattern.
Christopher Thornberg from Beacon Economics probably said it best: “The economy has a lot of momentum, and so if Trump truly backs off on tariffs and just calms down, you could see this expansion going another two, three years, honestly.” But that’s a big “if.”
What This Means for You
For Python-savvy investors and financial analysts, this data offers several actionable insights:
1. Sector Rotation Opportunities: Industries most exposed to tariffs (manufacturing, retail, trade) will likely see higher layoffs first. You can monitor sector-specific employment data through the Bureau of Labor Statistics API to get ahead of these trends.
2. Interest Rate Implications: Rising unemployment claims could eventually push the Fed toward rate cuts, which affects everything from REITs to growth stocks. The current claims level isn’t enough to trigger immediate policy changes, but sustained increases above 300,000 would definitely get their attention.
3. Consumer Spending Signals: Higher unemployment claims typically precede drops in consumer spending by 2-3 months. If you’re modeling retail or consumer discretionary stocks, factor in a potential spending slowdown for Q3 2025.
The Bottom Line: Stay Alert, Not Alarmed
The unemployment claims data is painting a picture of an economy under stress but not yet in crisis. It’s like watching storm clouds gather—you might not need to run for cover yet, but you should probably know where your umbrella is.
For the Python finance community, this is exactly the kind of forward-looking indicator that can give you an edge. While everyone else is waiting for quarterly earnings or monthly employment reports, you can be tracking these weekly releases and positioning accordingly.
The key is automation. Set up your scripts to pull this data weekly, establish your own threshold alerts, and combine it with other leading indicators for a more complete picture. Because in this business, the early bird doesn’t just get the worm—it gets the worm before everyone else even knows there are worms to be had.
Keep your code updated, your models fresh, and your economic radar on. The data is telling us a story—we just need to make sure we’re listening. In the next post, we look at Continuing Unemployment Claims.
The post is for informational purposes only and does not constitute financial advice. You should not construe any such information or other material as legal, tax, investment, financial, or other advice.