6. Python for Fundamental Analysis: Boost Your Analysis with Efficiency Ratios (Turnover)
Introduction: How Well Are Assets Being Used?
Welcome back to the Python for Finance series! We’ve journeyed through valuation, data retrieval, profitability, liquidity, and leverage. If you missed any previous posts, you can catch up here:
- Calculating P/E Ratio
- Automating Financial Statement Retrieval
- Calculating & Visualizing Profitability Ratios
- Analyzing Liquidity Ratios (Current & Quick)
- Analyzing Debt Ratios (Debt-to-Equity)
Now, we shift our focus to Efficiency Ratios, also known as Activity Ratios or Turnover Ratios. These ratios measure how effectively a company utilizes its assets and manages inventory to generate revenue. They provide crucial insights into operational performance – is the company getting the most bang for its buck from its assets? How quickly is it selling products?
This post explores two key efficiency ratios: Asset Turnover and Inventory Turnover. We’ll use Python, pandas, and matplotlib to fetch quarterly Income Statement and Balance Sheet data via the FMP API, calculate these ratios requiring data from both statements, and visualize the trends over the last 10 quarters.
Understanding Efficiency Ratios
Efficiency ratios reveal the speed and effectiveness of a company’s operations.
1. Asset Turnover Ratio
- What it is: Measures how efficiently assets generate revenue. Indicates sales generated per dollar of assets.
- Formula: Asset Turnover Ratio = Net Sales \ Average Total Assets
- Net Sales (Revenue): From the Income Statement for the period.
- Average Total Assets: (Beginning Total Assets + Ending Total Assets) / 2. Requires Balance Sheet data for the current and prior period ends.
- Why it’s important: Higher ratio suggests efficient asset use. Essential for comparing over time and against industry peers (e.g., retail vs. utilities).
- Caveat: Very high turnover might indicate insufficient assets for sales volume; low turnover suggests inefficiency.
2. Inventory Turnover Ratio
- What it is: Measures how many times inventory is sold and replaced over a period. Indicates inventory movement speed.
- Formula: Inventory Turnover Ratio = Cost of Goods Sold (COGS)/Average Inventory
- Cost of Goods Sold (COGS): From the Income Statement (often listed as
costOfRevenuein APIs). - Average Inventory: (Beginning Inventory + Ending Inventory) / 2. Requires Balance Sheet data for current and prior period ends.
- Cost of Goods Sold (COGS): From the Income Statement (often listed as
- Why it’s important: Higher ratio implies strong sales or efficient inventory management. Shows how quickly inventory converts to sales.
- Caveat: Very high turnover might risk stock-outs; low turnover suggests weak sales or overstocking. Highly industry-dependent.
(Days Sales of Inventory (DSI) = 365 / Inventory Turnover Ratio, showing days to sell inventory).
Calculating these requires combining data across statements and time periods.
Python Implementation: Calculating and Visualizing Turnover Ratios
Let’s write the code. We need 10 quarters of Income Statement data and 11 quarters of Balance Sheet data (to calculate 10 periods of averages).
API Key & Libraries: Use your FMP API key (replace placeholder or use environment variables). Ensure pandas, requests, and matplotlib are installed (pip install pandas requests matplotlib).
import requests
import pandas as pd
import matplotlib.pyplot as plt
import numpy as np
import os

# --- Configuration ---
# API Key provided by user (Normally, use environment variables for security)
API_KEY = "your api key"
# Ticker symbol of the company to analyze
TICKER = "AAPL"
# Number of periods for ratio calculation (requires N+1 balance sheet periods)
NUM_RATIO_PERIODS = 10
# Limit for API calls (N+1 for balance sheet)
BS_LIMIT = NUM_RATIO_PERIODS + 1
IS_LIMIT = NUM_RATIO_PERIODS # Income statement covers the period *between* balance sheets
# Base URL for FMP API version 3
BASE_URL = "https://financialmodelingprep.com/api/v3"

# --- Function to Fetch Data from FMP API ---
# Reusing the function from previous posts
def get_financial_data(url):
    """ Fetches data from the FMP API endpoint. """
    print(f"Attempting to fetch data from: {url}")
    try:
        response = requests.get(url, timeout=15)
        response.raise_for_status()
        data = response.json()
        if isinstance(data, list):
            if len(data) > 0:
                print(f"Successfully fetched {len(data)} periods of data.")
                return data
            else:
                print(f"Warning: Received empty list from {url}.")
                return None
        elif isinstance(data, dict) and 'Error Message' in data:
             print(f"Error from API at {url}: {data['Error Message']}")
             return None
        else:
            print(f"Warning: Received unexpected data format from {url}. Type: {type(data)}")
            return None
    except requests.exceptions.RequestException as e:
        print(f"Error fetching data from {url}: {e}")
        return None
    except requests.exceptions.JSONDecodeError as e:
        print(f"Error decoding JSON response from {url}: {e}\nResponse text: {response.text}")
        return None
    except Exception as e:
        print(f"An unexpected error occurred while fetching {url}: {e}")
        return None

# --- Main Execution Logic ---
if __name__ == "__main__":
    print(f"\n--- Calculating Efficiency Ratios for {TICKER} ({NUM_RATIO_PERIODS} Quarters) ---")

    # Construct URLs for quarterly statements
    income_url = f"{BASE_URL}/income-statement/{TICKER}?period=quarter&limit={IS_LIMIT}&apikey={API_KEY}"
    balance_url = f"{BASE_URL}/balance-sheet-statement/{TICKER}?period=quarter&limit={BS_LIMIT}&apikey={API_KEY}"

    # Fetch the financial statement data
    print("\nFetching Income Statement data...")
    income_data = get_financial_data(income_url)
    print("\nFetching Balance Sheet data...")
    balance_data = get_financial_data(balance_url)

    # Proceed only if both API calls were successful
    if income_data and balance_data:
        # Convert to DataFrames
        df_income = pd.DataFrame(income_data)
        df_balance = pd.DataFrame(balance_data)
        print(f"\nIncome Statement DataFrame shape: {df_income.shape}")
        print(f"Balance Sheet DataFrame shape: {df_balance.shape}")

        # --- Data Cleaning and Preparation ---
        # Define required columns
        req_income_cols = ['date', 'revenue', 'costOfRevenue']
        req_balance_cols = ['date', 'totalAssets', 'inventory']

        # Check for required columns
        if not all(col in df_income.columns for col in req_income_cols):
            print(f"Error: Income Statement DF missing columns. Required: {req_income_cols}")
            missing = [col for col in req_income_cols if col not in df_income.columns]
            print(f"Missing: {missing}")
            df_income = pd.DataFrame() # Halt processing
        if not all(col in df_balance.columns for col in req_balance_cols):
            print(f"Error: Balance Sheet DF missing columns. Required: {req_balance_cols}")
            missing = [col for col in req_balance_cols if col not in df_balance.columns]
            print(f"Missing: {missing}")
            df_balance = pd.DataFrame() # Halt processing

        if not df_income.empty and not df_balance.empty:
            # Convert date columns to datetime
            df_income['date'] = pd.to_datetime(df_income['date'])
            df_balance['date'] = pd.to_datetime(df_balance['date'])

            # Sort by date (oldest to newest)
            df_income.sort_values(by='date', ascending=True, inplace=True)
            df_balance.sort_values(by='date', ascending=True, inplace=True)

            # Convert financial columns to numeric
            numeric_income_cols = ['revenue', 'costOfRevenue']
            numeric_balance_cols = ['totalAssets', 'inventory']
            for col in numeric_income_cols:
                df_income[col] = pd.to_numeric(df_income[col], errors='coerce')
            for col in numeric_balance_cols:
                df_balance[col] = pd.to_numeric(df_balance[col], errors='coerce')

            # Prepare Balance Sheet data for averaging
            df_balance_avg = df_balance[['date', 'totalAssets', 'inventory']].copy()
            # Create shifted columns for previous period's balances
            df_balance_avg['prev_totalAssets'] = df_balance_avg['totalAssets'].shift(1)
            df_balance_avg['prev_inventory'] = df_balance_avg['inventory'].shift(1)

            # Merge income statement data with prepared balance sheet data
            # Use 'inner' merge to align periods where both IS and BS data (incl. previous BS) are available
            df_merged = pd.merge(
                df_income[['date', 'revenue', 'costOfRevenue']],
                df_balance_avg,
                on='date',
                how='inner'
            )
            print(f"\nMerged DataFrame shape: {df_merged.shape}")

            # Drop rows where previous period data is NaN (this happens for the oldest period)
            # Also drop if any required current data became NaN during conversion
            required_calc_cols = ['revenue', 'costOfRevenue', 'totalAssets', 'inventory', 'prev_totalAssets', 'prev_inventory']
            initial_rows_merged = len(df_merged)
            df_merged.dropna(subset=required_calc_cols, inplace=True)
            rows_after_dropna = len(df_merged)
            if initial_rows_merged > rows_after_dropna:
                print(f"Dropped {initial_rows_merged - rows_after_dropna} rows due to missing data needed for averages/calculations.")


            if not df_merged.empty:
                # Calculate Average Assets and Inventory
                df_merged['Average Total Assets'] = (df_merged['totalAssets'] + df_merged['prev_totalAssets']) / 2
                df_merged['Average Inventory'] = (df_merged['inventory'] + df_merged['prev_inventory']) / 2

                # --- Calculate Efficiency Ratios ---
                print("\nCalculating Efficiency Ratios...")

                # Asset Turnover: Revenue / Average Total Assets
                # Check for zero average assets
                df_merged['Asset Turnover'] = df_merged.apply(
                    lambda row: row['revenue'] / row['Average Total Assets'] if row['Average Total Assets'] > 0 else np.nan,
                    axis=1
                )

                # Inventory Turnover: COGS / Average Inventory
                # Check for zero average inventory
                df_merged['Inventory Turnover'] = df_merged.apply(
                    lambda row: row['costOfRevenue'] / row['Average Inventory'] if row['Average Inventory'] > 0 else np.nan,
                    axis=1
                )

                # Drop rows where ratios resulted in NaN (due to zero denominator)
                df_final = df_merged.dropna(subset=['Asset Turnover', 'Inventory Turnover']).copy()


                if not df_final.empty:
                    print(f"\n--- Calculated Efficiency Ratios ({len(df_final)} Quarters) ---")
                    print(df_final[['date', 'Asset Turnover', 'Inventory Turnover']].round(2))

                    # --- Visualization ---
                    print("\n--- Generating Plots ---")
                    fig, ax = plt.subplots(2, 1, figsize=(12, 10), sharex=True) # Share x-axis

                    # Plot Asset Turnover
                    ax[0].plot(df_final['date'], df_final['Asset Turnover'], label='Asset Turnover', marker='o', linestyle='-')
                    ax[0].set_title(f'{TICKER} Quarterly Asset Turnover')
                    ax[0].set_ylabel('Ratio Value')
                    ax[0].grid(True, linestyle='--', alpha=0.6)
                    ax[0].legend()

                    # Plot Inventory Turnover
                    ax[1].plot(df_final['date'], df_final['Inventory Turnover'], label='Inventory Turnover', marker='s', linestyle='-', color='orange')
                    ax[1].set_title(f'{TICKER} Quarterly Inventory Turnover')
                    ax[1].set_ylabel('Ratio Value')
                    ax[1].set_xlabel('Date (Quarter End)')
                    ax[1].grid(True, linestyle='--', alpha=0.6)
                    ax[1].legend()

                    # Improve layout and display the plot
                    plt.xticks(rotation=45, ha='right')
                    plt.tight_layout()
                    plt.show()
                else:
                    print("\nDataFrame empty after calculating ratios (potentially due to zero denominators). Cannot plot.")
            else:
                print("\nDataFrame empty after merging or dropping initial NaNs. Cannot calculate ratios.")
        else:
            print("\nOne or both DataFrames are empty after initial checks. Cannot proceed.")
    else:
        print("\nFailed to fetch financial statement data. Cannot calculate ratios.")

    print("\n--- Script Finished ---")
Code Explanation: Step-by-Step
- Imports & Config: Imports
requests,pandas,matplotlib.pyplot,numpy(fornp.nan),os. Sets API key,TICKER, definesNUM_RATIO_PERIODS=10, calculatesBS_LIMIT=11andIS_LIMIT=10needed for averaging, setsBASE_URL. get_financial_data(url)Function: Reuses the error-handling function to fetch data lists from FMP.- Fetch Financial Data:
- Constructs URLs for quarterly Income Statements (
limit=10) and Balance Sheets (limit=11). Fetching N+1 Balance Sheet periods is essential for calculating N periods of average balances. - Calls
get_financial_datafor both statement types.
- Constructs URLs for quarterly Income Statements (
- Data Processing and Ratio Calculation:
- Check & Create DataFrames: Verifies data was fetched for both statements, then creates
df_incomeanddf_balance. - Column & Data Type Checks: Defines required columns (
date,revenue,costOfRevenue,totalAssets,inventory) and checks if they exist in the respective DataFrames. Converts dates to datetime objects and relevant financial columns to numeric, coercing errors. - Prepare for Averaging: Selects needed columns from
df_balance, sorts by date, and uses.shift(1)to createprev_totalAssetsandprev_inventorycolumns, aligning the previous quarter’s data with the current quarter’s row. - Merge DataFrames: Performs an
innermerge usingpd.merge()on thedatecolumn to combine income statement items (revenue,costOfRevenue) with the balance sheet data containing current and previous period assets/inventory. - Handle Missing Data Post-Merge: Uses
dropna()to remove rows withNaNvalues in any column needed for the average calculation. This naturally removes the oldest period (which has no ‘previous’ data due to the shift) and any rows where numeric conversion failed. - Calculate Averages: Computes
Average Total AssetsandAverage Inventoryusing the current andprev_columns. - Calculate Ratios: Calculates
Asset TurnoverandInventory Turnover. It usesdf.applywith a check for a positive denominator (> 0), returningnp.nanif the average is zero or negative to prevent errors and indicate an invalid calculation. - Final Clean: Drops any rows where the ratio calculation resulted in
np.nanand stores the result indf_final. - Display Ratios: Prints the
date,Asset Turnover, andInventory Turnoverfrom the final DataFrame.
- Check & Create DataFrames: Verifies data was fetched for both statements, then creates
- Visualization:
- Check for Data: Ensures
df_finalcontains data. - Create Subplots: Uses
plt.subplots(2, 1, sharex=True)to create two vertically stacked plots that share the same date axis, making trend comparison easier. - Plot Data: Plots Asset Turnover on the top subplot (
ax[0]) and Inventory Turnover on the bottom subplot (ax[1]), using distinct markers and colors. - Format Plots: Sets titles, y-axis labels, legends, and grids individually for each subplot. The x-axis label is only set on the bottom plot.
- Display: Rotates x-axis labels, uses
plt.tight_layout()for good spacing, andplt.show()to display the figure with both plots.
- Check for Data: Ensures
- Error Handling: Includes checks for API failures, missing columns, and empty DataFrames at various stages of processing and calculation.
Interpreting the Efficiency Ratio Results
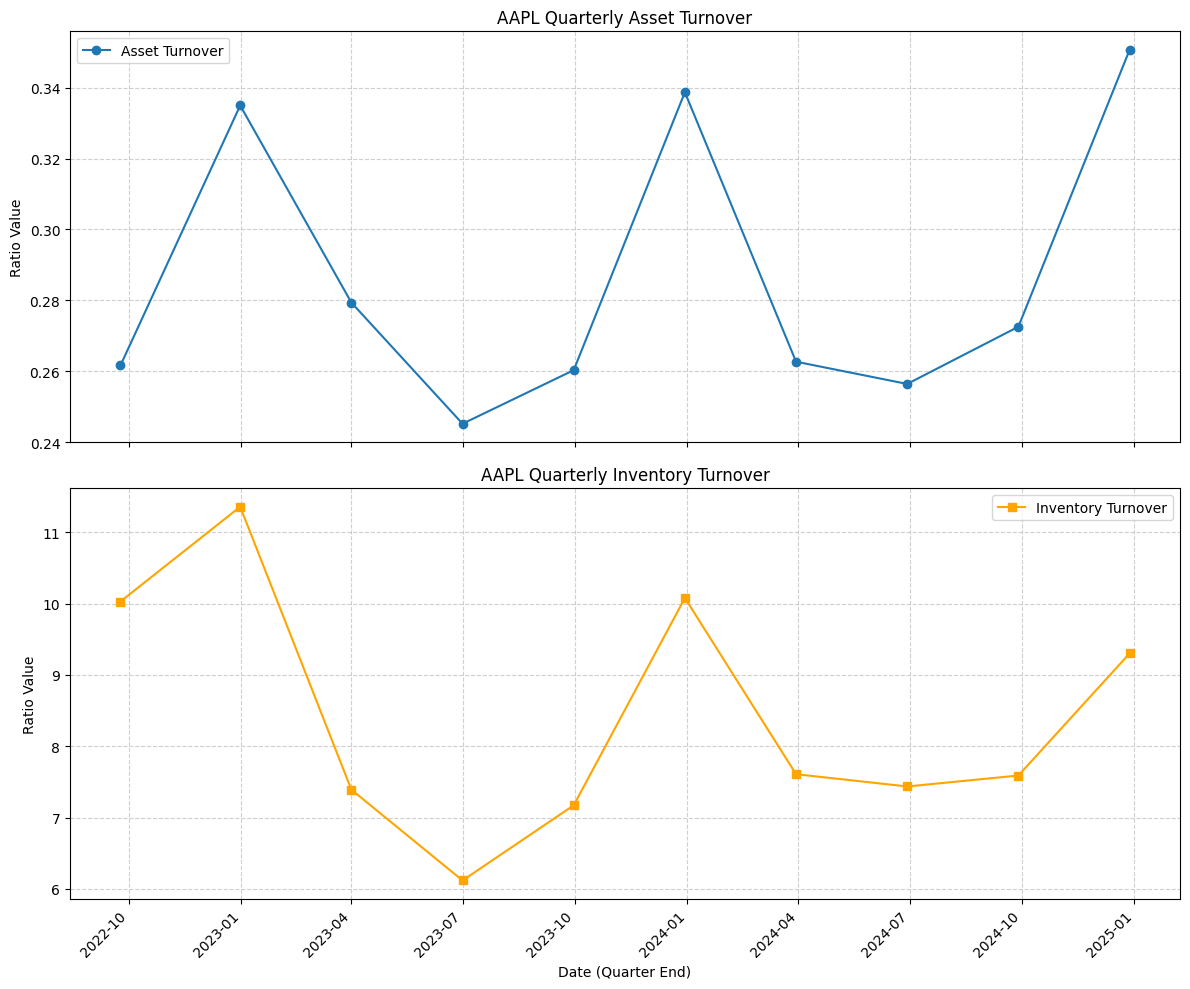
Let’s examine the two charts generated by our script for Apple (AAPL), showing the Asset Turnover and Inventory Turnover ratios over the 10 quarters ending in early 2025:
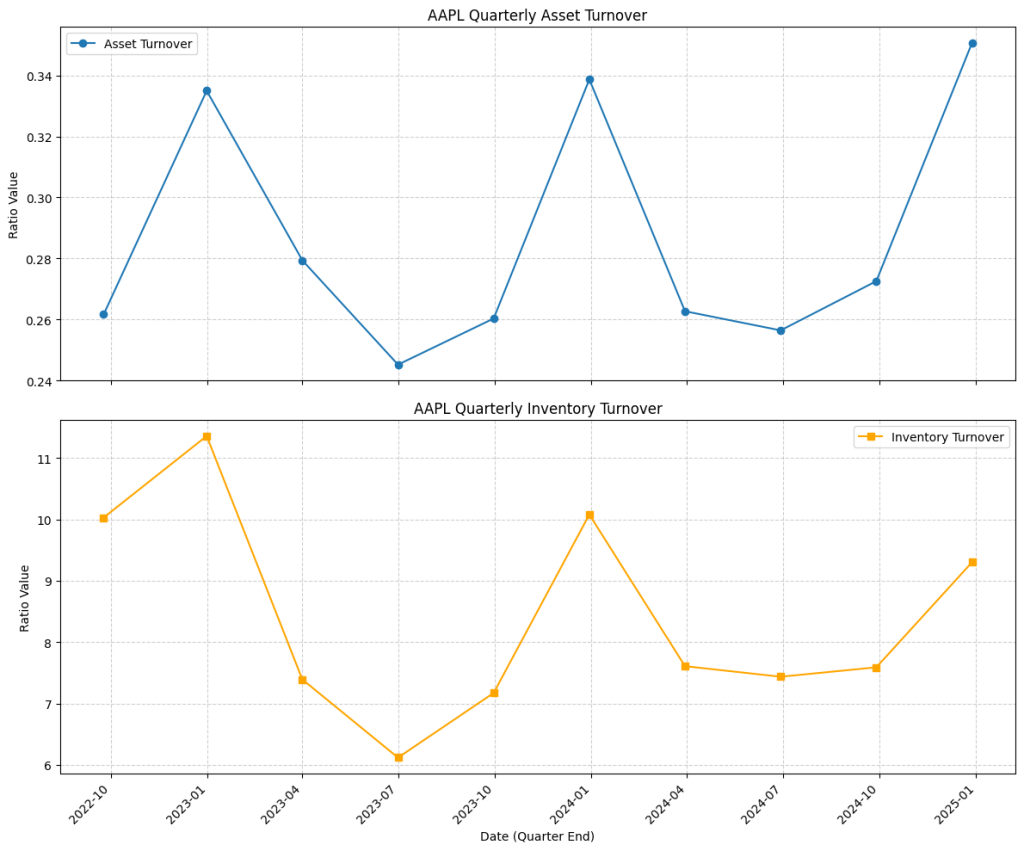
- Strong Seasonality: The most striking feature across both charts is a clear seasonal pattern.
- Asset Turnover (Top Chart): Peaks consistently in the first quarter of each calendar year (e.g., early 2023, early 2024, early 2025) reaching about 0.34, and hits lows mid-year (around 0.24-0.26). This peak likely reflects the high revenue generated during the holiday season relative to the average assets held.
- Inventory Turnover (Bottom Chart): Mirrors the seasonality of Asset Turnover, peaking above 11 in early 2023 and near 10 in early 2024/2025, with troughs near 6-7 mid-year. This indicates inventory moves fastest (highest turnover) during Apple’s peak sales periods and slows down considerably mid-year.
- Asset Turnover Interpretation: The ratio fluctuates between roughly 0.24 and 0.34. This means Apple generates about $0.24 to $0.34 in revenue annually for every $1 of assets it employs (adjusting for the quarterly nature, the annualized figure would be higher). While seemingly low compared to, say, retail, this level might be typical for a capital-intensive tech hardware company with significant investments in R&D, manufacturing capabilities (even if outsourced), and brand value (intangible assets). A comparison with direct competitors like Samsung or other large tech hardware firms is essential to judge if this level of asset utilization is efficient for its sector.
- Inventory Turnover Interpretation: The ratio ranges significantly from ~6 to ~11. A turnover of 11 means Apple sold and replaced its entire inventory roughly 11 times over the year preceding that quarter (on an annualized basis), taking only about 33 days (365/11). A turnover of 6 means it took closer to 60 days (365/6). The high peaks demonstrate very efficient inventory clearance during strong sales periods. The lower points likely reflect inventory build-up ahead of new product launches or during slower sales seasons. For managing complex global supply chains for hardware, achieving peak turnover rates above 10 is generally considered very strong.
- Combined Insights: The synchronized seasonality strongly suggests that sales volume fluctuations (driven by product cycles and holidays) are the primary driver behind the variations in both asset and inventory efficiency as measured by these ratios. The company appears highly efficient during peak times but sees a natural slowdown in turnover during off-peak quarters.
Takeaway: Visualizing these efficiency ratios quickly reveals significant operational seasonality in Apple’s business. It highlights the efficiency of inventory management during peak periods and provides asset turnover figures that, while requiring industry comparison, reflect the nature of Apple’s business model.
Conclusion: Optimizing Operations
Efficiency ratios like Asset Turnover and Inventory Turnover provide critical visibility into how well a company manages its operations and utilizes its resources. By automating their calculation and visualization in Python, we can track performance trends, identify areas for improvement, and make more informed comparisons against competitors. These metrics are essential for understanding the operational engine driving a company’s financial results.
We’ve covered the major categories of financial ratios. A powerful next step is Peer Company Analysis. We could write Python code to fetch key metrics (like the ratios we’ve calculated) for multiple companies within the same industry and visualize their comparative performance. This helps put a single company’s results into perspective. Stay tuned!
Disclaimer: This blog post is for educational purposes only. Financial data APIs provide data “as is”; always verify critical data from official sources (e.g., SEC filings) before making investment decisions. Ensure compliance with API provider terms of service. this post was drafted with help of AI and reviewed and changed by the author.