Durable Goods Orders Analysis: Manufacturing Volatility Signals Economic Uncertainty in 2025
If the Conference Board LEI is the economy’s smoke detector, then durable goods orders are like your neighbor’s car alarm—loud, attention-grabbing, and going off at seemingly random times, but occasionally signaling something actually important is happening.
Welcome back to our deep dive into U.S. economic indicators, where we decode the signals that Wall Street obsesses over and Main Street mostly ignores. Today we’re tackling durable goods orders, the manufacturing sector’s most bipolar data point that swung from a 7.6% surge in March to a 6.3% plunge in April 2025. It’s like watching a manufacturing mood ring, except instead of changing colors, it’s changing by tens of billions of dollars.
The Wild Ride: From Boom to Bust in 30 Days
Let’s start with the numbers that made economists reach for both coffee and antacids. New orders for manufactured durable goods crashed by $19.9 billion in April, falling to $296.3 billion after four consecutive months of increases. That’s like losing the GDP of a small country in a single month, which sounds dramatic because it kind of is.
But here’s the thing about durable goods orders—they’re naturally volatile, like that friend who decides to quit their job and become a travel blogger every few months. These are big-ticket items that companies don’t buy on impulse: aircraft, machinery, computers, and other equipment that lasts three years or more. When Boeing gets a massive order from an airline, it can swing the entire monthly number. When that order gets delayed or canceled, well, you get April 2025.
The culprit this time? Transportation equipment, which fell by a whopping $20.3 billion or 17.1%. Translation: companies aren’t exactly lining up to buy new planes, trains, and automobiles right now. And when you exclude transportation from the equation (which economists love to do because it’s so volatile), new orders actually increased by 0.2%—a much less dramatic but probably more meaningful signal.
Why Your Python Skills Beat the Headlines
Here’s where things get interesting for us data nerds. The financial media loves to breathlessly report each monthly swing in durable goods orders, but smart analysts know you need to look deeper. Python makes this easy, and the Census Bureau’s API gives you direct access to the data.
Getting Started with Durable Goods Data:
import pandas as pd
import requests
import matplotlib.pyplot as plt
from fredapi import Fred

# Method 1: Using FRED API (most reliable)
fred = Fred(api_key='your_api_key_here')
durable_goods = fred.get_series('DGORDER', start='2020-01-01')

# Method 2: Direct from Census Bureau
census_url = "https://api.census.gov/data/timeseries/eits/m3"
# Note: Requires Census API key and more complex parsing

# Calculate 3-month moving average to smooth volatility
durable_goods_ma = durable_goods.rolling(window=3).mean()

# Plot both raw data and smoothed trend
plt.figure(figsize=(12, 8))
plt.plot(durable_goods.tail(36), alpha=0.6, label='Monthly Orders', linewidth=1)
plt.plot(durable_goods_ma.tail(36), label='3-Month Average', linewidth=2)
plt.title('Durable Goods Orders: Raw Data vs. Trend')
plt.legend()
plt.grid(True, alpha=0.3)
plt.show()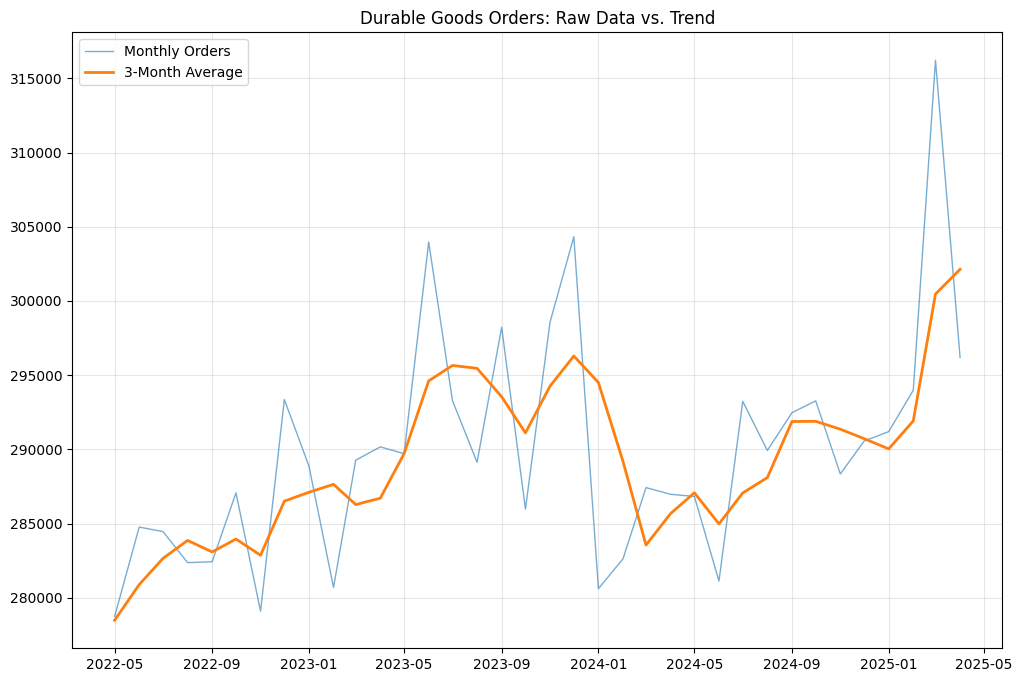
The Transportation Trap
Transportation equipment is both the blessing and curse of durable goods analysis. It’s a massive category—think commercial aircraft, defense equipment, ships, and heavy machinery—but it’s also lumpy as hell. A single airline order for 100 jets can add billions to one month’s numbers, while a delayed delivery can crater the next month’s figures.
That’s exactly what happened in April. Transportation equipment orders fell 17.1%, dragging down the entire category. But strip out transportation, and you get a much calmer 0.2% increase. Strip out defense orders too (because military procurement follows its own weird logic), and orders actually declined 7.5%.
This is why savvy analysts always look at “core” durable goods orders—excluding transportation and defense. It’s less exciting than the headline number but much more useful for understanding actual business confidence and capital investment trends.
Python Analysis Tip:
# Analyze core vs. headline durable goods
headline_dg = fred.get_series('DGORDER')
core_dg = fred.get_series('NEWORDER')  # Non-defense capital goods ex-aircraft

# Calculate correlation
correlation = headline_dg.corr(core_dg)
print(f"Correlation between headline and core: {correlation:.3f}")

# Plot both to see divergences
fig, (ax1, ax2) = plt.subplots(2, 1, figsize=(12, 10))
ax1.plot(headline_dg.tail(60), label='Headline Durable Goods')
ax1.set_title('Headline Durable Goods Orders')
ax1.grid(True, alpha=0.3)

ax2.plot(core_dg.tail(60), label='Core Orders (Ex-Transportation)', color='orange')
ax2.set_title('Core Durable Goods Orders')
ax2.grid(True, alpha=0.3)
plt.tight_layout()
What This Tells Us About Business Confidence
Durable goods orders are essentially a window into corporate boardrooms across America. When companies order new equipment, they’re making a bet on future demand. When they don’t, they’re either cash-strapped or pessimistic about what’s coming down the pike.
The April decline, even excluding the transportation noise, suggests businesses are getting cautious. And this lines up with what we saw in our previous post about the Conference Board LEI—multiple indicators are flashing yellow warning lights about economic momentum.
But here’s the nuance that gets lost in the headlines: manufacturing new orders have been on a roller coaster for months. March saw a 7.6% surge, which was followed by April’s 6.3% decline. This isn’t a steady downward trend; it’s volatility, which often signals uncertainty rather than outright pessimism.
The Global Factor: Tariffs and Trade Wars
You can’t talk about U.S. manufacturing in 2025 without mentioning the elephant in the room: trade policy. The April durable goods decline happened against a backdrop of ongoing tariff uncertainty, and businesses hate uncertainty almost as much as they hate paying taxes.
When companies don’t know what their input costs will be next quarter due to potential tariff changes, they delay big purchases. It’s like trying to plan a wedding when you don’t know if your venue will double its prices next month—you end up postponing decisions until the dust settles.
The Conference Board has noted that tariff impacts are expected to hit hardest in Q3 2025, which means the manufacturing sector could face more headwinds ahead.
Sector-by-Sector Breakdown: Where to Look
Not all durable goods are created equal. Some categories are early indicators of economic trends, while others are just noisy.
High-Signal Categories:
- Non-defense capital goods excluding aircraft (proxy for business investment)
- Computers and electronic products (tech sector health)
- Machinery (broad-based business confidence)
High-Noise Categories:
- Transportation equipment (too lumpy for trend analysis)
- Defense orders (driven by government procurement cycles)
What This Means for Your Investment Strategy
Durable goods orders are a leading indicator for several sectors, making them valuable for investment timing. When core orders are growing, industrial and technology stocks often outperform. When they’re declining, defensive sectors like utilities and consumer staples tend to hold up better.
But remember: the key is the trend, not individual monthly moves. A single month’s decline doesn’t mean you should dump your manufacturing stocks, but three consecutive months of weakness might signal it’s time to rebalance.
The Bottom Line: Signal vs. Noise
April’s 6.3% decline in durable goods orders looks scary in isolation, but context is everything. This is a volatile data series that swings wildly month-to-month. The more important signal is the underlying trend in core orders, which suggests business investment is slowing but not collapsing.
Combined with what we learned about the Conference Board LEI last week, we’re seeing a pattern of economic deceleration rather than outright contraction. It’s like the economy is downshifting from fifth gear to third—still moving forward, just not as fast.
For Python enthusiasts, durable goods orders offer a masterclass in the importance of data preprocessing and noise reduction. The raw numbers tell one story, but the smoothed trends and sector breakdowns tell another. Learn to separate signal from noise, and you’ll have a significant advantage in understanding where the economy is really headed.
Next week, we’ll explore the housing market’s tale of two indicators: why building permits are falling while housing starts are rising, and what this divergence means for the economy’s foundation.
Read Next: Housing’s Tale of Two Markets: Starts vs. Permits Divergence
Previous: The Economic Crystal Ball: Conference Board LEI Signals Warning
The post is for informational purposes only and does not constitute financial advice. You should not construe any such information or other material as legal, tax, investment, financial, or other advice.