5. Python for Fundamental Analysis: Company Leverage with Debt-to-Equity Ratio
Welcome back to the Python for Finance series! Having explored valuation (Post 1), financial statements (Post 2), profitability (Post 3), and liquidity (Post 4), we now examine another crucial aspect: Leverage.
Leverage involves using debt to finance operations and assets. While it can magnify returns, it also increases financial risk, making companies more vulnerable during downturns due to fixed debt obligations. Understanding a company’s debt load via leverage ratios is key to assessing its long-term solvency and risk profile.
This post focuses on the widely used Debt-to-Equity (D/E) ratio. We’ll use Python, pandas, and matplotlib with FMP API data to calculate the D/E ratio from quarterly Balance Sheets and visualize its trend over the last 10 quarters.
Understanding the Debt-to-Equity (D/E) Ratio
What it is:
The Debt-to-Equity ratio compares a company’s debt financing to its equity financing, indicating the balance between creditor funding and shareholder funding.
Formula:
There are a couple of common variations:
- Using Total Liabilities: This shows the ratio of everything owed (short-term and long-term) to the shareholders’ stake.
- Using Total Debt (Interest-Bearing): This focuses specifically on interest-bearing debt (short-term + long-term borrowings) relative to equity. Many analysts prefer this as it isolates the debt that carries explicit financing costs. Financial APIs like FMP often provide a
totalDebtfield directly. Our Python code implementation will use this second variation, utilizing thetotalDebtfield.
- Components (from Balance Sheet):
totalDebt: Typically represents the sum of short-term and long-term interest-bearing borrowings.totalStockholdersEquity: The shareholders’ claim on assets after liabilities are paid (Assets – Liabilities).
Why it’s important:
- Risk Assessment: Higher D/E generally implies higher risk due to increased reliance on borrowing.
- Capital Structure Insight: Reveals financing strategy (debt vs. equity preference).
- Creditworthiness: Influences lender decisions and borrowing costs.
- Comparison Tool: Crucial for comparing against industry peers and historical levels.
Interpretation Caveats:
- Industry Norms: Acceptable D/E ratios vary significantly by industry (e.g., utilities vs. software).
- Asset/Earnings Quality: Stable earnings can support higher D/E.
- Negative Equity: If equity is zero or negative, D/E is meaningless/undefined and indicates severe distress. Our code handles this.
Python Implementation: Calculating and Visualizing D/E Ratio
Let’s use the following Python code to fetch quarterly Balance Sheet data, calculate the D/E ratio (using totalDebt), and plot the trend.
API Key & Libraries: You’ll need your FMP API key (replace the placeholder or use environment variables) and the required libraries (pip install pandas requests matplotlib).
import requests
import pandas as pd
import matplotlib.pyplot as plt
import numpy as np # For handling potential NaN/inf values if needed
import os

# --- Configuration ---
# API Key provided by user (Normally, use environment variables for security)
API_KEY = "your api key"
# Ticker symbol of the company to analyze
TICKER = "AAPL"
# Number of past quarters to retrieve
LIMIT = 10
# Base URL for FMP API version 3
BASE_URL = "https://financialmodelingprep.com/api/v3"

# --- Function to Fetch Data from FMP API ---
# Reusing the function from previous posts
def get_financial_data(url):
    """
    Fetches data from the specified Financial Modeling Prep API endpoint.
    Designed to handle endpoints that return a list of records.

    Args:
        url (str): The API endpoint URL.

    Returns:
        list or None: A list of dictionaries containing the fetched data if successful,
                      otherwise None.
    """
    print(f"Attempting to fetch data from: {url}")
    try:
        response = requests.get(url, timeout=15)
        response.raise_for_status() # Check for HTTP errors
        data = response.json()
        if isinstance(data, list):
            if len(data) > 0:
                print(f"Successfully fetched {len(data)} periods of data.")
                return data
            else:
                print(f"Warning: Received empty list from {url}.")
                return None
        elif isinstance(data, dict) and 'Error Message' in data:
             print(f"Error from API at {url}: {data['Error Message']}")
             return None
        else:
            print(f"Warning: Received unexpected data format from {url}. Type: {type(data)}")
            return None
    except requests.exceptions.RequestException as e:
        print(f"Error fetching data from {url}: {e}")
        return None
    except requests.exceptions.JSONDecodeError as e:
        print(f"Error decoding JSON response from {url}: {e}\nResponse text: {response.text}")
        return None
    except Exception as e:
        print(f"An unexpected error occurred while fetching {url}: {e}")
        return None

# --- Main Execution Logic ---
if __name__ == "__main__":
    print(f"\n--- Calculating Debt-to-Equity Ratio for {TICKER} ({LIMIT} Quarters) ---")

    # Construct the URL for the quarterly balance sheet statement
    balance_sheet_url = f"{BASE_URL}/balance-sheet-statement/{TICKER}?period=quarter&limit={LIMIT}&apikey={API_KEY}"

    # Fetch the balance sheet data
    balance_data = get_financial_data(balance_sheet_url)

    if balance_data:
        # Convert the list of dictionaries to a pandas DataFrame
        df = pd.DataFrame(balance_data)
        print(f"\nBalance Sheet DataFrame created with shape: {df.shape}")

        # --- Data Cleaning and Preparation ---
        # Define required columns for Debt-to-Equity ratio
        # Using 'totalDebt' (usually interest-bearing) and 'totalStockholdersEquity'
        required_cols = ['date', 'totalDebt', 'totalStockholdersEquity']
        print(f"Checking for required columns: {required_cols}")

        # Check if all required columns exist
        if not all(col in df.columns for col in required_cols):
            print("Error: DataFrame is missing one or more required columns for D/E calculation.")
            missing = [col for col in required_cols if col not in df.columns]
            print(f"Missing columns: {missing}")
            # Optional: Add logic here to try alternative column names if needed
            df = pd.DataFrame() # Empty the dataframe to prevent further processing
        else:
            print("All required columns found.")
            # Select only necessary columns + identifier columns
            id_cols = ['symbol', 'calendarYear', 'period', 'reportedCurrency', 'cik', 'fillingDate', 'acceptedDate', 'link', 'finalLink']
            cols_to_keep = required_cols + [col for col in id_cols if col in df.columns]
            df = df[cols_to_keep]

            # Convert financial columns to numeric, coercing errors to NaN
            numeric_cols = ['totalDebt', 'totalStockholdersEquity']
            print(f"Converting columns to numeric: {numeric_cols}")
            for col in numeric_cols:
                df[col] = pd.to_numeric(df[col], errors='coerce')

            # Drop rows with NaN values in essential numeric columns
            initial_rows = len(df)
            df.dropna(subset=numeric_cols, inplace=True)
            rows_after_dropna = len(df)
            if initial_rows > rows_after_dropna:
                 print(f"Dropped {initial_rows - rows_after_dropna} rows due to missing numeric data in required columns.")

            # Specifically check for zero or negative equity, as D/E is meaningless/undefined
            invalid_equity_mask = df['totalStockholdersEquity'] <= 0
            if invalid_equity_mask.any():
                print(f"Warning: Found {invalid_equity_mask.sum()} periods with zero or negative equity. Excluding these from D/E calculation.")
                # Keep track of original rows before filtering
                rows_before_equity_filter = len(df)
                df = df[~invalid_equity_mask]
                print(f"Removed {rows_before_equity_filter - len(df)} rows due to invalid equity.")


        # Proceed only if DataFrame is not empty after checks and cleaning
        if not df.empty:
            # Convert 'date' column to datetime objects
            df['date'] = pd.to_datetime(df['date'])
            # Sort DataFrame by date in ascending order (oldest to newest)
            df.sort_values(by='date', ascending=True, inplace=True)

            # --- Calculate Debt-to-Equity Ratio ---
            print("Calculating Debt-to-Equity Ratio (Total Debt / Total Equity)...")
            # Calculation is safe now as we've ensured equity > 0
            df['Debt-to-Equity Ratio'] = df['totalDebt'] / df['totalStockholdersEquity']

            print("\n--- Calculated Debt-to-Equity Ratio (Last 10 Quarters, Valid Equity) ---")
            # Display relevant columns: date and the calculated ratio
            print(df[['date', 'totalDebt', 'totalStockholdersEquity', 'Debt-to-Equity Ratio']].round(2)) # Round for display

            # --- Visualization ---
            print("\n--- Generating Plot ---")
            plt.figure(figsize=(12, 7))

            # Plot Debt-to-Equity Ratio
            plt.plot(df['date'], df['Debt-to-Equity Ratio'], label='Debt-to-Equity Ratio', marker='o', linestyle='-')

            # Add a horizontal line at y=1.0 for reference (Debt = Equity)
            plt.axhline(y=1.0, color='grey', linestyle='--', linewidth=1, label='Reference (Debt = Equity)')
            # You might add other reference lines based on industry norms if known

            # Add titles and labels
            plt.title(f'{TICKER} Quarterly Debt-to-Equity Ratio (Last {len(df)} Quarters)')
            plt.xlabel('Date (Quarter End)')
            plt.ylabel('Debt-to-Equity Ratio')

            # Add legend, grid, and rotate x-axis labels
            plt.legend()
            plt.grid(True, linestyle='--', alpha=0.6)
            plt.xticks(rotation=45, ha='right')

            # Improve layout and display the plot
            plt.tight_layout()
            plt.show()

        else:
             print("\nDataFrame is empty after cleaning or filtering. Cannot calculate or plot D/E ratio.")

    else:
        print("\nFailed to fetch Balance Sheet data. Cannot calculate D/E ratio.")

    print("\n--- Script Finished ---")
Code Explanation: Step-by-Step
- Imports & Config: Imports necessary libraries (
requests,pandas,matplotlib.pyplot,os). Sets up theAPI_KEY(using provided key, but recommend environment variables),TICKER,LIMIT, andBASE_URL. get_financial_data(url)Function: Reuses the robust function to fetch data lists from FMP, handling errors.- Fetch Balance Sheet Data: Constructs the URL for the quarterly
/balance-sheet-statement/endpoint and fetches the data. - Data Processing & Ratio Calculation:
- Check & DataFrame: Verifies data fetch, converts to a
pandasDataFrame. - Column Check: Defines required columns as
date,totalDebt,totalStockholdersEquity(using the API’s field for interest-bearing debt) and verifies their existence. - Column Subsetting: Selects only required and identifier columns to streamline the DataFrame.
- Convert to Numeric: Converts
totalDebtandtotalStockholdersEquityto numbers, handling errors. - Handle Missing Data: Drops rows with
NaNin these key numeric columns. - Handle Invalid Equity: Crucially, it checks for
totalStockholdersEquity <= 0. If found, it prints a warning and filters out these rows using a boolean mask (df = df[~invalid_equity_mask]) because D/E is meaningless in such cases. - Date Conversion & Sorting: Converts
dateto datetime and sorts chronologically. - Calculate Ratio: If the DataFrame still has valid rows, calculates
Debt-to-Equity Ratio = df['totalDebt'] / df['totalStockholdersEquity']. This is safe now due to the prior filtering of non-positive equity. - Display Ratios: Prints the date, the underlying debt and equity values, and the calculated D/E ratio, rounded.
- Check & DataFrame: Verifies data fetch, converts to a
- Visualization:
- Check for Data: Ensures the DataFrame isn’t empty.
- Create Plot: Uses
matplotlib.pyplot:- Plots the calculated
Debt-to-Equity Ratioagainstdate. - Adds a grey dashed horizontal line (
plt.axhline) aty=1.0as a visual reference for when debt equals equity. - Sets title, labels, legend, grid, rotates x-axis labels, and sets y-axis minimum to 0.
- Displays the plot using
plt.tight_layout()andplt.show().
- Plots the calculated
- Error Handling: Includes checks for API failures, missing columns, and the DataFrame becoming empty after necessary cleaning and filtering steps.
Interpreting the Debt-to-Equity Ratio Results
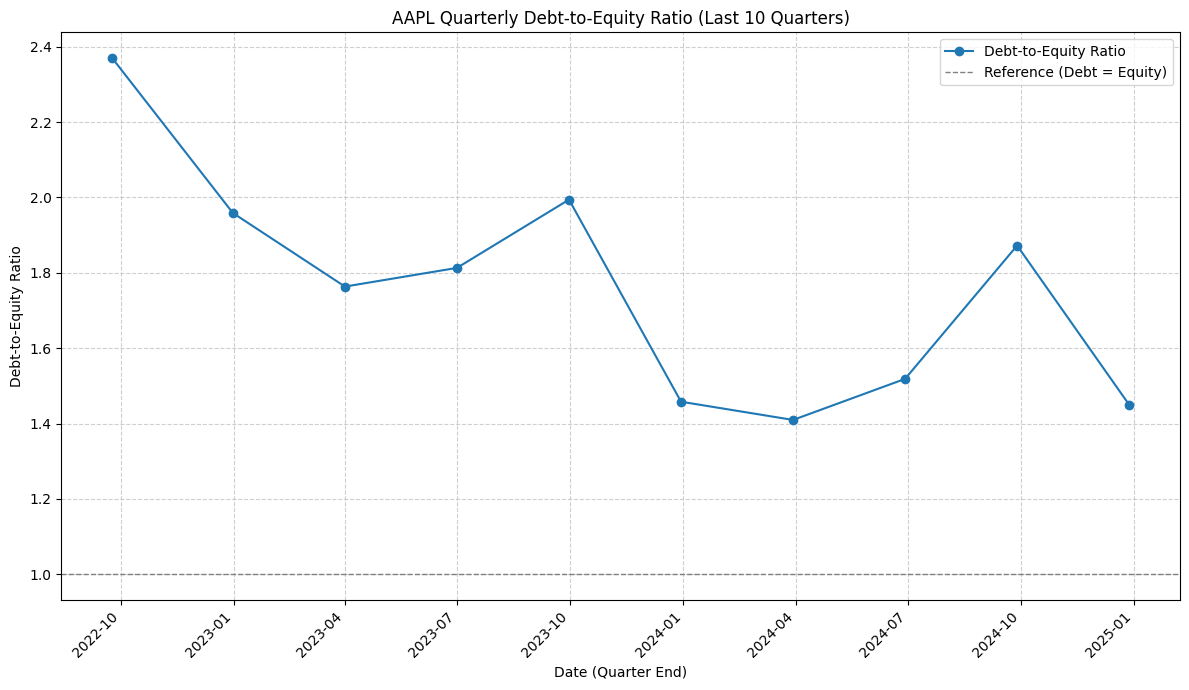
Let’s look at the chart generated by our script for Apple (AAPL), showing the Debt-to-Equity ratio (calculated using Total Debt) over the 10 quarters ending in early 2025:

- Ratio Level vs. Benchmark: The most immediate observation is that Apple’s D/E ratio remained significantly above the 1.0 reference line throughout the entire period. This indicates that, based on the
totalDebtfigure provided by the API, the company consistently employed considerably more debt financing than equity financing over these 10 quarters. The ratio fluctuated between approximately 1.4 and 2.4. - Trend and Volatility: The trend is quite volatile rather than steadily increasing or decreasing. It started at a high point (around 2.38), saw a significant drop into early 2023, climbed again towards late 2023, dropped sharply in early 2024 to its lowest point (~1.4), climbed substantially again by late 2024, and then fell back towards the previous low by early 2025. This volatility could reflect active debt management (issuance or repayment), changes in equity (potentially driven by large share buyback programs reducing equity, thus increasing the D/E ratio, or by retained earnings fluctuations), or a combination of factors.
- Leverage Indication: A D/E ratio consistently above 1.0, and often closer to 1.5-2.0 or even higher, suggests a relatively high degree of leverage compared to the simple benchmark where debt equals equity.
- Crucial Context: Is this high leverage problematic for Apple? Not necessarily. For a company with Apple’s immense profitability, stable cash flows, high credit rating (allowing cheap borrowing), and history of significant share repurchases, a higher D/E ratio might be a deliberate part of its capital structure strategy. Comparing this ratio to direct competitors (other large-cap tech firms) and analyzing Apple’s interest coverage ratio and cash flow relative to its debt obligations would be essential next steps before drawing conclusions about financial risk based solely on this D/E trend.
Takeaway: The visualization clearly shows Apple’s significant reliance on debt relative to equity during this period and the volatility in this ratio. While the levels appear high compared to the 1.0 benchmark, it highlights the absolute necessity of considering industry context, company-specific strategy (like buybacks), and cash flow generating ability when interpreting leverage ratios.
Conclusion: Assessing Financial Structure and Risk
The Debt-to-Equity ratio is a fundamental tool for understanding how a company finances its operations and the level of financial risk it carries. By automating the calculation and visualization using Python, we can efficiently track changes in leverage over time and compare against relevant benchmarks. This analysis provides crucial context when evaluating a company’s overall financial health and investment potential.
We’ve now covered key valuation, profitability, liquidity, and leverage ratios. A logical next step is to explore Efficiency Ratios (like Asset Turnover or Inventory Turnover) to see how well a company utilizes its assets to generate revenue. Stay tuned!
Disclaimer: This blog post is for educational purposes only. Financial data APIs provide data “as is”; always verify critical data from official sources (e.g., SEC filings) before making investment decisions. Ensure compliance with API provider terms of service. this post was drafted with help of AI and reviewed and changed by the author.