Beyond the Initial Shock: Continuing Unemployment Claims Tell the Real Story
Okay, so the check engine light—our initial unemployment claims—is blinking. We pulled the car over in our prior post, and the reading of 247,000 has us, and a lot of economists, looking under the hood with a concerned frown. But that first alert is just that: an alert. It tells you a problem just happened.
To really understand if your engine is about to go kaput, you need to know more. Is it a single misfire or a fundamental problem? That’s where continuing unemployment claims come in. This is the diagnostic report that tells you how long the problem has been going on and whether it’s getting worse.
If initial claims are the trending topic, continuing claims are the deep-dive documentary. They measure the number of people who have already filed for benefits and are still unemployed a week later. And folks, the latest documentary is a bit of a nail-biter.
The Second Chapter of the Story: What 1.9 Million People Are Telling Us
While initial claims give us that real-time jolt, continuing claims, which are reported with a one-week lag, offer a richer, more telling narrative about the labor market’s true health. Think of it this way: a spike in initial claims could mean a single large company had a bad week. But a steady rise in continuing claims? That signals something much more systemic. It means people aren’t just losing jobs; they’re struggling to find new ones.
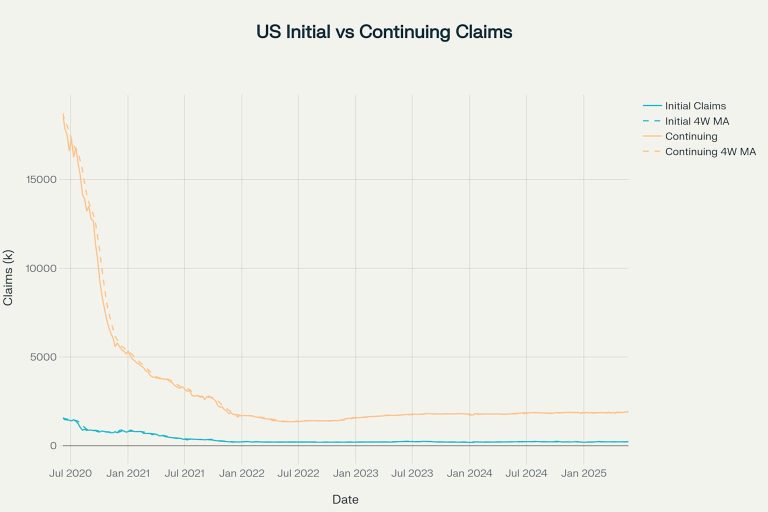
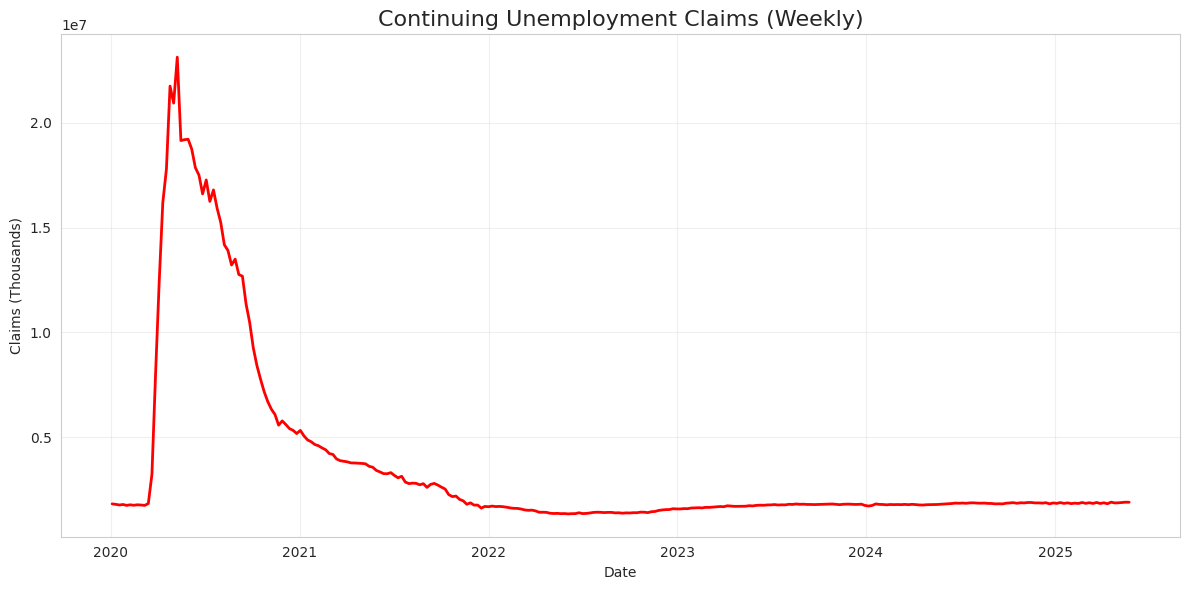
The latest data for the week ending May 24, 2025, shows 1.904 million people are on continued benefits. The four-week moving average, which smooths out the weekly bumps, now sits at a concerning 1.895 million, the highest level we’ve seen since late 2021.
Let’s put this in perspective. A year ago, this figure was hovering around 1.786 million. That’s a 6.1% increase. It tells us that the line of people waiting for a new job is getting longer, and it’s not moving as quickly as it used to. The economic engine isn’t just sputtering; it’s having trouble turning over.
This isn’t a five-alarm fire, but the smoke is getting thicker. It suggests that the “hiring freezes” and “reduced labor demand” the Fed mentioned in its Beige Book aren’t just corporate jargon. They’re translating into longer, more stressful periods of unemployment for a growing number of Americans.
Your Python Dashboard: Tracking the Deeper Trend
Just as we tracked initial claims, we can pull this deeper data directly from the source using Python. The FRED API has a separate series for Continuing Claims (Seasonally Adjusted), and you should absolutely add it to your dashboard. It’s the difference between having a simple speedometer and a full diagnostic system.
Here’s how you can grab and visualize the data:
# Accessing Continuing Unemployment Claims via FRED API
import pandas as pd
import matplotlib.pyplot as plt
import requests

# Get your free API key from: https://fred.stlouisfed.org/docs/api/api_key.html
API_KEY = "YOUR_FRED_API_KEY_HERE"

# Fetch continuing unemployment claims data
url = "https://api.stlouisfed.org/fred/series/observations"
params = {
    'series_id': 'CCSA',  # Continuing Claims Seasonally Adjusted
    'api_key': API_KEY,
    'file_type': 'json',
    'observation_start': '2020-01-01'
}

response = requests.get(url, params=params)
data = response.json()['observations']

# Create DataFrame and plot
df = pd.DataFrame(data)
df['date'] = pd.to_datetime(df['date'])
df['value'] = pd.to_numeric(df['value'], errors='coerce')

# Plotting both Initial and Continuing Claims for comparison
# (Assuming you have the 'ICSA' DataFrame from the previous post)
# For now, we'll just plot Continuing Claims.
plt.figure(figsize=(12, 6))
plt.plot(df['date'], df['value'], linewidth=2, color='red')
plt.title('Continuing Unemployment Claims (Weekly)', fontsize=16)
plt.xlabel('Date')
plt.ylabel('Claims (Thousands)')
plt.grid(True, alpha=0.3)
plt.tight_layout()
plt.show()

When you run this, you’ll see the slow, creeping ascent. It’s less dramatic than the initial claims chart, but in many ways, it’s more important. This is the trend that truly signals a cooling economy. I keep my eyes on the four-week moving average of continuing claims crossing above 1.9 million as a key psychological and technical level. We are right on the doorstep of that now.
Connecting the Dots: What This Means for You
The story that continuing claims tell is one of diminishing economic momentum. That resilience we’ve heard so much about? It’s being tested.
- Fed Policy Pivot: The Federal Reserve pays very close attention to this number. While rising initial claims might make them pause, a sustained increase in continuing claims is what could actually force their hand toward an interest rate cut. It’s a direct measure of labor market slack.
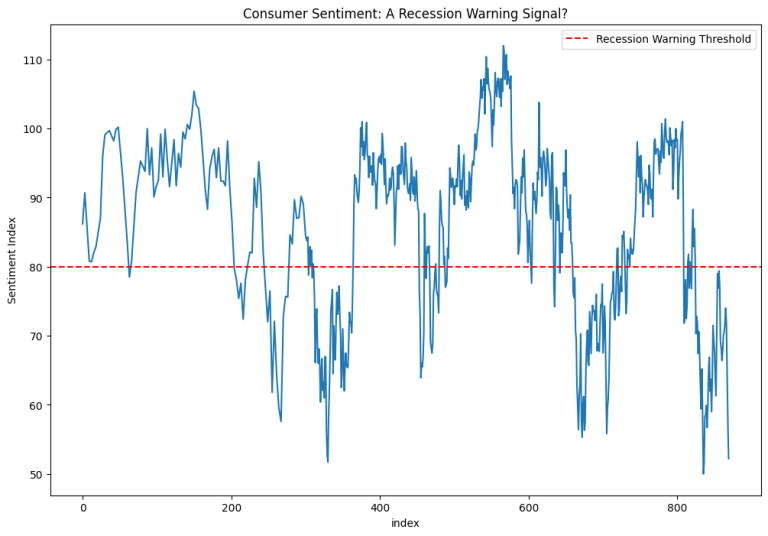
- Consumer Confidence Under Pressure: Nothing saps consumer confidence like watching friends and family stay unemployed for longer periods. This directly impacts consumer spending, which is the lifeblood of the US economy. The longer this number stays elevated, the more likely we are to see a pullback in retail and service-sector spending in the third and fourth quarters.
- A Deeper Look at Sector Health: When continuing claims rise, it’s a sign that skills mismatches may be growing or that entire sectors are slowing down, not just individual companies. This is where you can get really granular, comparing this data with sector-specific job openings to see which industries are struggling to reabsorb laid-off workers.
The Bottom Line: Know Where the Umbrella Is
The initial claims number told us storm clouds were gathering. The continuing claims data tells us the barometric pressure is dropping. It’s time to stop just watching the sky and actually locate your umbrella.
This isn’t a call to panic and sell everything. It’s a call to be smart, prepared, and data-driven. The narrative is shifting from a resilient labor market to a tired one. By tracking both initial and continuing claims, you get the full story—the shock and the aftermath. Set up your scripts, watch the trends, and don’t get caught in the rain without a coat.
The post is for informational purposes only and does not constitute financial advice. You should not construe any such information or other material as legal, tax, investment, financial, or other advice.