
3. Banking 101: How Banks Operate and Mastering the Income Statement
Banks are the centerpiece of the financial system. Their fundamental business model is elegantly simple yet profoundly powerful: borrow money at a low rate and lend it out at a higher rate. This is often summarized as “Borrow short, lend long.”
To analyze a bank as an investor, you must understand its income statement, which is structured fundamentally differently from a typical company. Where Apple generates revenue by selling iPhones and Tesla by selling cars, banks generate revenue primarily through the art of financial intermediation—transforming deposits into loans and capturing the spread.
This article will equip you with the framework to analyse any bank’s income statement, identify the key drivers of profitability, and spot warning signs before they become disasters.
The Core Business Model: The Spread
At its essence, banking is about managing the spread between the cost of funds and the return on assets.
1. Liabilities (Borrowing Short)
Banks gather funds primarily through deposits, which represent the bank’s “raw material.” These come in several forms:
Demand Deposits (Checking Accounts): Non-interest or low-interest accounts that customers can access immediately. These are the cheapest funding source for banks because customers value the convenience and liquidity.
Savings and Money Market Accounts: Pay modest interest rates but offer immediate access. Rates adjust with market conditions but remain below loan rates.
Certificates of Deposit (CDs): Time deposits with fixed terms (3 months to 5 years) that pay higher rates. These provide more stable funding but at a higher cost.
Borrowed Funds: When deposit growth is insufficient, banks borrow from other sources including the Federal Reserve, other banks, or capital markets through debt issuance.
Critical Concept: Deposits are liabilities because the bank owes this money to depositors. The bank’s obligation is to return funds on demand (for checking/savings) or at maturity (for CDs).
2. Assets (Lending Long)
Banks deploy these funds into earning assets that generate returns:
Commercial and Industrial Loans (C&I): Loans to businesses for operations, equipment, and expansion. These typically carry moderate risk and offer competitive interest rates.
Commercial Real Estate (CRE): Loans secured by commercial properties like office buildings, retail centers, and apartment complexes. These are longer-term and can be riskier during economic downturns.
Residential Mortgages: Home loans that are typically 15 to 30 years in duration. These are generally lower risk due to collateral and government backing (for conforming loans).
Consumer Loans: Auto loans, credit cards, personal loans, and student loans. Credit cards carry the highest interest rates but also the highest default risk.
Securities Portfolio: Banks also invest in government bonds, mortgage-backed securities, and corporate bonds. These provide liquidity and diversification while generating interest income.
The Maturity Mismatch Strategy
The “borrow short, lend long” strategy creates profit but also introduces risk. When depositors want their money back (short-term liability), the bank’s loans may not be due for years (long-term asset). This maturity mismatch is managed through by having Diversified Deposit Base (i): Relying on thousands or millions of depositors so that withdrawals are predictable and stable. Having Liquidity Reserves on hand (ii), for example, by holding cash and easily sellable securities. Being able to access to Wholesale Funding (iii) by using credit lines from other institutions for emergency liquidity.
And the Federal Reserve Discount Window (iiii) as last-resort borrowing facility. The Discount Window is a standing lending facility where commercial banks and other depository institutions can obtain short-term loans, often overnight, directly from the Federal Reserve. The “last-resort” nature of this facility stems from its pricing. The interest rate charged on these loans, known as the discount rate, is typically set higher than the federal funds rate, which is the interest rate at which banks lend to each other. This pricing structure incentivizes banks to first seek funding from other private lenders in the federal funds market. Only when they are unable to secure credit from other banks will they turn to the Discount Window.
Historical Warning: The 2023 Silicon Valley Bank collapse illustrated the dangers of poor asset-liability management. SVB held long-duration bonds that lost value when interest rates rose rapidly, while depositors withdrew funds en masse, forcing the bank to realize massive losses.
Decoding the Bank Income Statement: A Line-by-Line Guide
Unlike a manufacturing company that shows Revenue → Cost of Goods Sold → Gross Profit, a bank’s income statement follows a unique structure. Let’s walk through each component with precision.
1. Interest Income
This is the top line: total revenue earned from all interest-bearing assets.
- Interest on loans (residential mortgages, commercial loans, consumer loans)
- Interest on investment securities (bonds, mortgage-backed securities)
- Interest on federal funds sold and other short-term investments
Analysis Tip: Look at the breakdown by loan category. If a bank is heavily concentrated in one loan type (e.g., commercial real estate), it faces higher concentration risk. Diversification across loan types generally reduces volatility.
2. Interest Expense
The cost of funding the bank’s operations.
Components:
- Interest on deposits (savings accounts, CDs, money market accounts)
- Interest on borrowed funds (Federal Home Loan Bank advances, repurchase agreements)
- Interest on long-term debt (subordinated debt, senior notes)
Analysis Tip: Track the deposit mix. Banks with higher percentages of non-interest or low-interest checking accounts have a structural cost advantage. This is why banks aggressively market checking accounts—they’re the cheapest funding source.
3. Net Interest Income (NII)
Formula: Interest Income – Interest Expense = Net Interest Income
This is the core earnings engine of any bank. NII represents the profit from the fundamental banking activity of borrowing and lending. For most traditional banks, NII accounts for 60-70% of total revenue.
Investor Insight: NII trends tell you whether the bank’s core business is growing or shrinking. Consistent NII growth signals a healthy, expanding loan portfolio and effective deposit gathering. Declining NII may indicate competitive pressure, asset quality problems, or challenging interest rate environments.
The Key Metric: Net Interest Margin (NIM)
NIM is the profitability metric specific to banking. It measures how efficiently a bank converts its earning assets into interest income.
Formula: NIM = Net Interest Income / Average Earning Assets. Some of the Typical NIM Ranges are stated below:
- Large Diversified Banks: 2.5% to 3.5%
- Regional Banks: 3.0% to 4.0%
- Community Banks: 3.5% to 4.5%
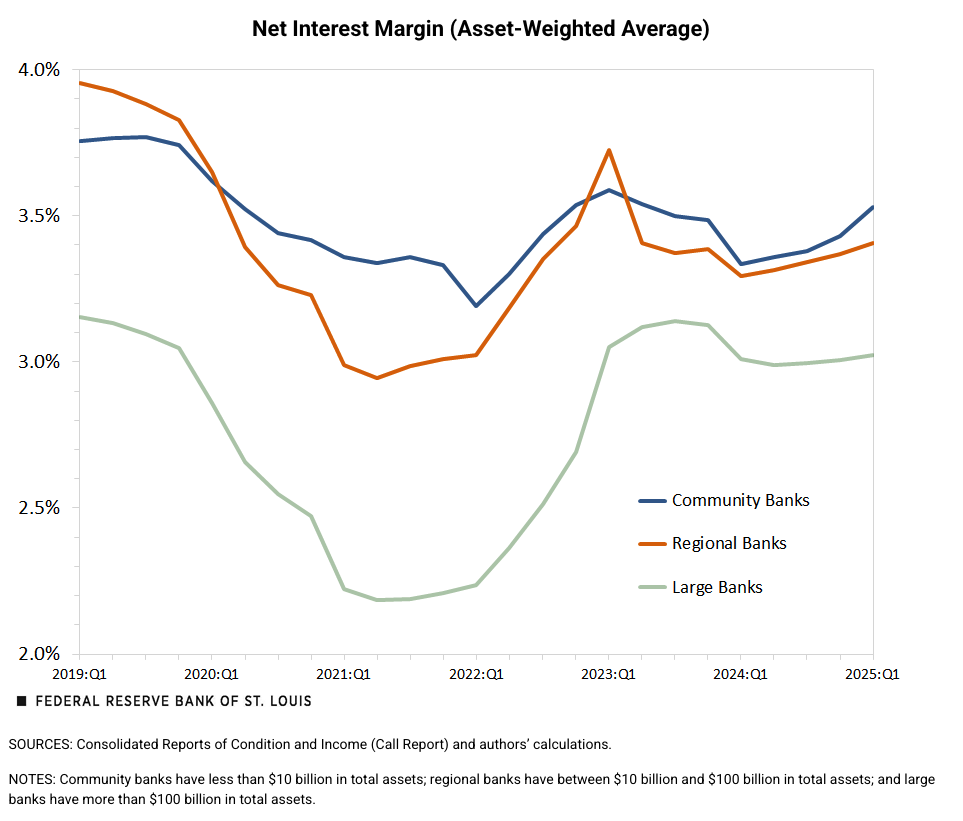
Larger banks often have more non-interest income sources and can operate with lower NIMs. Smaller banks typically have higher NIMs because they make relationship-based loans with limited competition. Banks with more consumer loans (credit cards, auto loans) tend to have higher NIMs than those focused on commercial lending
Banks operating in less competitive markets can charge higher rates on loans. On the other hand, banks with strong brands and convenient branch networks can pay less for deposits. Asset Mix also plays a role, Higher-yielding assets (credit cards, small business loans) boost NIM but carry more risk.
Watch out on theInterest Rate Environment: NIM behavior varies dramatically with rate changes—we’ll explore this in detail below.
NIM and the Interest Rate Environment
The relationship between interest rates and NIM is dependent on the bank’s balance sheet structure.
Rising Rate Scenario:
An asset-sensitive bank (higher number of Variable-Rate Assets) is one that stands to benefit from a rising interest rate environment. This advantage stems from a specific structure of its balance sheet: its assets, primarily loans, reprice or see their interest rates adjust upwards more quickly than its liabilities, such as customer deposits. These banks benefit immediately as loan rates reset higher while deposit costs increase more slowly. NIM expands.
On the other side, liability-Sensitive Banks (higher number of Variable-Rate Liabilities): These banks face immediate funding cost increases while loan income adjusts slowly. NIM compresses.
Falling Rate Scenario:
- Asset-Sensitive Banks: Suffer as loan yields fall faster than funding costs. NIM compresses.
- Liability-Sensitive Banks: Benefit as funding costs decline quickly. NIM expands.
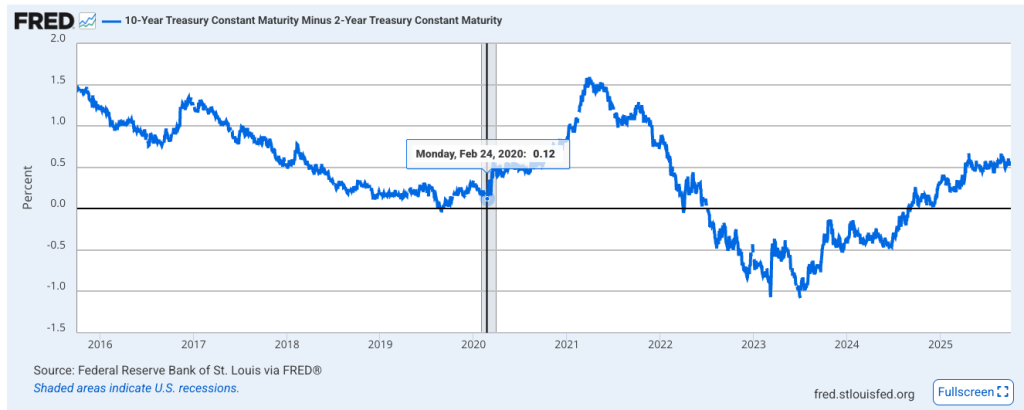
The Yield Curve Effect: Banks typically borrow short-term (deposits) and lend long-term (mortgages, loans). A steep yield curve (large spread between short and long rates) is ideal for traditional banking. A flat or inverted yield curve squeezes margins and can signal economic trouble ahead.
See below example. The FRED graph shows the difference (or “spread”) between the 10-year Treasury yield and the 2-year Treasury yield. This spread is a key indicator of the yield curve’s shape
- When the blue line is below 0: The yield curve is “inverted.” Short-term rates are higher than long-term rates.
- When the blue line is above 0: The yield curve is “normal” or “steep.” Long-term rates are higher than short-term rates.
- When the blue line is at or near 0: The yield curve is “flat.” There’s little difference between long-term and short-term rates.
2019-2020 Case Study: When the Federal Reserve cut rates to near zero in 2020, many banks saw NIM compression to historic lows (below 2.5% for some large banks). The “lower for longer” rate environment reduced profitability significantly.
2022-2024 Case Study: As the Fed raised rates aggressively to combat inflation, banks with asset-sensitive balance sheets saw NIM expansion, while those caught with long-duration, low-yielding assets (like SVB) faced severe pressure. As the curve inverted, banks faced a situation where the cost of their short-term borrowing (like high-yield savings accounts or CDs) was higher than the rates they could earn on new long-term loans. This severely compressed their NIM. For every new long-term loan they made, the potential profit was minimal or even negative.
Beyond the Spread: Non-Interest Income
Modern banking extends far beyond traditional lending. Non-interest income provides diversification and often higher margins than lending activities.
Components of Non-Interest Income
Service Charges and Fees such as Overdraft fees, monthly account maintenance fees, ATM fees and wire transfer charges. Investor Note: These fees are under increasing regulatory scrutiny and consumer pressure. Many banks have reduced or eliminated certain fees, impacting this income source.
Wealth Management and Trust Fees including investment advisory fees, asset management fees, trust administration fees and retirement plan services. Growth Driver: This is a high-margin, sticky revenue stream. Banks with strong wealth management operations (like U.S. Bancorp or JPMorgan’s private bank) command premium valuations.
Investment Banking Revenue is mostly for larger banks. They make money by underwriting fees for debt and equity offerings, merger and acquisition advisory fees and syndication fees. Volatility Factor: This income is highly cyclical, surging during economic booms and M&A cycles, then collapsing during recessions.
Trading Revenue including market making in securities, proprietary trading (limited post-Dodd-Frank) and client trading facilitation. Risk Element: Trading revenue can be volatile and occasionally results in significant losses. The 2012 JPMorgan “London Whale” trading loss of over $6 billion exemplifies this risk.
Mortgage Banking Revenue includes Origination fees, servicing fees and gains on sale of mortgages to secondary market. Cyclicality: Highly sensitive to mortgage origination volumes, which spike when rates fall (refinancing boom) and crater when rates rise.
Card Processing Fees are Interchange fees from debit and credit card transactions and processing income. Stable Income: This grows with transaction volumes and is relatively stable through economic cycles.
The Revenue Mix: Banking Models
Traditional Community Bank:
- Net Interest Income: 80-85%
- Non-Interest Income: 15-20%
Diversified Regional Bank:
- Net Interest Income: 65-70%
- Non-Interest Income: 30-35%
Universal Bank (e.g., JPMorgan, Bank of America):
- Net Interest Income: 50-55%
- Non-Interest Income: 45-50%
Investor Implication: Banks with higher non-interest income are less sensitive to interest rate fluctuations but may face more earnings volatility from market-dependent revenue sources.
Operating Expenses: The Cost Side
Non-Interest Expense
Personnel Costs (Largest Component). Including salaries and benefits typically represent 50-60% of total non-interest expense. These are particular high for labor-intensive retail banking operations and lower for technology-driven or wholesale banking operations
Occupancy and Equipment including Rent, utilities, depreciation on buildings and technology infrastructure costs (increasingly significant)
Technology and Data Processing is also key part of the bank operations. It includes core banking systems, cybersecurity investments and any digital banking platforms that the bank offer
Marketing and Business Development:Advertising campaigns, customer acquisition cost, and sponsorships and community relations
Professional Fees incurred by the bank such as legal expenses, audit and accounting fees and consulting costs
FDIC Insurance Premiums this costs borne by the bank are mandatory insurance paid to the Federal Deposit Insurance Corporation. Rates vary based on bank size and risk profile
Other Operating Expenses:
- Fraud losses
- Litigation costs
- Regulatory compliance expenses
The Efficiency Ratio: Measuring Operational Excellence
This is the banking industry’s primary cost control metric. The ratio measures what percentage of revenue is consumed by operating expenses. Lower is better.
Efficiency Ratio = Non-Interest Expense / (Net Interest Income + Non-Interest Income)
Non-Interest Expense: $15 billion
Net Interest Income: $20 billion
Non-Interest Income: $10 billion
Total Revenue: $30 billion

Efficiency Ratio = $15B / $30B = 50%
This means the bank spends 50 cents to generate every dollar of revenue.
Efficiency Ratio Benchmarks
Excellent: Below 50% such as JPMorgan Chase (54-58%),
Good: 50-60% Most well-managed regional and large banks
Average: 60-70% Typical for community banks and banks with extensive branch networks
Concerning: Above 70% May indicate operational challenges, excessive costs, or revenue headwinds
Why Efficiency Ratios Vary
Efficiency ratios may vary due to Scale Advantages (i): Larger banks spread technology and compliance costs over broader revenue bases. Business Mix (ii): Wealth management and investment banking have lower efficiency ratios than branch-heavy retail banking. Geographic Footprint (iii): Banks in expensive metro areas (New York, San Francisco) face higher occupancy costs. Technology Investment (iiii): Banks investing heavily in digital transformation may temporarily see elevated expense ratios that pay off long-term. Regulatory Burden (iiiii): Smaller banks face disproportionate compliance costs relative to their size.
Cost Control as Competitive Advantage
Banks that consistently maintain efficiency ratios below 60% typically achieve this through:
- Technology Leverage: Banks increasingly automate routine processes, accelerate digital customer acquisition, and utilize AI-driven operations. This reduces manual intervention, cuts labor costs, and speeds up service delivery.
- Branch Optimization: Many banks are closing underperforming branches and adopting smaller “express” branch formats focused on transactional convenience. This shifts customer engagement largely to digital channels, lowering physical footprint costs.
- Centralization: Back-office functions like loan processing, compliance, and settlements are being consolidated into fewer, lower-cost centers. Centralization improves scale economies and consistency while reducing overhead.
- Revenue Growth: Improving efficiency ratios requires growing the revenue denominator faster than expenses. This can come from expanded product offerings, enhanced pricing strategies, and cross-selling in wealth management or payments.
- Disciplined Expense Management: Banks employ zero-based budgeting, active vendor negotiations, and continuous process improvement methodologies to systematically identify and cut unnecessary costs.
- Investor Action Item: Efficiency ratio comparisons among peer banks offer investors a clear window into management execution. Banks consistently outperforming peers on this metric typically demonstrate operational excellence, resulting in stronger return on equity (ROE) and higher equity valuations.
The Crucial Line Item: Provision for Credit Losses (PCL)
This is where banking analysis becomes most critical and most complex. The PCL represents management’s estimate of loans that will not be repaid.
Understanding Loan Loss Accounting
Current Expected Credit Loss (CECL) Model: Effective since 2020, CECL requires banks to estimate lifetime expected losses on loans at origination, rather than waiting for losses to become “probable.” This results in earlier recognition of potential losses.
The Reserve Process:
- Banks maintain an Allowance for Credit Losses (ACL) on the balance sheet
- Each quarter, they assess expected losses across the loan portfolio
- They record a Provision for Credit Losses as an expense on the income statement
- This provision replenishes or increases the allowance
- When loans actually default, they are charged off against the allowance
PCL as an Earnings Lever and Warning Signal
Economic Downturn:
- Banks dramatically increase provisions as unemployment rises and borrowers struggle
- PCL can exceed 1% of loans, potentially eliminating all earnings
- Example: During the 2008-2009 financial crisis, major banks recorded provisions exceeding $30-40 billion annually
Economic Recovery:
- If actual charge-offs are lower than expected, banks can reduce provisions or even release reserves
- Reserve releases (negative PCL) boost earnings
- This was common in 2013-2019 as credit quality improved after the financial crisis
COVID-19 Case Study: In Q1-Q2 2020, banks massively increased provisions in anticipation of pandemic-driven defaults. For instance, JPMorgan added around $20+ billion in provisions across 2020. However, government stimulus and mortgage forbearance programs resulted in lower-than-expected losses. By 2021-2022, many banks released reserves, boosting earnings.
Analyzing PCL for Investment Decisions
Provision as a Percentage of Loans: Track this ratio over time. A sharp increase signals:
- Deteriorating economic conditions
- Loosening lending standards catching up with reality
- Concentration in troubled loan categories
Coverage Ratio (Allowance / Total Loans): Measures the buffer available to absorb losses.
- Higher ratios indicate more conservative reserving
- Typical range: 1.0% to 2.0% for healthy banks
- During crises, may exceed 3%
Net Charge-Offs: Actual losses realized during the quarter. Compare to provisions:
- Provisions > Charge-offs: Building reserves (conservative)
- Provisions < Charge-offs: Drawing down reserves (may signal inadequate reserving)
Loan Mix Analysis: Different loan types carry different loss rates:
- Credit cards: 2-4% loss rates in normal times, higher in recessions
- Consumer loans: 1-2% loss rates
- Commercial real estate: 0.5-1% in normal times, can spike to 5%+ in downturns
- Residential mortgages: 0.1-0.5% for prime loans
- Commercial & industrial: 0.5-1.5% in normal conditions
Red Flag: A bank with provision levels dramatically lower than peers may be understating risk or practicing aggressive accounting. This often precedes earnings disappointments.
The Complete Income Statement Journey
Let’s trace the full path from top line to bottom line:
Pre-Provision Net Revenue (PPNR)
This critical metric represents earnings power before credit losses:
Formula: PPNR = Net Interest Income + Non-Interest Income – Non-Interest Expense
PPNR shows how profitable the bank’s operations are before accounting for loan losses. Strong PPNR growth indicates that the bank is successfully generating revenue and is able to manage effectively its costs. Fundamental earnings power that can absorb credit losses
Investor Use: PPNR is especially useful for stress testing. How much in credit losses can the bank absorb while remaining profitable?
Pre-Tax Income
Formula: Pre-Tax Income = PPNR – Provision for Credit Losses. This is profit before taxes. Large provisions during downturns can turn positive PPNR into negative pre-tax income (losses).
Income Tax Expense
Banks pay federal and state corporate income taxes. The 2017 Tax Cuts and Jobs Act reduced the federal corporate rate from 35% to 21%, boosting bank earnings significantly. Effective Tax Rate: Actual taxes paid / Pre-tax income. Typically 21-25% for large banks.
Net Income
The bottom line: profit available to shareholders. Formula: Net Income = Pre-Tax Income – Income Tax Expense
Per Share Metrics
Earnings Per Share (EPS): Net Income / Shares Outstanding. This is the most widely followed metric. Analysts forecast quarterly EPS, and beating or missing these expectations drives stock prices.
Book Value Per Share (BVPS): Total Equity / Shares Outstanding. Important for bank valuation. Banks often trade at 1.0x to 2.0x book value, depending on profitability and growth prospects.
Tangible Book Value Per Share (TBVPS): (Total Equity – Intangible Assets) / Shares Outstanding. Many investors prefer this metric as it excludes goodwill from acquisitions.
Profitability Metrics: Return Ratios
Return on Assets (ROA)
Formula: ROA = Net Income / Average Total Assets. Measures how efficiently the bank uses its assets to generate profit. The higher the ROA the better. Banks are highly leveraged, so even small improvements in ROA translate to significant equity returns. A bank with 1.2% ROA and 10:1 leverage generates 12% ROE.
Return on Equity (ROE)
Formula: ROE = Net Income / Average Shareholders’ Equity. This measures returns to equity investors and is the ultimate profitability metric. With the DuPont Decomposition we can break down ROE into components:
ROE = (Net Income / Revenue) × (Revenue / Assets) × (Assets / Equity)
This becomes: ROE = Profit Margin × Asset Turnover × Equity Multiplier
Or for banks: ROE = ROA × Equity Multiplier. Where Equity Multiplier = Assets / Equity (the leverage ratio). Investor Insight: Banks can achieve high ROE through either strong ROA (operational excellence) or high leverage (financial engineering). The former is sustainable; the latter is risky. The 2008 financial crisis demonstrated the dangers of excessive leverage.
Comparative Bank Analysis: Peer Benchmarking
To truly understand a bank’s performance, compare it to peers:
Select Appropriate Peers
By Size:
- Money center banks: JPMorgan, Bank of America, Citi
- Super-regional banks: U.S. Bancorp, PNC, Truist
- Regional banks: Fifth Third, KeyCorp, Regions Financial
- Community banks: Banks with assets under $10 billion
By Business Model:
- Universal banks with diversified revenue
- Commercial banks focused on business lending
- Consumer banks focused on retail products
- Specialty banks (credit card, mortgage, etc.)
Key Comparative Metrics
Create a comparison table. Below is using made up numbers to show an example:
| Metric | Bank A | Bank B | Industry Avg |
|---|---|---|---|
| NIM | 3.2% | 2.8% | 3.0% |
| Efficiency Ratio | 58% | 63% | 62% |
| ROA | 1.1% | 0.9% | 1.0% |
| ROE | 12% | 10% | 11% |
| Tier 1 Capital Ratio | 11.5% | 10.2% | 10.8% |
Analysis: Bank A outperforms on all metrics, suggesting superior management and competitive positioning. This would typically command a valuation premium.
Real-World Example: Dissecting JPMorgan Chase’s Income Statement
This analysis dissects JPMorgan Chase’s (JPM) income statement using the actual numbers from its latest financial filing, the Second Quarter 2025 (Q2 2025) earnings report, released on July 15, 2025.
JPMorgan Chase reports results on both a Reported (GAAP) basis and a Managed (non-GAAP) basis.
1. Interest Income and Expense
- Interest Income (Reported): $48 billion
- Loans: $23.0 billion
- Securities (Investment and Trading Assets): $6.9 billion
- Other (e.g., Deposits with banks, Resale agreements): $9 billion
- Interest Expense (Reported): $25 billion
- Deposits: $11.4 billion
- Long-term debt and other borrowed funds: $4.4 billion
- Other (e.g., Repurchase agreements, Trading liabilities): $9 billion
Net Interest Income (Managed): $23.3 billion
- Average Earning Assets: $3.84 trillion (Investment securities 0.75T + Loans 1.4T)
- Net Interest Margin (NIM) = 2.43%
NIM (tax-equivalent, annualized) = (NII × 4) / AIEA
= (23,3 × 4) / 3,845,982
= 0.02425 ≈ 2.43% (see caption Net interest income and net yield on interest-earning assets in the Q2 earnings=
Analysis: Net Interest Income increased 2% year-over-year. The NIM of 2.43% is robust for a bank of this scale and complexity. It reflects the benefits of the current interest rate environment balanced against the costs of funding JPM’s diversified balance sheet.
2. Non-Interest Income
Non-Interest Income (Managed): $21.7 billion (Breakdown based on Reported figures)
- Principal transactions (Markets/Trading Revenue): $7.1 billion
- Asset management, administration and commissions: $7 billion
- Card income: $1.3 billion
- Investment banking fees: $2.5 billion
- Lending- and deposit-related fees: $2.2 billion
- Other (incl. Mortgage fees, Securities gains): $1.1 billion
Analysis: Non-Interest Income decreased by 21% YoY. However, this comparison is heavily skewed because Q2 2024 included a significant, one-time $7.9 billion net gain related to Visa shares. Excluding this anomaly, the core performance was strong, highlighted by a 15% increase in Markets revenue and solid performance in Asset & Wealth Management.
Total Managed Revenue: $44.9 billion (NII + Non-Interest Income)
3. Non-Interest Expense
Non-Interest Expense: $23.8 billion (Breakdown based on Reported figures)
- Compensation expense: $13.7 billion
- Technology, communications and equipment: $2.7 billion
- Professional and outside services: $3.0 billion
- Marketing: $1.2 billion
- Occupancy: $1.2 billion
- Other expense: $1.8 billion
- Efficiency Ratio: 53% ($23.8B / $44.9B)
Analysis: An efficiency ratio of 53% is excellent, demonstrating superior operational efficiency and cost discipline for a global universal bank. Expenses were relatively flat year-over-year, but excluding certain items in the prior year (such as a large charitable contribution), expenses rose approximately 5%, reflecting continued strategic investments in technology and talent.
4. Pre-Tax Income and Provisions
- Pre-Provision Net Revenue (PPNR): $21.19 billion
- Provision for Credit Losses: $2.8 billion
Analysis: Credit costs (provision) were $2.8B, -7% YoY. They included $2.4B in net charge-offs—$2.1B in consumer, mainly Card Services—and a modest net reserve build of ~$0.4B
- Pre-Tax Income: $19.1 billion
- Income Tax Expense: $4.1 billion
- Net Income: $15.0 billion
(Note: Net Income included a significant $774 million income tax benefit. Excluding this item, adjusted Net Income was $14.2 billion).
5. Key Profitability Metrics
- Return on Assets (ROA): 1.35% (on $4.46T average assets)
- Return on Equity (ROE): 18% (on $337B average common equity)
- Return on Tangible Common Equity (ROTCE): 21%
JPMorgan Chase delivered robust results in Q2 2025, showcasing the strength of its diversified franchise. Despite the headline revenue decline (attributable to the prior year’s exceptional Visa gain), the underlying business performance was strong across key segments, notably in Markets and Asset & Wealth Management.
The bank continues to operate with exceptional efficiency, maintaining a low 53% ratio while investing heavily in future growth. The profitability metrics are superior, with the 21% ROTCE highlighting significant shareholder value creation. Furthermore, the stable credit environment and the maintenance of a “fortress balance sheet” (characterized by a strong 15.0% CET1 capital ratio) position JPMorgan well to navigate macroeconomic uncertainties
Common Pitfalls in Bank Analysis
Mistaking Reserve Releases for Operating Performance
When banks release reserves (negative provisions), it boosts earnings but isn’t repeatable. Always distinguish between: Core earnings (PPNR) and One-time items (reserve releases, asset sales).
Ignoring Asset Quality Trends
Don’t just look at current provisions. Review as well Non-performing loans (NPLs) as % of total loans. Look at the trend in criticized and classified loans and charge-off rates by loan category
Overlooking Interest Rate Risk
Different banks have radically different interest rate sensitivities. Read the interest rate risk disclosure in the 10-K to understand:
- Asset sensitivity or liability sensitivity
- Projected NII changes under rate scenarios
- Duration of asset and liability portfolios
Focusing Solely on Quarterly EPS
Banking is cyclical. A single quarter’s earnings can be distorted by, seasonal patterns (Q4 may be weaker), One-time items and level of provision volatility. Look at trailing twelve-month earnings and multi-year trends.
Neglecting Capital Adequacy
A highly profitable bank with inadequate capital is risky. Monitor:
- Common Equity Tier 1 (CET1) ratio
- Total capital ratio
- Leverage ratio
Regulatory minimums exist, but well-capitalized banks maintain buffers above these thresholds.
Tying It All Together: The Investor’s Checklist
When analyzing a bank’s income statement, systematically evaluate:
✓ Net Interest Margin Trends
- Is NIM expanding, stable, or contracting?
- How does it compare to peers?
- What’s driving the trend?
✓ Revenue Diversification
- What percentage comes from NII vs. non-interest income?
- Is non-interest income growing and stable?
✓ Efficiency Ratio
- Is the bank improving operational efficiency?
- How does it compare to peer median?
✓ Provision for Credit Losses
- Are provisions trending up or down?
- How do they compare to charge-offs?
- Is the allowance adequate?
✓ Profitability Metrics
- ROA and ROE trends
- Comparison to peer group
- Sustainability of returns
✓ Management Quality
- Track record of consistent performance
- Communication clarity and transparency
- Strategic vision articulation