Primer on the U.S. Pharmaceuticals Sector: Foundation for Analysis
The Pharmaceuticals sector (GICS 352020) remains a cornerstone of the global health economy and a significant component of equity indices.
This primer delivers a comprehensive analysis of the sector’s structure and key drivers.
It dissects the pharmaceutical value chain, from high-risk R&D characterized by significant attrition, to complex manufacturing and the convoluted U.S. pricing ecosystem.
Core economic sensitivities are explored, emphasizing the critical importance of patent exclusivity, the dynamics of the “gross-to-net bubble,” and the profound impact of the U.S. Inflation Reduction Act (IRA) on future pricing power.
The primer details regulatory pathways (FDA/EMA), strategies for managing Loss of Exclusivity (LOE), and the competitive landscapes across major therapeutic areas, including the transformative impact of GLP-1 agonists and innovations in oncology. Crucially, it provides a detailed playbook for valuation, focusing on the methodology and pitfalls of risk-adjusted Net Present Value (rNPV) analysis.
By integrating regulatory calendars, key data series, and case studies, this primer equips analysts with the necessary tools to perform rigorous, sourced due diligence on pharmaceutical equities.
1) Introduction to Pharmaceuticals
The pharmaceuticals sector is the segment of the healthcare industry focused on the discovery, development, manufacturing, and commercialization of chemical (small molecule) and biological (large molecule) substances intended for use as human therapeutics.1 It is a high-risk, high-reward industry characterized by intensive capital investment, long development timelines, stringent regulatory oversight, and reliance on intellectual property (IP) protection.
1.1 Role in the health-economy stack
The pharmaceutical industry operates within a complex, multi-stakeholder value chain. Understanding the flow of product, data, and capital is essential for financial analysis.
- Discovery and Preclinical Research: This initial phase involves identifying biological targets (e.g., enzymes, receptors) implicated in a disease and screening compounds (libraries of small molecules or potential biologics) for activity against these targets. This phase is increasingly driven by genomics, proteomics, and computational biology, often involving collaborations between large pharmaceutical firms, biotechnology companies, and academic institutions.
- Clinical Development (Phases I-III): If a compound shows promise and safety in preclinical (animal) studies, it progresses to human clinical trials. This structured process (detailed in Section 2.1) assesses safety, dosing, and efficacy in progressively larger patient populations. This phase represents the largest portion of R&D expenditure and the highest risk of failure.
- Regulatory Review and Approval: Following successful Phase III trials, the sponsor submits a New Drug Application (NDA) or Biologics License Application (BLA) to regulatory bodies such as the U.S. Food and Drug Administration (FDA) or the European Medicines Agency (EMA).2 Approval grants the sponsor marketing authorization.
- Manufacturing and Supply Chain (CMC): Chemistry, Manufacturing, and Controls (CMC) is critical throughout development and post-approval. Manufacturing small molecules involves chemical synthesis, while biologics require complex bioprocessing using living cell systems. The industry requires highly specialized facilities, strict adherence to Good Manufacturing Practices (GMP), and robust, serialized supply chains to ensure quality and prevent counterfeiting.
- Commercialization, Distribution, and Market Access: Once approved, the focus shifts to market access (securing favorable pricing and reimbursement from payors) and marketing (educating physicians and patients).
- Distribution: Drugs typically flow from the manufacturer to wholesalers (e.g., McKesson, Cencora, Cardinal Health), who then distribute them to pharmacies, hospitals, and clinics.
- Payors: These entities finance or reimburse the cost of drugs (e.g., commercial insurers, Medicare, Medicaid in the U.S.; national health services in the EU/Japan).3
- Pharmacy Benefit Managers (PBMs): In the U.S., PBMs act as intermediaries between insurers and manufacturers, negotiating prices (rebates), managing formularies, and processing claims.
- Patients and Providers: The end-users are patients, who access drugs prescribed by healthcare providers (physicians, specialists). Adherence to therapy and real-world outcomes are tracked during this phase (Phase IV/Post-Marketing Surveillance).
Exhibit 1.1: Simplified Pharmaceutical Value Chain and U.S. Payer Flow
Caption: The U.S. system involves a complex flow of funds, where list prices (WAC) are set by manufacturers, but net prices are determined by rebates negotiated by PBMs and paid retrospectively to payors, creating a significant “gross-to-net” gap.4
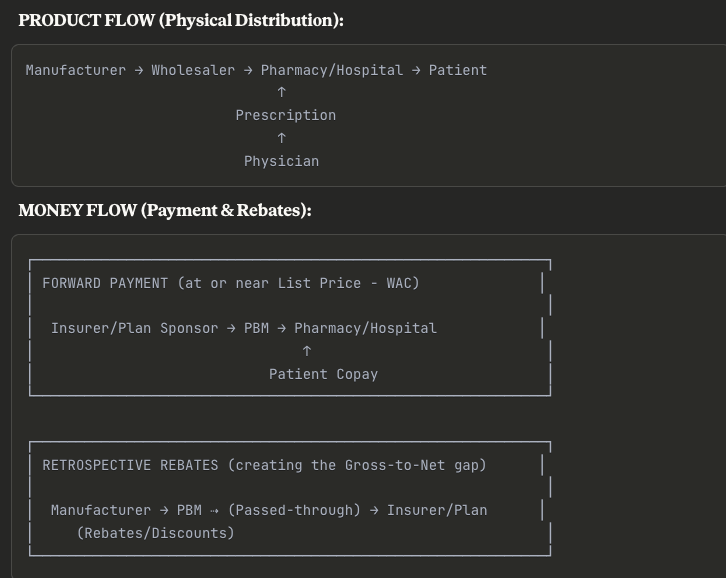
Key Insight: The complexity here is intentional. The drug physically moves in one direction at “list price,” but money flows back through rebates months later. This creates the infamous gross-to-net bubble—manufacturers report high WAC revenues initially, but their actual realized revenue is 40-60% lower after all rebates clear.
For analysts, this means you can’t simply multiply volume × WAC to forecast revenue. You need to model the entire rebate stack.
1.2 GICS taxonomy
The Global Industry Classification Standard (GICS), maintained by MSCI and S&P Dow Jones Indices, provides the hierarchical framework used for sector analysis [MSCI, GLOBAL INDUSTRY CLASSIFICATION STANDARD (GICS®) METHODOLOGY, March 2023].
The Pharmaceuticals industry resides within the Health Care Sector (GICS 35):5
- Sector (35): Health Care
- Industry Group (3520): Pharmaceuticals, Biotechnology & Life Sciences
- Industry (352020): Pharmaceuticals
- Sub-Industry (35202010): Pharmaceuticals
The GICS definition for the Pharmaceuticals Sub-Industry (35202010) includes “Companies engaged in the research, development or production of pharmaceuticals.6 Includes veterinary pharmaceuticals.” [MSCI/S&P GICS Structure & Definitions].
Boundaries and Interfaces:
It is crucial to distinguish Pharmaceuticals (352020) from related industries, as they possess different economic models, risk profiles, and valuation metrics.
- Biotechnology (352010): Defined as “Companies primarily engaged in the research, development, manufacturing and/or marketing of products based on genetic analysis and genetic engineering. Includes companies specializing in protein-based therapeutics.” [MSCI/S&P GICS Structure & Definitions].
- Distinction: While the scientific distinction has blurred (Pharmaceuticals increasingly develops biologics, and Biotech develops small molecules), the economic distinction often relates to maturity, revenue stability, and R&D intensity. “Big Pharma” typically has diversified portfolios, large commercial infrastructures, and stable earnings, whereas Biotech often features higher concentration on novel platforms, higher R&D burn rates, and binary outcomes tied to clinical data. For analytical purposes, this primer focuses on established, revenue-generating entities typically classified under 352020, while recognizing the critical R&D pipeline contributions from 352010.
- Life Sciences Tools & Services (352030): Includes companies enabling drug discovery and development, such as contract research organizations (CROs), contract development and manufacturing organizations (CDMOs), and providers of analytical instruments and reagents.
- Distinction: These firms are “pick-and-shovel” providers to the Pharma and Biotech industries. Their revenues are tied to the R&D spending and manufacturing volumes of their clients, rather than the ultimate commercial success or failure of specific drugs.
1.3 Market weight vs economic importance
The pharmaceutical sector commands significant attention in both the real economy (as a share of health spending) and financial markets (as a share of equity indices).
Market Capitalization and Index Weights:
Pharmaceuticals represent a substantial portion of the broader Health Care sector’s weight in major indices.
- S&P 500: The Health Care sector currently (2025) represents 10% of the S&P 500 index weight. Within this, the Pharmaceuticals industry (352020) and the Biotechnology industry (352010) combined often account for 40-50% of the sector’s total weight.
- Global Context: The U.S. dominates the global pharmaceutical market, accounting for 53.3% of world pharmaceutical sales in 2023, compared with 22.7% for Europe [EFPIA, The Pharmaceutical Industry in Figures 2024, 2024]. Furthermore, 67.1% of sales of new medicines launched between 2018-2023 occurred in the U.S. market [IQVIA MIDAS, May 2024, cited in EFPIA 2024].
Economic Importance and Health Expenditure Share:
Healthcare spending represents a significant portion of GDP in developed economies.7 In the U.S., National Health Expenditures (NHE) are projected to reach 17.7% of GDP in 2024 [CMS, National Health Expenditure Projections 2023–32, Health Affairs, June 2024].
- Prescription Drug Share of NHE: Spending on retail prescription drugs is a key component of NHE, though smaller than hospital care or physician services. CMS projects that retail prescription drug spending will reach $494.9 billion in 2024, representing approximately 9.8% of the projected $5.05 trillion total NHE for 2024 [CMS, NHE Projections 2024-2033 Forecast Summary, June 2025; CMS, National Health Expenditure Projections, 2023–32, Health Affairs, June 2024]. This figure excludes non-retail spending (e.g., hospital-administered drugs), which brings the total closer to 15-17%.
- Growth Trends: Prescription drug spending growth is projected at 10.1% for 2024, outpacing overall NHE growth (projected at 5.2% for 2024). However, growth is expected to slow to 7.0% in 2025, partly due to the impact of the Inflation Reduction Act (IRA) provisions, such as the $2,000 cap on Medicare Part D out-of-pocket spending [CMS, NHE Projections 2024-2033 Forecast Summary, June 2025].
Analysts must track these macroeconomic trends as they dictate the volume growth and pricing environment for the sector.
2) Core Industry Economics & Sensitivities
The pharmaceutical business model is defined by the tension between the high cost and risk of innovation and the time-limited monopoly pricing power granted by intellectual property (IP) and regulatory exclusivity.
2.1 R&D model and attrition
Drug development is a sequential, high-attrition process.8 The capitalized cost to develop a new drug (including the cost of failures) is estimated to be approximately $2.6 billion to $2.8 billion [DiMasi et al., Innovation in the pharmaceutical industry: new estimates of R&D costs, Journal of Health Economics, 2016; McKinsey analysis of Evaluate Pharma data, August 2023]. This high cost necessitates high prices for successful drugs to generate a positive return on investment (ROI) for the industry.
The Clinical Trial Process:
- Phase I: First-in-human trials. Typically involves a small number (20-100) of healthy volunteers (or patients with advanced disease, in oncology). The primary goal is to assess safety, tolerability, pharmacokinetics (PK – what the body does to the drug), and pharmacodynamics (PD – what the drug does to the body), and to establish a safe dosing range.
- Phase II: Proof-of-Concept (PoC). Involves a larger group (100-300) of patients with the target disease. The goal is to evaluate preliminary efficacy, identify optimal dosing regimens (dose-response), and further assess safety. Phase II is often subdivided into Phase IIa (pilot studies) and Phase IIb (well-controlled dose-ranging studies).
- Phase III: Pivotal trials. Large-scale (300-3,000+), randomized controlled trials (RCTs) designed to confirm efficacy, monitor side effects, and compare the drug to commonly used treatments or placebo. Success in Phase III (typically requiring two independent successful trials) is required for regulatory approval.
- Phase IIIb/IV: Post-marketing studies. Phase IIIb trials occur after NDA/BLA submission but before approval, often to gather additional data or explore new indications. Phase IV trials occur after approval to monitor long-term safety and effectiveness in the real world (Real-World Evidence or RWE), or to fulfill regulatory commitments.
Attrition Rates and Probability of Success (PoS):
The Likelihood of Approval (LOA) from Phase I—the probability that a drug entering Phase I will eventually be approved—is the key metric for assessing industry productivity and modeling pipeline value.
Recent data suggest that overall success rates have been fluctuating and potentially declining. Analysis of the 2011-2020 period indicated an overall LOA of 7.9% [BIO, Clinical Development Success Rates and Contributing Factors 2011–2020, 2021].9 However, analysis of phase transitions between 2014 and 2023 indicates the average LOA for a new Phase I drug may be closer to 6.7% [Citeline Biomedtracker analysis, reported in Pharmaphorum, 2024].
The decline is partly attributed to the industry’s increasing focus on complex diseases and novel mechanisms, particularly oncology, which has a lower success rate and represents a large share of the industry pipeline.
Exhibit 2.1: Historical Probability of Success (PoS) by Phase
The probability of success varies significantly by phase, with Phase II historically presenting the highest attrition rate as efficacy is rigorously tested. Recent data suggests overall success rates may be declining from the 2011-2023 average.
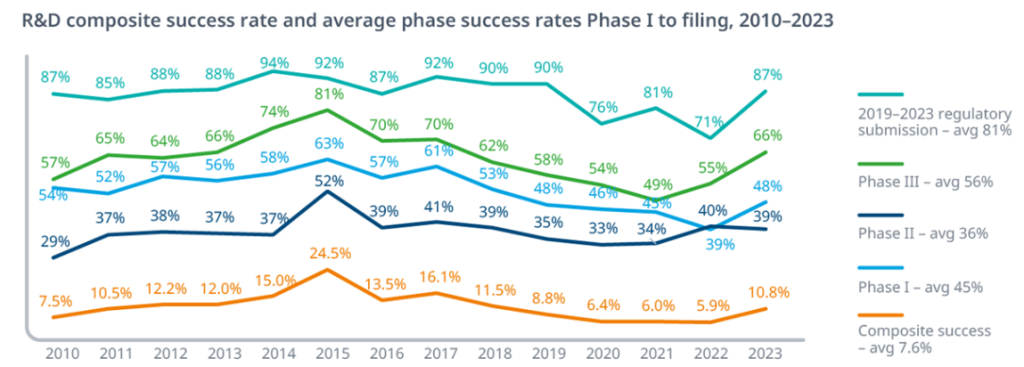
Key Insight: Notice how Phase II to III represents the steepest cliff—fewer than 3 in 10 drugs that prove safe enough for Phase II will actually demonstrate sufficient efficacy to advance. This is where most capital gets burned, and it’s why Phase IIb readouts are such significant binary events for biotech valuations.
The overall 7.9% success rate means you need to start with roughly 13 Phase I programs to expect one approval—though as noted in the text, recent data suggests this may have declined to closer to 6.7% (1 in 15).
Variability by Therapeutic Area (TA):
PoS varies widely by disease area. Hematology often has the highest LOA (23.9% in the 2011-2020 analysis), while Oncology (5.3%) and Urology (3.6%) have among the lowest [BIO, 2021]. Analysts must use TA-specific PoS rates when valuing pipeline assets (See Section 7.2).
Cycle Times:
The average clinical development time (Phase I start to approval) is typically 8-12 years, varying by TA.
2.2 Patent life, exclusivity, and LOE
The pharmaceutical business model relies on a period of monopoly pricing to recoup R&D investments. This monopoly is protected by two distinct mechanisms: patents and regulatory exclusivities. Loss of Exclusivity (LOE) is the single most significant event in a drug’s lifecycle.
Patents:
Patents are granted by the U.S. Patent and Trademark Office (USPTO) and provide the right to exclude others from making, using, or selling the invention. The standard patent term is 20 years from the filing date [FDA, Frequently Asked Questions on Patents and Exclusivity].
- Composition of Matter (CoM): The most critical patent, covering the active pharmaceutical ingredient (API) itself.
- Method of Use (MoU): Covers specific indications or ways of administering the drug.
- Formulation/Device: Covers the specific formulation (e.g., extended-release) or delivery device (e.g., injector pen).
Pharmaceutical companies often build “patent thickets”—portfolios of secondary patents (MoU, formulation) filed after the primary CoM patent—to extend protection and deter competition.
Regulatory Exclusivities (U.S.):
Exclusivities are granted by the FDA upon approval and run independently of patents. They prevent the FDA from approving generic or biosimilar applications for a set period [FDA, Patents and Exclusivity].
Small Molecules (Hatch-Waxman Act):
- New Chemical Entity (NCE): 5 years of exclusivity from approval. Generic firms (filing an Abbreviated New Drug Application, ANDA) cannot file an application until year 4 if they challenge a patent (Paragraph IV certification), or year 5 if they do not.
- New Clinical Investigation: 3 years of exclusivity for new indications, formulations, or dosing regimens, provided they required new clinical studies.
- Orphan Drug Exclusivity (ODE): 7 years for drugs treating rare diseases (affecting <200,000 people in the U.S.).
- Pediatric Exclusivity (PED): A 6-month extension added to existing patents and exclusivities if the sponsor conducts pediatric studies requested by the FDA.
Biologics (Biologics Price Competition and Innovation Act – BPCIA):
- Reference Product Exclusivity: 12 years of market exclusivity from the date of first licensure. Biosimilar applications cannot be approved until this period ends. [BPCIA, 42 U.S.C. § 262(k)(7)(A), (B)].
- Orphan and Pediatric: Similar provisions (7 years ODE, 6 months PED) apply to biologics.
The Orange Book and Purple Book:
- Orange Book: Lists approved small molecule drugs, along with their associated patents and exclusivities. [FDA, Approved Drug Products with Therapeutic Equivalence Evaluations | Orange Book].
- Purple Book: Lists licensed biological products, including reference products, biosimilars, and interchangeables, along with exclusivity periods.
LOE Mechanics and Strategies:
- Patent Term Restoration (PTE): The Hatch-Waxman Act allows sponsors to apply for an extension of up to 5 years on a key patent to compensate for time lost during the FDA review process, provided the total effective patent life does not exceed 14 years post-approval.
- NCE-1: A critical date for small molecules. It is one year before NCE exclusivity expires (i.e., 4 years post-approval). This is the earliest a generic competitor can file an ANDA with a Paragraph IV challenge. This filing often triggers litigation and provides the first indication of an impending LOE cliff.
International Context (EU/Japan):
- EU: Provides 10 years of market protection (8 years data exclusivity + 2 years market exclusivity). Supplementary Protection Certificates (SPCs) can extend patent protection for up to 5 years to compensate for regulatory review time, similar to PTE in the U.S.
- Japan: Provides 8 years of data exclusivity (re-examination period).
2.3 Pricing & market access
Pharmaceutical pricing is opaque and varies significantly by geography and channel. The core challenge for manufacturers is securing market access—ensuring their drugs are reimbursed by payors and placed favorably on formularies.
U.S. Pricing Dynamics: List vs. Net and the “Rebate Stack”
The U.S. market is characterized by a significant divergence between list prices and net prices.
- Wholesale Acquisition Cost (WAC): The manufacturer’s published list price for a drug sold to wholesalers. This is the starting point for pricing and reimbursement.
- Net Price: The actual revenue received by the manufacturer after all rebates, discounts, and fees are accounted for.
The difference between gross sales (at WAC) and net sales is known as the “Gross-to-Net Bubble.” This gap represents the total value of price concessions. In 2024, this bubble is estimated to be $356 billion for all brand-name drugs in the U.S. [Drug Channels Institute, Gross-to-Net Bubble Hits $356B in 2024, July 2025].
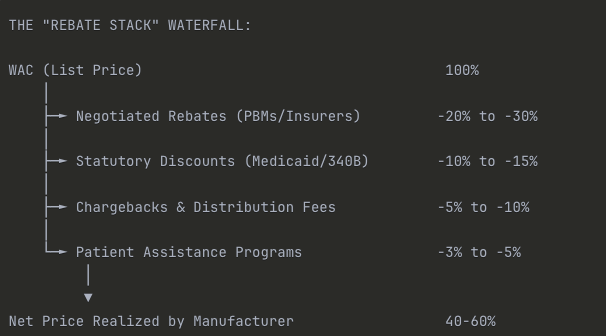
Exhibit 2.3: The Gross-to-Net Bridge (Illustrative Example)
Caption: A manufacturer’s list price (WAC) is systematically reduced by various mandatory and negotiated discounts, resulting in a significantly lower net price realized by the manufacturer.
Illustrative Dollar Example:
| Item | % of WAC | Dollar Amount |
| WAC (List Price) | 100% | $10,000 |
| Less: PBM/Commercial Rebates | (25%) | ($2,500) |
| Less: Medicaid Rebates | (12%) | ($1,200) |
| Less: 340B Discounts | (8%) | ($800) |
| Less: Chargebacks & Fees | (7%) | ($700) |
| Less: Co-pay Cards/Patient Support | (3%) | ($300) |
| Net Revenue to Manufacturer | 55% | $5,500 |
Critical Insight for Analysts: This 45% gross-to-net gap ($4,500 in the example) is the invisible tax that makes pharmaceutical economics so opaque. When you see a drug with a $10,000 WAC, the manufacturer might only net $5,500—and that gap has been widening over the past decade as PBM negotiating power has increased.
This is why you can’t forecast revenue by simply multiplying units sold × list price. You need channel-specific gross-to-net assumptions for each payor mix (Medicare, Medicaid, Commercial, Cash).
Key Components of the Gross-to-Net Gap:
- PBMs and Negotiated Rebates: PBMs (e.g., CVS Caremark, Express Scripts, OptumRx) negotiate retrospective rebates from manufacturers in exchange for favorable formulary placement (e.g., preferred tier status, fewer utilization management restrictions).10 These rebates are the largest component of the GTN gap. This system creates an incentive for manufacturers to increase list prices to offer larger rebates while maintaining their desired net price.11
- Statutory Discounts and Rebates (Government Programs):
- Medicaid Drug Rebate Program (MDRP): Manufacturers must provide rebates to state Medicaid programs. The basic rebate is the greater of 23.1% of Average Manufacturer Price (AMP) or the difference between AMP and “Best Price” (the lowest price offered to any commercial payer).12
- Inflation Penalties (MDRP): If a drug’s price increases faster than inflation (CPI-U), the manufacturer must pay an additional rebate. The cap on these rebates was removed starting January 2024, significantly increasing manufacturer liability for price increases.
- 340B Drug Pricing Program: Requires manufacturers to provide discounts (often 25-50%+) on outpatient drugs to “covered entities” (e.g., certain hospitals and clinics serving vulnerable populations). The growth of the 340B program is a significant driver of the GTN gap.
The Inflation Reduction Act (IRA) of 2022:
The IRA is the most significant piece of U.S. drug pricing legislation in decades, fundamentally altering the economics of the Medicare program.
- Drug Price Negotiation Program: Empowers the Secretary of Health and Human Services (HHS) to negotiate “Maximum Fair Prices” (MFPs) for a selected number of high-expenditure, single-source drugs covered under Medicare Part D (starting 2026) and Part B (starting 2028).13
- Eligibility: Small molecules are eligible 9 years post-approval; biologics are eligible 13 years post-approval.
- Impact: Will significantly reduce net prices for selected drugs in the Medicare channel. It incentivizes manufacturers to prioritize biologics (longer exemption) and potentially shifts R&D away from small molecules targeting Medicare populations.
- Inflation Rebates (Medicare): Requires manufacturers to pay rebates to Medicare if prices for Part B and Part D drugs rise faster than inflation (CPI-U).14 This effectively caps price increases for the Medicare market.
- Part D Redesign (Effective 2025): Caps annual out-of-pocket spending for beneficiaries at $2,000. It also eliminates the “coverage gap” and shifts more liability to manufacturers and Part D plans during the catastrophic phase.
International Pricing and HTA:
Outside the U.S., pricing is generally lower and more centralized, often involving Health Technology Assessment (HTA).
- UK (NICE): Uses cost-effectiveness analysis, often measured in Quality-Adjusted Life Years (QALYs).
- Germany (G-BA/IQWiG): Conducts an early benefit assessment (AMNOG) to determine the added benefit of a new drug versus a comparator, which informs price negotiations.
- Reference Pricing: Many countries use international reference pricing (IRP), benchmarking their prices against a basket of other countries.
- Japan: Prices are set by the National Health Insurance (NHI) system and are subject to regular mandatory price revisions.
2.4 Mix: small molecules vs biologics vs complex generics/biosimilars
The industry mix is shifting towards biologics, driven by scientific advancements and favorable regulatory frameworks (longer exclusivity).
- Small Molecules: Chemically synthesized, often orally administered, relatively straightforward to manufacture. Governed by the Hatch-Waxman Act for generic competition.15
- Biologics: Large, complex molecules (e.g., proteins, antibodies) produced using living organisms. Typically injected/infused, require complex manufacturing, and often target diseases with high unmet need. Governed by the BPCIA for biosimilar competition.
Generics and Biosimilars:
- Generics: Chemically identical copies of small molecules. Must demonstrate bioequivalence.
- Biosimilars: Highly similar versions of biologics. Must demonstrate no clinically meaningful differences in safety, purity, and potency. Approval via abbreviated BLA (aBLA) is more complex and costly than generics [FDA, BPCIA Overview].
Interchangeability and Substitution:
- Generics: Automatically substitutable by the pharmacist.
- Biosimilars: Not automatically interchangeable unless the FDA grants an “Interchangeable” designation, which requires additional data (switching studies).
Market Dynamics and Formulary Management:
Payers use tools like Step Therapy (requiring failure on a preferred drug first) and Prior Authorization (PA) to control utilization of high-cost drugs. PBMs use tiered formularies to incentivize use of preferred drugs through lower patient copays.
2.5 Operating leverage sources
Pharmaceutical companies exhibit significant operating leverage due to their cost structure.
- High Gross Margins: Incremental cost of production is relatively low. Gross margins are typically 70-90%+. Biologics have higher COGS than small molecules but still maintain high margins.
- R&D as a Fixed Cost: R&D spending (15-25% of revenue) is largely fixed in the short term.
- SG&A Scale and Field Force: Selling, General, and Administrative (SG&A) expenses (20-30% of revenue) are scalable. A successful drug launch can drive rapid margin expansion as revenue growth outpaces SG&A growth.
- Manufacturing Capacity (Fixed Costs): Biologic manufacturing facilities require significant upfront capital expenditure. Capacity utilization is a key driver of gross margin for biologics.
Gross-to-Net Dynamics: If list prices rise but net prices fall (due to increased rebates), the actual operating profit margin may be compressed. Analysts must model revenue based on expected net prices.
2.6 Regulatory risk
The industry is heavily regulated, and FDA/EMA actions can dramatically impact valuations.
- Clinical Holds: FDA halts trials due to safety or manufacturing issues, delaying development.
- Complete Response Letters (CRLs): Issued by the FDA when an application cannot be approved in its present form. Can require new clinical trials or resolution of CMC issues.
- Advisory Committees (AdComs): Independent expert panels convened by the FDA. While non-binding, FDA typically follows AdCom recommendations. AdCom meetings are significant binary events.
- Risk Evaluation and Mitigation Strategies (REMS): Required for drugs with serious safety risks. Can range from medication guides to restricted distribution, potentially limiting commercial uptake.
- Black Box Warnings: The most stringent safety warning on a drug label.
- Post-Marketing Commitments (PMCs)/Requirements (PMRs): Studies required after approval to monitor safety or confirm efficacy.16
3) Drug Development & Regulatory Pathways (U.S./EU focus)
3.1 IND → NDA/BLA; Expedited Pathways
The U.S. (FDA) Pathway:
- Investigational New Drug (IND) Application: Submitted before human clinical trials begin. Includes preclinical data, CMC, and clinical protocols.
- New Drug Application (NDA) / Biologics License Application (BLA): Submitted after completion of clinical trials.
- PDUFA Date: The Prescription Drug User Fee Act (PDUFA) date is the FDA’s goal date for completing the review.17 Standard review is 10 months; Priority Review is 6 months.
Expedited Programs:
- Fast Track Designation: Facilitates development and expedites review. Allows for “rolling review.”
- Breakthrough Therapy Designation (BTD): For drugs showing substantial improvement over available therapy in early data. Includes Fast Track features plus intensive FDA guidance.
- Priority Review: FDA aims to act within 6 months.18
- Accelerated Approval (AA): Allows for approval based on a “surrogate endpoint” reasonably likely to predict clinical benefit (e.g., tumor shrinkage).19 Sponsors must conduct post-approval confirmatory trials.
Surrogate Endpoints:
Common in oncology and rare diseases. Examples: Progression-Free Survival (PFS) and Objective Response Rate (ORR) are often used as surrogates for Overall Survival (OS). Approval based on surrogates can lead to faster market entry, but reimbursement may be contingent on demonstrating clinical benefit later.
3.2 EMA parallels and HTA value assessments
The European Union (EMA) Pathway:
The EMA coordinates the centralized procedure for drug approval in the EU.20
- Marketing Authorisation Application (MAA): The equivalent of the NDA/BLA.
- Committee for Medicinal Products for Human Use (CHMP): Reviews MAAs and provides a scientific opinion.
EMA Expedited Parallels:
- PRIME (PRIority MEdicines): Similar to BTD, offering enhanced support for medicines targeting unmet needs.
- Conditional Marketing Authorisation (CMA): Similar to Accelerated Approval, granted based on less comprehensive data, subject to obligations.
Health Technology Assessment (HTA) Interface:
In Europe, regulatory approval (EMA) is separate from pricing and reimbursement decisions, which are made at the member state level involving HTA bodies (the “fourth hurdle”).
- NICE (UK): Focuses on cost-effectiveness (QALYs).
- G-BA/IQWiG (Germany): Focuses on added clinical benefit vs. comparator (AMNOG process).
- HAS (France): Focuses on clinical value (SMR/ASMR).
The gap between EMA approval and national reimbursement can be significant (6-18+ months). The new EU HTA regulation aims to streamline the clinical evidence assessment (Joint Clinical Assessment – JCA) starting in 2025, but national economic evaluations remain [IQWiG, European HTA, 2025].
3.3 CMC and manufacturing
Chemistry, Manufacturing, and Controls (CMC) is a critical aspect of drug development and a frequent source of regulatory delays (CRLs).
- Biologics Complexity: Bioprocessing is complex. “The process is the product”—small changes can impact the final product.
- Capacity Constraints: Building biologic facilities takes years and significant capital. Constraints can limit market supply (e.g., GLP-1 agonists, viral vectors for gene therapy).
- Technology Shifts: Adoption of Single-Use Systems (SUS) for flexibility and Continuous Manufacturing for efficiency.
- GMP Compliance: Adherence to Good Manufacturing Practices is strictly enforced. Violations (e.g., Form 483 observations, Warning Letters) can lead to facility shutdowns.
4) Revenue Durability & LOE Management
4.1 Patent cliffs—case studies
The shape of the erosion curve post-LOE differs significantly between small molecules and biologics.
Small Molecule Erosion (Genericization):
- Erosion Curve: Extremely steep. The branded drug can lose 80-90%+ of revenue within 12 months due to automatic pharmacy substitution and aggressive pricing.
- Case Study: Lipitor (atorvastatin, Pfizer): Lost over 90% of U.S. sales within a year of its 2011 LOE.
Biologic Erosion (Biosimilars):
- Erosion Curve: Slower and shallower. Biosimilars typically launch at discounts of 15-40%. The reference product often retains significant market share for several years.
- Case Study: Remicade (infliximab, J&J): Erosion was gradual over several years post-2016 biosimilar entry, driven by J&J’s aggressive contracting strategies.
Exhibit 4.1: Illustrative Revenue Erosion Curves (Small Molecule vs. Biologic)
Caption: Small molecules typically face rapid, near-complete erosion within 12 months of generic entry, while biologics experience a slower decline over several years due to higher barriers to biosimilar adoption and complex contracting dynamics.
4.2 LCM strategies
Lifecycle Management (LCM) encompasses strategies employed by manufacturers to extend the commercial life and maximize the value of a drug beyond its primary patent expiration. Effective LCM begins early in the development process.
Key LCM Strategies:
- Indication Expansion (Label Expansion): Pursuing approvals for additional patient populations or disease states. This is the most common and value-accretive strategy.
- Example: Merck’s Keytruda (pembrolizumab) was first approved for advanced melanoma in 2014 but has since expanded to over 30 indications across numerous tumor types, including the highly lucrative non-small cell lung cancer (NSCLC) market [Merck 10-K, 2024].
- Line Extensions and Sequencing: Moving the drug to earlier lines of therapy (e.g., from third-line salvage therapy to first-line treatment), which typically involves larger patient populations and longer treatment durations. This often requires demonstrating superior efficacy or safety compared to the existing standard of care (SOC).
- Combination Therapies: Developing fixed-dose combinations (FDCs) with other proprietary or generic drugs. This can improve efficacy, enhance convenience (reducing pill burden), and create a new patentable entity.
- Example: Gilead’s HIV franchise relies heavily on FDCs (e.g., Biktarvy, a three-drug combination) [Gilead 10-K, 2024].1
- Reformulation and Novel Delivery Systems: Modifying the drug’s formulation to improve pharmacokinetics, reduce dosing frequency (e.g., moving from daily oral to weekly injection), or improve tolerability.2
- Example: Switching from lyophilized powder requiring reconstitution to a pre-filled syringe.
- Device Technology: Integrating the drug with a proprietary delivery device (e.g., auto-injectors, inhalers). Patents on the device can deter generic/biosimilar competition even if the CoM patent has expired.
- Pediatric Extensions: Securing the 6-month exclusivity extension by conducting pediatric studies (See Section 2.2).
- Patient Support Programs (PSPs) and Adherence: Providing services (e.g., nurse educators, financial assistance) to improve patient adherence and brand loyalty.3 While not providing exclusivity, this can slow erosion post-LOE, particularly for complex biologics.
4.3 BD&L/M&A patterns
External innovation through Business Development and Licensing (BD&L) and Mergers and Acquisitions (M&A) is critical for pharmaceutical companies to replenish pipelines and address impending patent cliffs. The industry constantly faces a “buy vs. build” decision.
Drivers of Activity:
- Pipeline Gaps: Filling gaps in specific therapeutic areas or development stages.
- LOE Pressure: Acquiring revenue-generating assets to offset erosion of blockbuster drugs.
- Access to Novel Technologies: Acquiring new modality platforms (e.g., mRNA, cell therapy, ADCs).
Deal Structures:
- In-Licensing and Collaboration: Acquiring rights to a specific asset or technology, often involving an upfront payment, milestone payments (development, regulatory, commercial), and royalties on future sales.4 This allows large pharma to leverage the innovation of smaller biotech firms while sharing risk.
- Acquisitions (M&A):
- Bolt-on Acquisitions: Smaller deals ($1B-$20B) focused on acquiring specific assets or platforms to complement the existing portfolio.
- Mega-Mergers: Large-scale combinations (e.g., Pfizer/Wyeth, BMS/Celgene) aimed at achieving scale, synergies (cost-cutting), and portfolio diversification. These are less common due to antitrust scrutiny and complexity.
- Royalty Agreements: Purchasing future royalty streams from universities, inventors, or other companies. This provides financial exposure without operational responsibility (See Section 8).
Financial Considerations:
- Contingent Value Rights (CVRs): Used in M&A to bridge valuation gaps between the buyer and seller regarding pipeline assets. CVR holders receive cash payments if specific milestones are met. Analysts should heavily discount or assign zero value to CVRs due to the high probability of failure.
- rNPV Accretion/Dilution: Analysts evaluate deals based on whether the acquisition price is justified by the risk-adjusted Net Present Value (rNPV) of the acquired assets. High premiums often require aggressive assumptions about peak sales or synergies.
- Internal Rate of Return (IRR): The expected return on the capital deployed for the acquisition. This is compared against the company’s Weighted Average Cost of Capital (WACC).
- Earnings Dilution (GAAP vs. Non-GAAP): Acquisitions often lead to short-term GAAP earnings dilution due to amortization of acquired intangible assets and In-Process R&D (IPR&D) write-offs. The accounting treatment of IPR&D is evolving. Analysts often focus on Non-GAAP earnings, which exclude these non-cash charges, to assess the underlying operational impact of the deal.
5) Macro Drivers & Analyst Dashboard
Pharmaceutical sector performance is influenced by macroeconomic factors, demographic trends, and, most significantly, policy and regulatory developments.
5.1 Demographics, income elasticity, and coverage
Demographics (Volume Driver):
- Aging Population: The primary driver of pharmaceutical volume growth. Aging increases the prevalence of chronic diseases (e.g., cardiovascular disease, cancer, diabetes, neurological disorders).5 The U.S. population aged 65+ is projected to grow significantly faster than the overall population [U.S. Census Bureau, Population Projections].
- Disease Prevalence: Increasing prevalence of certain conditions, notably obesity and metabolic disorders, drives demand for specific therapeutic classes (e.g., GLP-1 agonists).
Income Elasticity:
- Healthcare spending, including pharmaceuticals, is generally considered relatively inelastic to income fluctuations in the short term (people need essential medicines regardless of the economic cycle). However, economic downturns can lead to job losses and reduced insurance coverage, impacting utilization (e.g., delayed treatment initiation, lower adherence).6
Insurance Coverage (U.S.):
- Commercial Insurance: Employer-sponsored insurance is the largest segment. Trends include the shift towards high-deductible health plans (HDHPs), which increases patient out-of-pocket costs and can impact adherence.
- Medicare (Aged 65+): A major payor, covering both pharmacy benefits (Part D) and physician-administered drugs (Part B).
- Medicaid (Low Income): State-administered programs.
- Medicaid Redeterminations: The process of reassessing eligibility following the end of the COVID-19 Public Health Emergency has led to significant disenrollment, potentially reducing prescription volumes in this channel [KFF, Medicaid Enrollment and Unwinding Tracker, 2025].
5.2 Policy watchlist
Policy is the most significant exogenous risk factor for the U.S. pharmaceutical industry. Analysts must monitor the implementation and potential evolution of key regulations.
Inflation Reduction Act (IRA) Implementation:
- Drug Price Negotiation Timelines:
- The first tranche of 10 Part D drugs selected for negotiation (prices effective 2026) included major blockbusters (e.g., Eliquis, Jardiance).
- The second tranche (prices effective 2027) was announced in 2025 with drugs such as Ozempic, Rybelsus, Wegovy (Novo Nordisk) included in the list.
- Negotiation expands to Part B drugs (prices effective 2028).
- Negotiation Eligibility: The 9-year (small molecule) vs. 13-year (biologic) exemption window is shifting R&D incentives. Companies may delay launching drugs in smaller indications to maximize the effective exemption period for larger indications (“starting the clock”).
- Inflation Rebates (Medicare): Effective since 2023. This limits the industry’s historical reliance on annual list price increases.
- Part D Redesign (2025): The $2,000 out-of-pocket cap improves affordability for patients but increases financial liability for manufacturers in the catastrophic phase (20% coinsurance).
Other Key U.S. Policy Areas:
- Part B Reimbursement (ASP+6%): Physician-administered drugs are reimbursed based on the Average Sales Price (ASP) plus a 6% add-on payment.7 This “buy-and-bill” system incentivizes the use of higher-priced drugs. Potential reforms include reducing the add-on percentage or implementing flat fees.
- Medicaid Best Price Rules: The requirement to offer Medicaid the lowest price offered to any commercial buyer can constrain commercial pricing strategies.
- PBM Reform: Increasing scrutiny on PBM practices, including rebate transparency and “spread pricing” (charging payors more than they reimburse pharmacies). Potential legislation could mandate 100% rebate pass-through or “delinking” PBM compensation from drug list prices.
- Copay Accumulators/Maximizers: Programs implemented by insurers/PBMs that prevent manufacturer-provided copay assistance from counting towards a patient’s deductible or out-of-pocket maximum.8 This increases patient costs and can negatively impact adherence.
5.3 Data series & calendars to monitor
Analysts must maintain a rigorous calendar and track key data series to anticipate catalysts and monitor performance.
FDA/Regulatory:
- FDA CDER/CBER Approval Lists: Monthly and annual reports on NME and BLA approvals.
- Advisory Committee (AdCom) Calendar: Critical for anticipating binary events. Reviewing briefing documents prior to the meeting is essential.
- PDUFA/Goal Dates: Target action dates for pending applications.
- ClinicalTrials.gov: Database of clinical trials. Monitor for trial initiations, completions, and results postings.
CMS/Pricing & Reimbursement:
- CMS Announcements: IRA implementation updates (selected drugs, MFP guidance).
- Part D Utilization Data: Trends in Medicare spending and utilization.
- ASP (Average Sales Price) Quarterly Data: Used for Part B reimbursement calculations.
- 340B Program Statistics: Growth of the program and participating entities.
Industry Data (Third-Party):
- IQVIA (formerly IMS Health):
- TRx (Total Prescriptions) / NRx (New Prescriptions): Weekly or monthly prescription trends. Essential for tracking drug launches and market share shifts.
- Channel Mix: Retail vs. mail order vs. institutional.
- National Sales Data (NSP/NSS): Estimates of drug sales volumes.
- Symphony Health/others: Alternative sources for prescription data.
Macroeconomic/Global:
- WHO/OECD Health Statistics: International comparisons of pharmaceutical spending as a percentage of GDP; drug price indices.
- U.S. Census Bureau: Population demographics.
- BLS (Bureau of Labor Statistics): CPI-U data (relevant for inflation rebates).
Intellectual Property:
- USPTO Patent Database: Monitoring patent filings and grants.
- FDA Orange Book/Purple Book: Key patent expiries and exclusivity periods.
International (Ex-U.S.):
- EMA CHMP Monthly Opinions: Recommendations for MAA approvals.
- HTA Decisions: NICE (UK) guidance, G-BA (Germany) benefit assessments.
- Japan NHI Price Revisions: Biannual price cuts.
6) Competitive Landscapes by Major Therapy Areas (TA)
The pharmaceutical market is fragmented into numerous therapeutic areas, each with distinct competitive dynamics, scientific challenges, and payor sensitivities.9
6.1 Cardiometabolic (Obesity, Diabetes, Cardiovascular, CKD)
This TA is currently dominated by the rapid expansion of the Glucagon-like Peptide-1 (GLP-1) agonist class.
- Key MoAs: GLP-1 receptor agonists, dual/triple agonists (GLP-1/GIP/Glucagon), SGLT2 inhibitors.
- Leading Players: Novo Nordisk (Ozempic/Wegovy), Eli Lilly (Mounjaro/Zepbound).
- Dynamics:
- Uptake Curves: Unprecedented demand driven by significant efficacy in weight loss and cardiovascular benefits.
- Capacity/Bottlenecks: Manufacturing capacity for injector pens and API is the primary constraint on market growth. Both LLY and NVO are investing heavily in capacity expansion [Eli Lilly Q2 2025 Earnings Call Transcript; Novo Nordisk Capital Markets Day 2024].
- Pricing Pressure: High list prices and massive utilization are straining payor budgets. PBMs are implementing stricter utilization management (Prior Authorization, Step Therapy).10 Coverage for obesity remains limited compared to diabetes.
- Pipeline: Focus on oral formulations, next-generation multi-agonists with improved tolerability and efficacy, and combination therapies.
- Near-term Catalysts: Data readouts from ongoing Cardiovascular Outcomes Trials (CVOTs) for next-gen agents; potential expansion of Medicare coverage for obesity drugs (currently excluded).
6.2 Oncology
Oncology is the largest TA by revenue and R&D investment, characterized by rapid innovation and premium pricing.
- Key MoAs:
- Immuno-Oncology (IO) Backbones: PD-1/PD-L1 inhibitors (e.g., Keytruda, Opdivo) remain the cornerstone of treatment across many tumor types.
- Antibody-Drug Conjugates (ADCs): Targeted chemotherapy delivering potent cytotoxic payloads directly to cancer cells. A major area of investment and M&A.
- Targeted Therapies: Kinase inhibitors (e.g., EGFR, BTK inhibitors).
- Cell Therapy (CAR-T): Highly effective in hematologic malignancies, moving into solid tumors.
- Bispecific Antibodies: Engaging immune cells to target tumor cells.
- Leading Players: Merck, Bristol Myers Squibb, AstraZeneca, Roche, Pfizer, Novartis, J&J.
- Dynamics:
- Tissue-Agnostic Approvals: Approvals based on genetic biomarkers rather than tumor location.
- Trial Endpoints: Overall Survival (OS) is the gold standard, but Progression-Free Survival (PFS) and Objective Response Rate (ORR) are often used for accelerated approval.
- Combinations: Increasing complexity of treatment regimens, combining IO with chemotherapy, targeted therapies, or other novel agents.
- Minimal Residual Disease (MRD): Use of sensitive assays (e.g., ctDNA) to detect residual cancer cells post-treatment, informing adjuvant therapy decisions.
- Payor Posture: High scrutiny on cost-effectiveness, particularly for marginal improvements in OS.
6.3 Immunology/Inflammation (I&I)
Characterized by chronic diseases (e.g., Rheumatoid Arthritis, Psoriasis, Inflammatory Bowel Disease) treated with high-cost biologics and novel oral therapies.
- Key MoAs: TNF inhibitors (e.g., Humira, Enbrel), IL-17 inhibitors, IL-23 inhibitors, JAK inhibitors (oral).
- Leading Players: AbbVie, J&J, Amgen, Novartis, Sanofi/Regeneron, Eli Lilly.
- Dynamics:
- Biosimilars Impact: The U.S. entry of Humira biosimilars is reshaping the RA market. PBM contracting and formulary placement are critical determinants of market share.
- Novel Mechanisms: Shift towards newer mechanisms (IL-17/23) offering improved efficacy and safety profiles.
- JAK Inhibitor Safety Concerns: FDA class-wide warnings on JAK inhibitors regarding cardiovascular risks and malignancy have constrained their utilization [FDA, Drug Safety Communication on JAK Inhibitors, 2021].11
- Access Dynamics: Highly competitive and heavily rebated market. Payors aggressively manage utilization through step therapy.
6.4 Rare/Genetic Diseases
Targets small patient populations with high unmet need, commanding ultra-premium pricing.
- Key MoAs: Enzyme replacement therapy (ERT), gene therapy (AAV-mediated), gene editing (CRISPR), mRNA therapeutics, siRNA.
- Leading Players: Vertex, Alexion (AstraZeneca), BioMarin, Sarepta Therapeutics.
- Dynamics:
- Gene Therapy Economics: Potential for one-time curative treatments presents challenges for traditional reimbursement models.
- “One-and-Done” Pricing: Prices often exceed $1 million per treatment (e.g., Zolgensma, Hemgenix).
- Outcomes-Based Contracts (OBCs) / Value-Based Agreements (VBAs): Payors increasingly demand linking payment to treatment effectiveness and durability.
- Manufacturing Challenges: Viral vector capacity and CMC complexity are significant hurdles for gene therapy development and commercialization.
6.5 Central Nervous System (CNS)
High-risk, high-reward area focusing on neurodegenerative diseases (Alzheimer’s, Parkinson’s), psychiatry (Schizophrenia, Depression), and pain.
- Key MoAs: Anti-amyloid antibodies (Alzheimer’s), neurotransmitter modulators.
- Leading Players: Biogen, Eisai, Eli Lilly, J&J, Otsuka.
- Dynamics:
- Trial Risk: High failure rates in Phase II/III due to subjective endpoints, placebo effects, and difficulty crossing the blood-brain barrier.
- Alzheimer’s Landscape: Approval of anti-amyloid antibodies (e.g., Leqembi) marks a significant shift, but clinical benefit is modest and associated with safety risks (ARIA).12 Reimbursement and infrastructure (PET scans, infusion centers) are bottlenecks.
- Near-term Catalysts: Data readouts for novel mechanisms in Alzheimer’s and Parkinson’s; development of targeted therapies for genetically defined neurological disorders.
Exhibit 6.1: TA Market Map – Oncology
Caption: The oncology market is dominated by PD-1/L1 inhibitors, but ADCs and targeted therapies are rapidly gaining share. Market shares are estimates and subject to rapid change.
| MoA Class | Key Drugs | Estimated Market Size / Share (2025) |
| PD-1 / PD-L1 Inhibitors | Keytruda, Opdivo, Tecentriq | $62.2 – $64 billion market size globally, representing the dominant immuno-oncology segment |
| Antibody-Drug Conjugates (ADCs) | Enhertu, Padcev, Trodelvy | $13.6 – $16.5 billion market size globally; growing rapidly at 18-23% CAGR |
| Kinase Inhibitors (EGFR/BTK) | Tagrisso, Imbruvica, Calquence | $67.3 billion total tyrosine kinase inhibitor market in 2025; BTK inhibitors growing fastest with ~9% CAGR . |
| Hormonal Therapies | Xtandi, Erleada | Estimated $22-23 billion market size; growing at around 7-7.5% CAGR, driven by hormone-driven cancers such as prostate and breast cancer . |
| Chemotherapy (genericized) | Various | Approximately $10.5 – $11.7 billion global market; slower growth but still significant due to prevalence and accessibility. |
7) Valuation Playbook
Valuing pharmaceutical companies requires a blend of traditional financial analysis (for mature products) and specialized techniques (for the pipeline). The Sum-of-the-Parts (SOTP) approach is typically the most appropriate methodology.
7.1 Mature pharma valuation
For large-cap, diversified pharmaceutical companies with stable revenues and predictable earnings, standard valuation multiples are relevant, but must be interpreted in the context of the LOE cycle.
Key Metrics:
- P/E Ratio (Price/Earnings): The most common metric.
- Non-GAAP vs. GAAP: Analysts typically rely on Non-GAAP (adjusted) EPS, which excludes amortization of acquired intangibles, restructuring costs, and certain legal settlements. However, it is crucial to reconcile Non-GAAP to GAAP EPS and understand the adjustments (e.g., excluding stock-based compensation can be overly aggressive).
- Context: P/E ratios must be normalized for the cycle. A low P/E may indicate an impending patent cliff (a “value trap”), while a high P/E may reflect high growth expectations from new launches or pipeline assets.
- EV/EBITDA (Enterprise Value / Earnings Before Interest, Taxes, Depreciation, and Amortization): Useful for comparing companies with different capital structures and tax rates.
- Free Cash Flow (FCF) Yield: (Cash Flow from Operations – Capital Expenditures) / Market Capitalization. Reflects the company’s ability to generate cash for M&A, dividends, and share buybacks.
- Dividend Yield: Mature pharma companies often pay significant dividends.
Through-Cycle Margin Normalization:
Analysts should forecast long-term operating margins, considering the impact of LOEs (margin accretive as high-margin products lose revenue but associated SG&A is cut) and new product launches (margin dilutive initially due to launch costs).
7.2 Pipeline economics: risk-adjusted NPV (rNPV) methodology
The pipeline represents a significant portion of a pharmaceutical company’s value. The risk-adjusted Net Present Value (rNPV) method is the standard approach for valuing pipeline assets. It involves forecasting future cash flows for each asset and adjusting them for the probability of success (PoS).
rNPV Calculation Steps:
- Market Opportunity Assessment (Epidemiology):
- Define the target patient population (incidence/prevalence).
- Segment the population by line of therapy and biomarkers.
- Estimate the addressable market size.
- Revenue Forecast (Peak Sales and Ramp Curve):
- Peak Market Share: Estimate the asset’s peak penetration within the addressable market, considering the competitive landscape, clinical profile (efficacy/safety), and market access dynamics.
- Pricing (Net): Forecast the annual net price, accounting for gross-to-net discounts, rebates, and potential price erosion (e.g., IRA negotiation).
- Peak Sales: Peak Market Share × Addressable Population × Annual Net Price.
- Ramp Curve: Forecast the adoption curve from launch to peak sales (typically 5-8 years). S-shaped curves are common.
- Duration/LOE: Forecast revenues until patent expiration/LOE. Apply an erosion curve post-LOE (See Section 4.1).
- Cost Estimation (Opex Overlay):
- COGS: Estimate Cost of Goods Sold (e.g., 5-10% for small molecules, 10-20% for biologics).
- SG&A: Estimate Selling, General, and Administrative expenses required to support the product (e.g., field force costs).
- R&D (Ongoing): Include costs for ongoing clinical trials (e.g., Phase IV, LCM studies).
- Royalties/Milestones: If the asset is in-licensed, deduct milestone payments and royalties owed to partners.
- Probability of Success (PoS) Adjustment:
- Apply the cumulative probability of approval (LOA) based on the current phase of development and therapeutic area (See Section 2.1).
- Risk-Adjusted Revenue/Costs: Multiply forecasted revenues and costs by the PoS.
- Discounting (NPV Calculation):
- WACC (Weighted Average Cost of Capital): The discount rate used to calculate the present value of future cash flows. Typically ranges from 8-10% for large-cap pharma, higher for biotech.
- Terminal Value: Generally not included for individual pipeline assets due to finite patent life. The value is derived from cash flows during the exclusivity period.
Exhibit 7.2: rNPV Model Template (Illustrative Example – Phase II Oncology Asset)
Caption: The rNPV calculation integrates epidemiology, market share, pricing, costs, and probability of success, discounted to the present value. This example assumes a 15% PoS for a Phase II oncology asset.
| Input/Calculation | Year 1 (Ph II) | … | Year 5 (Launch) | … | Year 10 (Peak) |
| Addressable Patients | – | 50,000 | 60,000 | ||
| Market Share | – | 5% | 25% | ||
| Treated Patients | – | 2,500 | 15,000 | ||
| Net Price (Annual) | – | $100,000 | $110,000 | ||
| Unadjusted Revenue | **$0** | $250M | $1,650M | ||
| COGS (15%) | $0 | $37.5M | $247.5M | ||
| SG&A | $0 | $75M | $200M | ||
| R&D (Ongoing) | $50M | $20M | $30M | ||
| Unadjusted EBIT | **-$50M** | $117.5M | $1,172.5M | ||
| PoS (Cumulative) | 15% | 15% | 15% | ||
| Risk-Adjusted EBIT | -$7.5M | $17.6M | $175.9M | ||
| Discount Factor (10%) | 0.909 | 0.621 | 0.386 | ||
| Discounted rEBIT | -$6.8M | $10.9M | $67.9M | ||
| Total rNPV (Sum of Discounted rEBIT) | $850M |
7.3 Portfolio/SOTP Valuation
The Sum-of-the-Parts (SOTP) valuation aggregates the value of the company’s different components.
- Inline Products (Commercial Portfolio): DCF analysis of currently marketed products, forecasted until LOE.
- Pipeline rNPV: Sum of the rNPV for each material pipeline asset (See Section 7.2).
- Net Cash/Debt: Current cash and investments minus total debt.
- Equity Investments: Market value of stakes in other publicly traded companies.
- Royalties: NPV of future royalty streams received.
- Other Businesses: Value of non-core segments (e.g., Animal Health, Consumer Health), often valued using multiples.
7.4 Cross-checks and Sensitivities
Valuation is not a precise science. Analysts must use cross-checks and sensitivity analysis.
- EV/Sales: Useful for companies with negative earnings or undergoing significant margin changes. Compare EV/Sales against expected growth and LOE risk.
- PEG Ratio (P/E to Growth): Measures the P/E relative to the expected EPS growth rate. A PEG < 1 is often considered attractive, but requires reliable growth forecasts.
- Scenario Analysis (Base/Bear/Bull): Define different scenarios based on key drivers (e.g., clinical trial outcomes, launch uptake, competitive entry, policy changes).
- Tornado Diagrams: Identify the variables to which the valuation is most sensitive (typically peak sales, pricing, PoS, and discount rate).
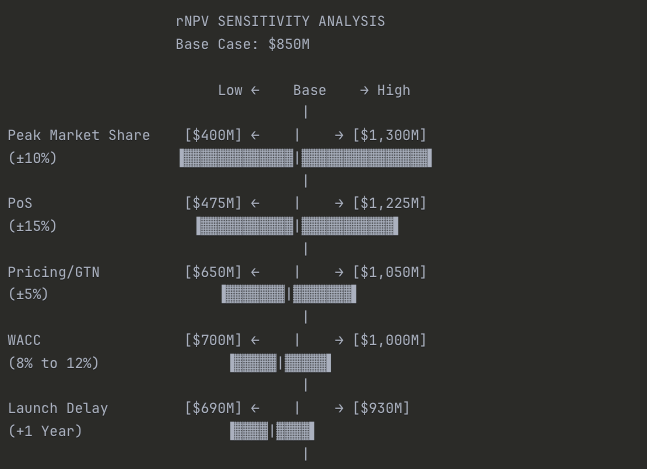
Exhibit 7.4: rNPV Sensitivity Tornado Diagram (Illustrative)
Caption: Tornado diagrams highlight the key drivers of uncertainty in an rNPV model. In this example, Peak Market Share and PoS have the largest impact on the valuation.
Summary Table:
| Variable | Low Case | Base Case | High Case | Range |
| Peak Market Share (±10%) | $400M | $850M | $1,300M | $900M |
| Probability of Success (±15%) | $475M | $850M | $1,225M | $750M |
| Pricing/GTN (±5%) | $650M | $850M | $1,050M | $400M |
| WACC (8% to 12%) | $700M | $850M | $1,000M | $300M |
| Launch Delay (+1 year) | $690M | $850M | $930M | $240M |
Key Insights:
Why it’s called a “Tornado”: The widest bars at the top taper down to narrower bars at the bottom, creating a tornado shape. This instantly shows you where your uncertainty lies.
Commercial execution matters most: Peak Market Share has the widest range ($900M swing), meaning getting the launch right—detail force effectiveness, formulary access, KOL engagement—has more valuation impact than anything else.
Clinical risk is second: PoS drives a $750M range. This is why Phase III readouts are binary events that can move biotech stocks 50%+ in a single day.
Pricing is surprisingly middle-tier: Despite all the political noise, a ±5% move in realized pricing (gross-to-net) only swings valuation by $400M. Peak share matters more than price per unit.
Financial assumptions matter less: WACC and launch timing, while important, have narrower ranges than commercial and clinical variables. Don’t spend 80% of your time debating whether WACC should be 10% or 11%—focus on the drivers that actually move the needle.
7.5 Common pitfalls in pharmaceutical valuation
- Double-Counting Indications: Ensure that patient populations for different indications of the same drug are mutually exclusive or properly overlapped.
- Unrealistic Peak Market Share: Overestimating peak penetration, especially in crowded markets. Benchmarking against historical analogues is crucial.
- Ignoring Gross-to-Net (GTN): Using list prices instead of realistic net prices. Failing to account for increasing rebates and discounts.
- Biosimilar Erosion Slope: Assuming overly optimistic (slow) erosion curves for biologics post-LOE. The Humira experience suggests erosion can be faster than historical examples if contracting is aggressive.
- Over-Generous WACC/Terminal Assumptions: Using too low a discount rate or including a terminal value for finite-life assets.
- Binary View of PoS: Assuming PoS is static. PoS should be updated dynamically based on new clinical data.
- Ignoring Platform Value: For technology-driven companies, failing to assign value to the underlying platform beyond the lead assets.
8) Publicly Traded Instruments
Investors can gain exposure to the pharmaceuticals sector through single stocks or diversified exchange-traded funds (ETFs).
8.1 Sector/industry ETFs
ETFs offer diversified exposure but may not be suitable for specific investment theses.
- XLV (Health Care Select Sector SPDR Fund): The largest healthcare ETF. Provides broad exposure to the GICS Health Care sector (Pharma, Biotech, MedTech, Services). Pharmaceuticals (352020) typically represent ~30-35% of the weight.
- Pharma-Tilted ETFs:
- PJP (Invesco Dynamic Pharmaceuticals ETF): Focuses specifically on U.S. pharmaceutical companies. Uses a quantitative methodology for stock selection.
- XPH (SPDR S&P Pharmaceuticals ETF): An equal-weighted index of U.S. pharmaceutical companies. Provides higher exposure to mid-cap names compared to market-cap-weighted indices.
- Biotech Comparables:
- IBB (iShares Biotechnology ETF): Market-cap weighted index of U.S. listed biotech companies (GICS 352010).
- XBI (SPDR S&P Biotech ETF): Equal-weighted index of biotech companies. Higher exposure to smaller, more volatile names.
Considerations for ETF Use:
- Composition and Concentration: Market-cap weighted ETFs (like XLV) can be highly concentrated in a few mega-cap names (e.g., LLY, JNJ, UNH).
- Factor Exposure: Pharma ETFs often have a “value” tilt (lower P/E, higher dividend yield) compared to Biotech ETFs, which have a “growth” tilt.
- When to Avoid ETFs: If the investment thesis is based on a specific therapeutic area (e.g., obesity, ADCs) or idiosyncratic factors (e.g., pipeline catalysts, M&A), single-stock selection is preferable.
Exhibit 8.1: ETF Composition Comparison (Illustrative)
Caption: XLV offers broad healthcare exposure, while PJP is concentrated in pharma, and IBB focuses on biotech. Weightings are illustrative as of October 2025.
Detailed Breakdown:
| ETF | Ticker | Pharma | Biotech | Other HC | Key Characteristic |
| Health Care Select Sector | XLV | 35% | 20% | 45% | Broad diversified exposure |
| Invesco Dynamic Pharma | PJP | 90% | 10% | <1% | Pure-play large-cap Pharma |
| iShares Biotechnology | IBB | 5% | 90% | 5% | Pure-play Biotech focus |
Why This Matters for Analysts:
Benchmark selection affects perceived performance: If you’re covering a large-cap pharma company, comparing its returns to IBB (90% biotech) is misleading. Use PJP or create a custom pharma-only benchmark.
Risk profiles differ dramatically:
- XLV: Balanced, lower volatility, includes MedTech/Services
- PJP: Mature earnings, dividend yield, LOE risk concentration
- IBB: High beta, binary clinical catalysts, negative cash flow for many holdings
Beta to market differs: XLV typically has a beta of 0.7-0.9 to SPY (defensive), while IBB often runs 1.2-1.5 (aggressive growth).
Different sensitivities:
- PJP: Sensitive to IRA provisions, Medicare/Medicaid policy
- IBB: Sensitive to FDA approval trends, biotech IPO market, risk appetite
When building a pharma coverage universe or constructing a sector model, make sure your peer group and benchmark actually reflect the business model you’re analyzing. Don’t accidentally compare a mature, cash-generative pharma giant to a portfolio of pre-revenue biotech startups.
8.2 Royalty/aggregator models
An alternative business model involves acquiring pharmaceutical royalties.
- Model: Companies purchase the rights to future royalty streams from inventors (universities, research institutions) or other companies.
- Pros: Diversified portfolio of assets; high operating margins; exposure to drug upside without operational or R&D execution risk.
- Cons: Lack of control over the underlying assets; reliance on partners for commercialization; competitive market for acquiring high-quality royalties.
- Key Player: Royalty Pharma (RPRX) is the dominant player in this space.
9) Secular Trends & Tech
The pharmaceutical industry is undergoing significant transformation driven by scientific innovation, technological advancements, and policy shifts.
9.1 GLP-1 diffusion and second-order effects
The success of GLP-1 agonists is the most significant secular trend in the current landscape.
- Diffusion: Expansion beyond diabetes and obesity into other large indications, driven by demonstrated benefits in cardiovascular disease (CVD), chronic kidney disease (CKD), and potentially NASH/MASH and sleep apnea.
- Second-Order Effects: The widespread adoption of effective weight-loss drugs could have significant macroeconomic implications, potentially impacting other sectors (e.g., food and beverage, bariatric surgery devices).
- Supply Constraints: Manufacturing capacity will remain a bottleneck for the next 3-5 years, limiting market growth and creating opportunities for competitors with available capacity.
9.2 Biosimilar wave 2.0
The industry is entering the second major wave of biosimilar competition, targeting blockbuster biologics in oncology and immunology.
- Key LOEs (2025-2030): Stelara (ustekinumab), Eylea (aflibercept), Keytruda (pembrolizumab), Opdivo (nivolumab).
- Net Pricing Dynamics: Increased competition and aggressive PBM contracting are driving down net prices for both reference products and biosimilars. The dynamics of the “rebate trap” are playing out, with both high-WAC (high rebate) and low-WAC (low list price) biosimilar strategies being employed.
- Impact: Significant erosion of revenue for innovator companies, requiring pipeline replacement and aggressive LCM strategies.
9.3 AI/ML in drug discovery and development
Artificial Intelligence and Machine Learning (AI/ML) are being integrated across the pharmaceutical value chain.
- Target Identification and Validation: Using genomics and proteomics data to identify novel drug targets.
- Drug Design (In Silico): Accelerating the design and optimization of small molecules and biologics.
- Clinical Trial Optimization: Improving patient stratification (biomarkers), site selection, and trial monitoring.
- Commercial Optimization: Enhancing marketing effectiveness and analyzing real-world evidence (RWE).
What’s Real vs. Hype: While AI/ML offers significant potential for improving efficiency and reducing cycle times, the impact on the fundamental probability of success (PoS) remains unproven. The ultimate validation requires prospective clinical trials. Analysts should be skeptical of claims of drastically reduced R&D costs or timelines until validated by empirical data.
9.4 Manufacturing shifts
Advancements in manufacturing technology are critical for novel modalities and improving efficiency.
- Continuous Manufacturing: Shifting from traditional batch processing to continuous processes, improving efficiency and quality.
- Antibody-Drug Conjugates (ADCs): Complex manufacturing involving the conjugation of antibodies, linkers, and cytotoxic payloads. Specialized capacity is required.
- Cell and Gene Therapy (CGT): Manufacturing personalized therapies (autologous CAR-T) is highly complex and costly. The shift towards allogeneic (off-the-shelf) therapies aims to address these challenges.
- Viral Vector Capacity: Shortage of capacity for manufacturing viral vectors (AAV, lentivirus) used in gene therapy.
9.5 Policy trajectory: IRA durability and beyond
The long-term policy environment remains uncertain.
- IRA Durability: The core provisions of the IRA (negotiation, inflation rebates) are likely durable, although modifications to the implementation process are possible.
- PBM Reform: Bipartisan support for PBM reform suggests legislative action is likely in the medium term, potentially impacting the rebate system.
- International Reference Pricing (IRP) Risks: Potential adoption of IRP models in the U.S. (linking U.S. prices to lower international prices) remains a long-term risk, although implementation faces significant hurdles.
10) Case Studies
Applying the analytical framework to specific companies illustrates the interplay of these factors.
10.1 Eli Lilly (LLY) – The Growth Engine
Model Summary: U.S.-based large-cap pharmaceutical company, historically focused on diabetes, now leading the obesity market and expanding in oncology and neurology.
Key Performance Indicators (KPIs):
- GLP-1 Franchise (Mounjaro/Zepbound) TRx/NRx: Weekly prescription trends are critical for tracking launch uptake and market share dynamics vs. Novo Nordisk.
- Manufacturing Capacity Utilization and Expansion: Updates on new facility construction (e.g., North Carolina, Indiana) are key drivers of revenue growth forecasts. Capacity constraints have been the primary bottleneck [Eli Lilly Q2 2025 Earnings Call].
- Gross-to-Net (GTN) Trends: Monitoring the impact of increased rebating required to secure market access in the competitive obesity market. GTN pressure has been increasing due to higher utilization of patient assistance programs and contracted rebates [Eli Lilly 10-Q, Q2 2025].
Near-Term Catalysts:
- Donanemab (Alzheimer’s) Launch: PDUFA date and subsequent launch trajectory. Key variables are the label (potential black box warnings), pricing, and CMS reimbursement decisions.
- Next-Generation Incretins (Retatrutide) Data: Phase III data for the triple agonist (GLP-1/GIP/Glucagon) could establish a new benchmark for efficacy.
- Label Expansion for Mounjaro/Zepbound: Data readouts and approvals in CVD, CKD, and sleep apnea.
Bear Triggers:
- Competition: Entry of new competitors in the obesity market (e.g., Amgen, Pfizer) with differentiated profiles (e.g., oral formulations, improved tolerability).
- Pricing Pressure: Greater than expected GTN erosion or policy changes (e.g., Medicare coverage for obesity linked to price concessions).
- Pipeline Failures: Failure of key pipeline assets (e.g., Donanemab regulatory hurdles, Retatrutide safety issues).
10.2 Merck (MRK) – The Concentration Risk
Model Summary: U.S.-based global pharmaceutical company with a dominant position in oncology (Keytruda) and vaccines (Gardasil).
Key Performance Indicators (KPIs):
- Keytruda (pembrolizumab) Sales Growth and Mix: Tracking growth across indications (especially NSCLC and adjuvant settings) and geographies. Keytruda accounts for ~40% of total revenue [Merck 10-K, 2024].
- Gardasil (HPV vaccine) Supply and Demand: Monitoring global uptake (especially China) and manufacturing capacity utilization.
- BD&L Execution: Integration and progress of acquired assets (e.g., Prometheus – Immunology; Acceleron – Cardiovascular).
Near-Term Catalysts:
- Subcutaneous (SC) Keytruda Development: Data readouts and regulatory filings for SC formulation, a key LCM strategy to mitigate biosimilar erosion post-2028 LOE.
- V116 (Pneumococcal Vaccine) Launch: PDUFA date and competitive positioning against Pfizer’s Prevnar franchise.
- Pipeline Readouts (Cardiovascular/Immunology): Data from Prometheus assets (PRA023) in IBD.
Bear Triggers:
- Keytruda Concentration Risk: The impending LOE of Keytruda (2028) represents the largest patent cliff in industry history. Failure to diversify revenue streams through internal R&D or BD&L is the primary risk.
- Clinical Trial Failures: Failure of key LCM trials for Keytruda or other pipeline assets.
- Competition: Unexpectedly strong performance of competing PD-1/L1 inhibitors or novel oncology mechanisms.
10.3 Vertex Pharmaceuticals (VRTX) – The Franchise Model
Model Summary: U.S.-based specialty pharmaceutical company focused on cystic fibrosis (CF) and expanding into other serious diseases.
Key Performance Indicators (KPIs):
- CF Franchise (Trikafta/Kaftrio) Penetration: Tracking uptake in younger patient populations and international markets. Market penetration is high in established markets [Vertex 10-K, 2024].
- Pipeline Diversification Progress: Milestones achieved in non-CF pipeline programs.
- R&D Expense Growth: Monitoring investment in pipeline expansion and new technologies (e.g., gene editing, cell therapy).
Near-Term Catalysts:
- Casgevy (CRISPR Gene Editing) Launch: Launch trajectory in Sickle Cell Disease (SCD) and Transfusion-Dependent Beta Thalassemia (TDT). Key variables are patient uptake, reimbursement, and manufacturing execution.
- VX-548 (Non-Opioid Pain) Data/Filing: Phase III data and regulatory filing in acute pain.13 Represents a significant market opportunity and validation of pipeline diversification.
- Next-Generation CF Combinations: Data readouts for novel combinations offering improved efficacy or convenience.
Bear Triggers:
- Competition in CF: Entry of competing therapies that challenge Vertex’s dominance (e.g., AbbVie, others).
- Pipeline Failures: Failure of key diversification programs (e.g., VX-548, Type 1 Diabetes cell therapy program).
- Pricing Pressure: Long-term pressure on CF drug pricing, particularly in international markets.
11) Toolkit for Juniors
11.1 Ten due-diligence questions
When analyzing a pharmaceutical asset or company, junior analysts should address these core questions:
- Intellectual Property (IP): What is the strength and duration of the patent portfolio (CoM, MoU, formulation)? When is the expected LOE date (considering PTE and pediatric extensions)? Are there any ongoing patent challenges (e.g., Paragraph IV filings, IPRs)?
- Clinical Profile (Efficacy/Safety): How does the drug compare to the Standard of Care (SOC) and pipeline competitors on key endpoints (OS, PFS, etc.)? Are there any significant safety signals or black box warnings?
- Market Access and Pricing (GTN): What is the expected net price? What is the formulary positioning (Tier, PA/Step Therapy)? What is the payor mix (Commercial, Medicare, Medicaid)?
- Addressable Market (Epidemiology): What is the target patient population (incidence/prevalence)? How is it segmented (biomarkers, lines of therapy)?
- Competitive Landscape (MoA): What are the competing drugs and mechanisms of action? What is the expected timing of competitive entry?
- CMC and Manufacturing: Are there any manufacturing complexities or capacity constraints (biologics, complex devices)? What is the GMP compliance status?
- Adherence and Persistence: What is the expected real-world adherence? Are there patient support programs in place?
- LOE Map and Erosion Curve: What is the expected shape of the erosion curve post-LOE (small molecule vs. biologic)? What are the LCM strategies in place?
- Pipeline (rNPV): What are the key pipeline assets? What is the probability of success (PoS)? What are the key assumptions driving the rNPV?
- Policy Risk (IRA): Is the drug eligible for IRA negotiation (9/13 years)? What is the exposure to inflation rebates and Part D redesign?
11.2 Minimal data-gathering checklist
| Document/Source | Information Sought | Link/Location |
| SEC Filings (10-K, 10-Q) | Revenue breakdown by drug/geography, R&D/SG&A expenses, patent disclosures, legal proceedings, management commentary. | SEC EDGAR |
| Investor Presentations/Transcripts | Management strategy, pipeline updates, guidance, responses to analyst questions. | Company IR website |
| FDA Orange/Purple Book | Patent expiration dates, exclusivity periods. | FDA Website |
| ClinicalTrials.gov | Clinical trial design, status, endpoints, results. | clinicaltrials.gov |
| FDA Approval Documents (Drugs@FDA) | Prescribing information (label), clinical trial data summary (SBA/SNDA). | Drugs@FDA Database |
| IQVIA/Symphony Health Data | Prescription trends (TRx/NRx), market share. | Subscription required |
| CMS Data/Announcements | Medicare spending, reimbursement rates (ASP), IRA implementation updates. | CMS.gov |
11.3 rNPV model skeleton: required inputs and formulas
Description (No Spreadsheet File):
An rNPV model requires the following structure and inputs:
Inputs (Assumptions Tab):
- Epidemiology: Incidence/Prevalence, Diagnosis Rate, Treatment Rate, Addressable Population Growth Rate.
- Market Share: Peak Market Share, Years to Peak.
- Pricing: Launch WAC, Annual Price Increase (capped by inflation), Gross-to-Net Discount (%).
- Timing: Launch Date, LOE Date.
- Costs: COGS (as % of Revenue), SG&A (as % of Revenue or fixed cost), Ongoing R&D (absolute $).
- Risk: Probability of Success (PoS) by Phase.
- Discount Rate: WACC (%).
Model Structure (Forecast Tab – by Year):
- Patient Funnel: Calculate Addressable Patients (Epidemiology Inputs).
- Market Share Ramp: Calculate Market Share based on Ramp Curve.
- Treated Patients: Addressable Patients × Market Share.
- Pricing: Calculate Net Price (WAC × (1 – GTN Discount)).
- Unadjusted Revenue: Treated Patients × Net Price. Apply Erosion Curve post-LOE.
- Unadjusted Costs: Calculate COGS, SG&A, R&D based on Inputs.
- Unadjusted EBIT: Revenue – Costs.
- Risk Adjustment: Multiply Unadjusted EBIT by Cumulative PoS.
- Discounting: Calculate Discount Factor for each year (1 / (1 + WACC)^t).
- Discounted rEBIT: Risk-Adjusted EBIT × Discount Factor.
- rNPV: Sum of Discounted rEBIT across all forecast years.
12) Conclusion: Key takeaways
- Innovation vs. Access: The pharmaceutical industry model is defined by the balance between incentivizing high-risk R&D through time-limited exclusivity and ensuring patient access and affordability.
- Primacy of IP: Intellectual property (patents and regulatory exclusivities) is the foundation of value. Loss of Exclusivity (LOE) is the most critical event in a drug’s lifecycle.
- R&D Attrition: Drug development is characterized by high costs and high failure rates (PoS). Understanding the probability of success by phase and therapeutic area is essential for pipeline valuation.
- The U.S. Pricing Ecosystem: The U.S. market is complex, characterized by a significant “gross-to-net bubble” driven by rebates and discounts. Net price realized by manufacturers is often significantly lower than the list price.
- IRA Impact: The Inflation Reduction Act (IRA) is a paradigm shift, introducing drug price negotiation and inflation penalties in Medicare, fundamentally altering the industry’s pricing power and lifecycle economics.14
- Shift to Biologics: The industry mix continues to shift towards biologics, driven by scientific advancements and favorable regulatory frameworks (longer exclusivity, slower biosimilar erosion).
- Valuation Methodology (rNPV): The risk-adjusted Net Present Value (rNPV) method is the standard for valuing pipeline assets. Rigorous, sourced assumptions regarding peak sales, pricing, PoS, and costs are critical.
- Secular Trends: The rise of GLP-1 agonists, the second wave of biosimilars, advancements in AI/ML, and evolving policy dynamics are reshaping the competitive landscape.
- Analyst Vigilance: Financial analysts must monitor a wide range regulatory calendars, policy developments, clinical data readouts, and prescription trends to effectively analyze the sector.
APPENDICES
A) Glossary
- ADC: Antibody-Drug Conjugate
- AdCom: FDA Advisory Committee
- ANDA: Abbreviated New Drug Application (for generics)
- ASP: Average Sales Price (used for Medicare Part B reimbursement)
- BLA: Biologics License Application
- BPCIA: Biologics Price Competition and Innovation Act
- CBER: Center for Biologics Evaluation and Research (FDA)
- CDER: Center for Drug Evaluation and Research (FDA)
- CMC: Chemistry, Manufacturing, and Controls
- CMS: Centers for Medicare & Medicaid Services
- CRL: Complete Response Letter (FDA rejection)
- CVR: Contingent Value Right
- EMA: European Medicines Agency
- FDA: Food and Drug Administration (U.S.)
- GICS: Global Industry Classification Standard
- GMP: Good Manufacturing Practices
- GTN (Gross-to-Net): The difference between gross sales (at list price) and net sales (after rebates/discounts).
- HTA: Health Technology Assessment
- IND: Investigational New Drug application
- IRA: Inflation Reduction Act of 2022
- LCM: Lifecycle Management
- LOE: Loss of Exclusivity
- MoA: Mechanism of Action
- NCE: New Chemical Entity
- NDA: New Drug Application
- NHE: National Health Expenditures
- NRx: New Prescriptions
- PBM: Pharmacy Benefit Manager
- PDUFA: Prescription Drug User Fee Act (FDA goal date)
- PoS: Probability of Success
- QALY: Quality-Adjusted Life Year
- REMS: Risk Evaluation and Mitigation Strategies
- rNPV: Risk-Adjusted Net Present Value
- RWE: Real-World Evidence
- SOTP: Sum-of-the-Parts
- TA: Therapeutic Area
- TRx: Total Prescriptions
- WAC: Wholesale Acquisition Cost (List Price)
B) Data sources & links
- BIO (Biotechnology Innovation Organization): Clinical Development Success Rates reports.
- CMS (Centers for Medicare & Medicaid Services): National Health Expenditure Projections, IRA implementation guidance, Medicare Part B/D data.
- Drug Channels Institute: Analysis of pharmaceutical economics and the supply chain.
- EFPIA (European Federation of Pharmaceutical Industries and Associations): The Pharmaceutical Industry in Figures.
- FASB (Financial Accounting Standards Board): Accounting Standards Updates.
- FDA (U.S. Food and Drug Administration): Orange Book, Purple Book, CDER/CBER approval reports, guidance documents, Drug Safety Communications.
- IQVIA Institute for Human Data Science: Reports on R&D trends, market access, and prescription data.
- KFF (Kaiser Family Foundation): Health policy analysis.
- MSCI/S&P Dow Jones Indices: GICS Methodology documents.
- SEC EDGAR: Company filings (10-K, 10-Q, 8-K).
- U.S. Census Bureau: Population projections.
- USPTO (U.S. Patent and Trademark Office): Patent database.
D) DisclaimerThis document is intended for educational and informational purposes. It constitutes market commentary and analysis based on publicly available information. It is not intended as, and should not be construed as, investment advice, a recommendation to buy or sell any securities, or an offer to sell or the solicitation of an offer to buy any securities. The information contained herein is accurate to the best of the author’s knowledge as of the publication date, but is subject to change without notice. Past performance is not indicative of future results. Investing in the pharmaceutical sector involves significant risks, including regulatory risk, clinical trial risk, and commercial risk.15 Readers should conduct their own due diligence and consult with a qualified financial advisor before making any investment decisions.