1. Python Stock Screener – Potential Value Stocks
If you’re looking to merge your Python skills with the world of investing, you’ve landed in the right place. This is the first post in our series dedicated to building practical financial stock screeners using Python. Stock screeners are invaluable tools; they allow us to sift through thousands of companies methodically, applying specific criteria to find stocks that warrant a closer look.
Today, we’re building a foundational tool: a Value Stock Screener.
Value Investing in a Nutshell & The Role of Screening
Value investing, famously championed by figures like Warren Buffett, is about identifying stocks trading below their perceived “intrinsic” or fair value. The core belief is that markets sometimes misprice companies due to short-term noise, investor sentiment, or simply being overlooked. Value investors aim to buy these seemingly undervalued assets, anticipating that the market will eventually recognize their true worth.
Finding these potential undervalue stocks manually across thousands of stocks is daunting. A quantitative stock screener automates the initial filtering process based on defined financial metrics, creating a focused list for deeper investigation.
Crafting Our Initial Value Screen Logic
For our first screener, we need criteria that are widely understood, readily available, and indicative (though not definitively proof) of potential value. We’ll start with:
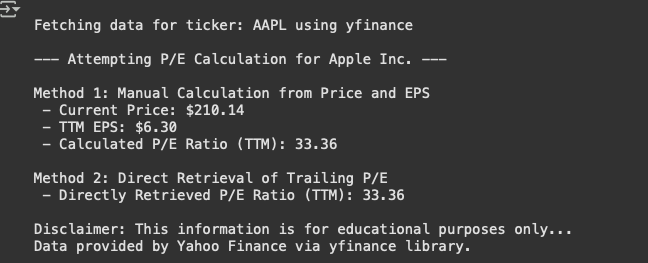
- Price-to-Earnings (P/E) Ratio < 20: This compares the stock price to its earnings per share (EPS). A lower P/E can suggest a stock is cheaper relative to its earnings power. We use the trailing P/E (based on the last 12 months of earnings).
- Context: While P/E < 20 is a common benchmark, it’s not universal. High-growth tech stocks often have much higher P/Es, while mature utility companies might have lower ones. It’s a starting point, best compared within the same industry.
- Price-to-Book (P/B) Ratio < 3: This compares the company’s market value to its book value (essentially, assets minus liabilities on the balance sheet). A P/B below 3 can indicate the market values the company not much higher than its net assets.
- Context: P/B is more relevant for asset-heavy industries (like banks or industrials) than for service or tech companies with significant intangible assets (like brand value or intellectual property) not fully captured on the balance sheet.
Why these? They provide a basic, quantifiable snapshot related to price versus earnings and assets. Critically, they are just quantitative filters. A stock passing this screen isn’t automatically a “buy” – it’s merely a candidate for further, qualitative research.
Python Implementation: Building the Screener
Let’s translate this logic into Python. We’ll leverage two essential libraries:
pandas: The cornerstone for data manipulation in Python, perfect for organizing our results.yfinance: A convenient library for downloading stock market data directly from Yahoo Finance.
(Installation reminder: pip install pandas yfinance if needed)
Here’s the Python code implementing our screener:
# Import necessary libraries
import pandas as pd
import yfinance as yf
import warnings


def screen_value_stocks(tickers):
    """
    Screens a list of stock tickers for basic value criteria (P/E < 20, P/B < 3).

    Args:
        tickers (list): A list of stock ticker symbols (strings).

    Returns:
        pandas.DataFrame: A DataFrame containing stocks that meet the criteria,
                          including Ticker, Company Name, P/E Ratio, and P/B Ratio.
                          Returns an empty DataFrame if no stocks pass.
    """
    filtered_stocks = [] # List to hold dictionaries of stocks that pass the filters

    print(f"Screening {len(tickers)} tickers...")

    # Loop through each ticker symbol
    for ticker in tickers:
        try:
            # Create a Ticker object from yfinance
            stock = yf.Ticker(ticker)

            # Fetch stock information dictionary
            info = stock.info

            # --- Define Screening Criteria Thresholds ---
            pe_ratio_threshold = 20
            pb_ratio_threshold = 3
            # -------------------------------------------

            # Safely get data using .get() to handle missing keys gracefully
            # Provide default values (e.g., infinity) that won't pass checks if data is missing
            pe_ratio = info.get('trailingPE', float('inf'))
            pb_ratio = info.get('priceToBook', float('inf'))
            company_name = info.get('shortName', 'N/A') # Also fetch the company name

            # Ensure ratios are numbers before comparison (handle None or other non-numeric types)
            if not isinstance(pe_ratio, (int, float)):
                pe_ratio = float('inf')
            if not isinstance(pb_ratio, (int, float)):
                 pb_ratio = float('inf')


            # Apply the filtering logic
            if pe_ratio < pe_ratio_threshold and pb_ratio < pb_ratio_threshold:
                # If criteria are met, store details in a dictionary
                filtered_stocks.append({
                    'Ticker': ticker,
                    'Company Name': company_name,
                    'P/E Ratio': round(pe_ratio, 2) if pe_ratio != float('inf') else 'N/A',
                    'P/B Ratio': round(pb_ratio, 2) if pb_ratio != float('inf') else 'N/A'
                })
                print(f"  [PASS] {ticker} (P/E: {pe_ratio:.2f}, P/B: {pb_ratio:.2f})")
            # Optional: Add an else block here if you want explicit 'FAIL' messages printed
            # else:
            #     print(f"  [FAIL] {ticker} (P/E: {pe_ratio:.2f}, P/B: {pb_ratio:.2f}) - Criteria not met.")

        except Exception as e:
            # Catch potential errors during data fetching for a specific ticker
            print(f"  [ERROR] Could not process {ticker}: {e}")
            continue # Move to the next ticker

    print("\nScreening complete.")

    # Convert the list of dictionaries to a pandas DataFrame for nice output
    if filtered_stocks:
        results_df = pd.DataFrame(filtered_stocks)
        # Define column order for readability
        results_df = results_df[['Ticker', 'Company Name', 'P/E Ratio', 'P/B Ratio']]
    else:
        # Create an empty DataFrame with specified columns if no stocks passed
        results_df = pd.DataFrame(columns=['Ticker', 'Company Name', 'P/E Ratio', 'P/B Ratio'])

    return results_df

# --- Main Execution Block ---
# This ensures the code below only runs when the script is executed directly
if __name__ == "__main__":
    # Define the list of stock tickers to screen
    # Tip: For larger screens, consider getting this list dynamically (e.g., S&P 500 components)
    ticker_list = [
        'AAPL', 'MSFT', 'GOOGL', 'AMZN', 'META', # Tech giants
        'JPM', 'BAC', 'WFC', # Big banks
        'PFE', 'JNJ', # Pharma
        'XOM', 'CVX', # Energy
        'WMT', 'COST', # Retail
        'INTC', 'AMD', # Semiconductors
        'F', 'GM', # Auto
        'DIS', # Entertainment
        'KO', # Consumer staples
        'RDDT' # Example of a ticker that might fail
    ]

    # Run the screener function
    value_stocks_df = screen_value_stocks(ticker_list)

    # Display the results
    print("\n--- Value Stock Screener Results ---")
    if not value_stocks_df.empty:
        # .to_string() ensures all rows/columns are printed without truncation
        print(value_stocks_df.to_string(index=False))
    else:
        print("No stocks from the list met the specified value criteria.")

    print("\nDisclaimer: This information is for educational purposes only and not financial advice.")
Dissecting the Code
- Imports & Setup: We import
pandas(aspd) andyfinance(asyf). We also importwarningsto optionally suppress non-critical messages fromyfinance. screen_value_stocksFunction: Encapsulating the logic in a function makes the code reusable and organized. It takes a list oftickersand returns a pandas DataFrame.- Initialization: An empty list
filtered_stocksis created to store the results (as dictionaries initially). - Looping & Fetching: The code iterates through each
ticker.yf.Ticker(ticker)creates an object, andstock.infofetches the data dictionary. - Robust Data Access: We use
info.get('key', default_value)(e.g.,info.get('trailingPE', float('inf'))). This is crucial because if a key (‘trailingPE’ or ‘priceToBook’) is missing in the data returned by Yahoo Finance,.get()returns the default value (float('inf')– infinity) instead of crashing the script with aKeyError. We also add a check to ensure the retrieved values are numeric before comparison. - Filtering Logic: The core
if pe_ratio < pe_ratio_threshold and pb_ratio < pb_ratio_threshold:line applies our value criteria. - Storing Results: If a stock passes, a dictionary containing its key details is appended to the
filtered_stockslist. We round the ratios for cleaner output. - Error Handling: The
try...except Exception as e:block catches general errors during the processing of a single ticker (e.g., network issues, invalid ticker symbol like ‘NONEXISTENTTICKER’) and prints an error message, allowing the loop tocontinuewith the next ticker. - DataFrame Creation: After the loop,
pd.DataFrame(filtered_stocks)converts our list of dictionaries into a structured, easy-to-read DataFrame. We explicitly define the column order. if __name__ == "__main__":Block: This standard Python practice ensures that the code for defining theticker_listand running thescreen_value_stocksfunction only executes when the script is run directly (not when it’s imported as a module into another script).- Displaying Output: The resulting DataFrame is printed using
.to_string()to avoid potential truncation of rows or columns in the console output.
Interpreting the Output
You might see something like this (data changes constantly!):
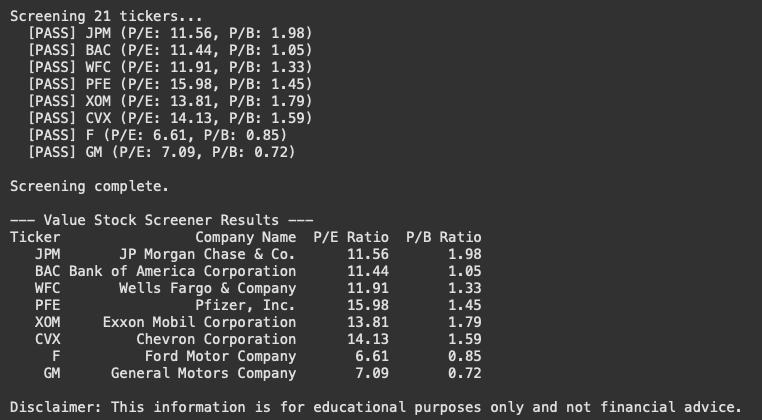
This table simply lists the stocks from our input list that met the P/E < 20 AND P/B < 3 criteria at that specific moment.
Crucial Limitations & Your Next Steps
This screener is a helpful first filter, but it’s far from a complete investment analysis:
- Beware the Value Trap: A stock might appear statistically cheap for very good reasons (declining business, poor management, industry disruption, high debt). Our simple screen doesn’t detect these qualitative risks. This is the most important limitation.
- Snapshot in Time: Market data and company fundamentals change daily.
- Limited Metrics: Relying on just P/E and P/B is overly simplistic. Other metrics (Debt-to-Equity, Free Cash Flow Yield, ROIC, etc.) provide a more holistic view.
- Industry Context Matters: Comparing a bank’s P/B to a software company’s P/B isn’t meaningful. Metrics should ideally be compared within peer groups.
- Data Isn’t Perfect: Always treat financial data with a degree of skepticism; verify from multiple sources if possible.
Actionable Next Step: Take the stocks identified by the screener and begin deeper research. Look into:
- The company’s business model and competitive advantages (its “moat”).
- Management quality and track record.
- Financial health (debt levels, cash flow trends).
- Future growth prospects and industry outlook.
Future Enhancements (Sneak Peek):
- Dynamic Ticker Lists: Instead of hardcoding, we could pull constituents of indices like the S&P 500.
- More Metrics: Incorporate profitability, debt, and cash flow metrics.
- Industry-Specific Screening: Adjust thresholds based on industry norms.
In our next post, we’ll switch gears and build a screener focused on dividend-paying stocks, looking at yield and sustainability. Stay tuned!
Disclaimer: This blog post is for educational purposes only and does not constitute investment advice. Stock screening is only one preliminary step in investment research. Always conduct thorough due diligence or consult a qualified financial advisor before making investment decisions. This blog post was drafted with the assistance of AI tools and reviewed and edited by the author.