CPI detective analyzing inflation data with Python
|

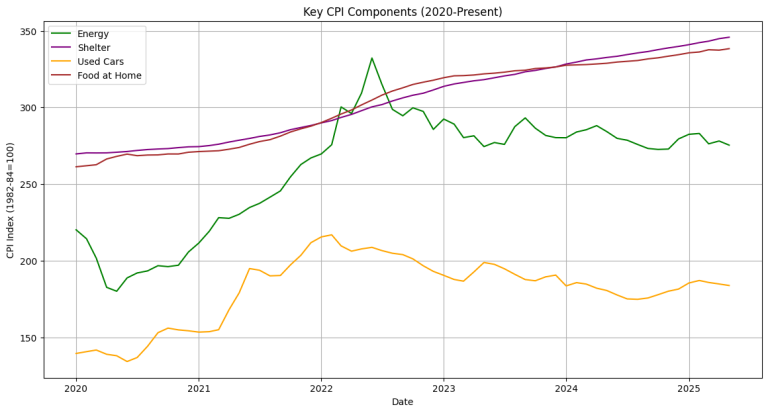
The Hook: When Your Coffee Bill Becomes a Crime Scene

Last Tuesday, I walked into my usual coffee shop and nearly choked—not on the espresso, but on the price. My regular medium latte had jumped from $3.75 to $5.25 compared to a few months back. Five dollars and twenty-five cents! For coffee! Standing there, clutching my overpriced caffeine lifeline, a question hit me: Are prices really going…

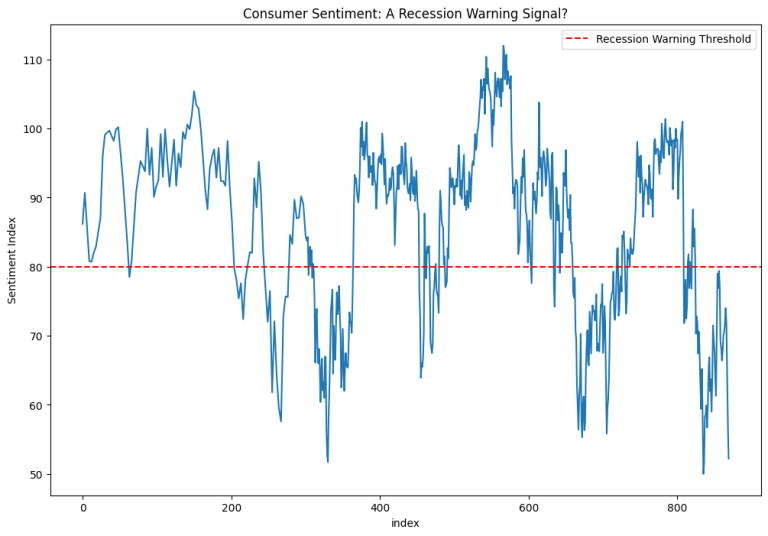
Chart showing University of Michigan Consumer Sentiment Index
|

Consumer Sentiment: When Americans Stop Believing in Tomorrow

Imagine if you could measure the collective mood of 330 million Americans about their financial future, boil it down to a single number, and use that to predict when the economy might tank. Sounds like science fiction, right? Well, welcome to the University of Michigan Consumer Sentiment Index—arguably one of the most underappreciated crystal balls…

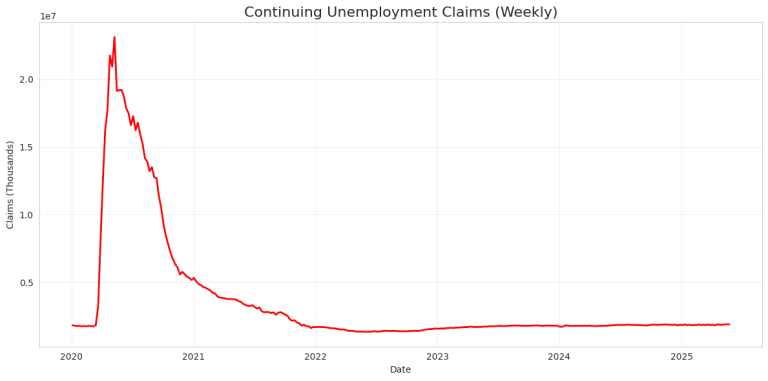
Continuing Claims Python
|

Beyond the Initial Shock: Continuing Unemployment Claims Tell the Real Story

Okay, so the check engine light—our initial unemployment claims—is blinking. We pulled the car over in our prior post, and the reading of 247,000 has us, and a lot of economists, looking under the hood with a concerned frown. But that first alert is just that: an alert. It tells you a problem just happened….

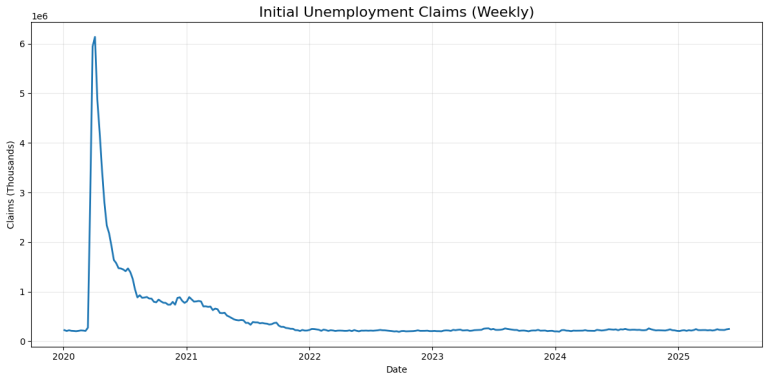
Chart showing U.S. initial unemployment claims rising to 247,000 in May 2025, the highest level in 8 months, indicating potential labor market softening
|

Initial Unemployment Claims: The Economic Canary in the Coal Mine

Picture this: You’re driving down the highway, and your car’s check engine light starts blinking. Do you ignore it and keep cruising? Or do you pull over to investigate before your engine seizes up completely? Initial unemployment claims are basically the economy’s check engine light—and right now, that light is blinking pretty frantically. The latest…

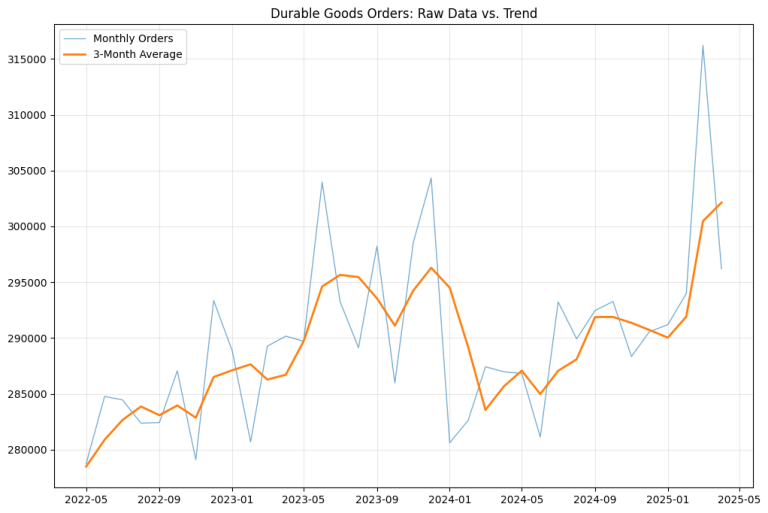
Durable Goods Orders Analysis: Manufacturing Volatility Signals Economic Uncertainty in 2025
|

Durable Goods Orders Analysis: Manufacturing Volatility Signals Economic Uncertainty in 2025

If the Conference Board LEI is the economy’s smoke detector, then durable goods orders are like your neighbor’s car alarm—loud, attention-grabbing, and going off at seemingly random times, but occasionally signaling something actually important is happening. Welcome back to our deep dive into U.S. economic indicators, where we decode the signals that Wall Street obsesses…

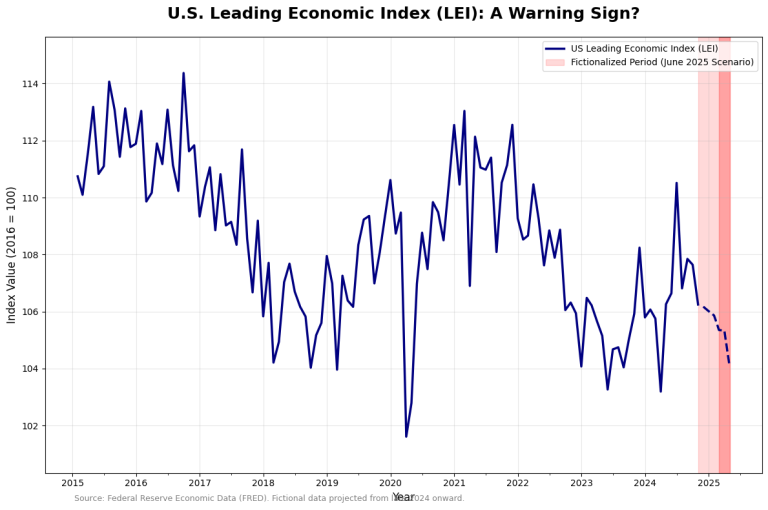
A line chart showing the U.S. Leading Economic Index (LEI) from 2015 to April 2025, with a sharp drop highlighted in red at the end of the chart, signaling a potential economic slowdown.
|

Decoding the Data: What the U.S. Leading Economic Indicators Are Really Telling Us (Part 1)

Alright, let’s talk about the economy. If you’re like me, you hear a dizzying cloud of data points every day—GDP this, inflation that. It feels like trying to read tea leaves in a hurricane. But what if we had a better way to see where things might be headed? Enter the U.S. Leading Economic Indicators…

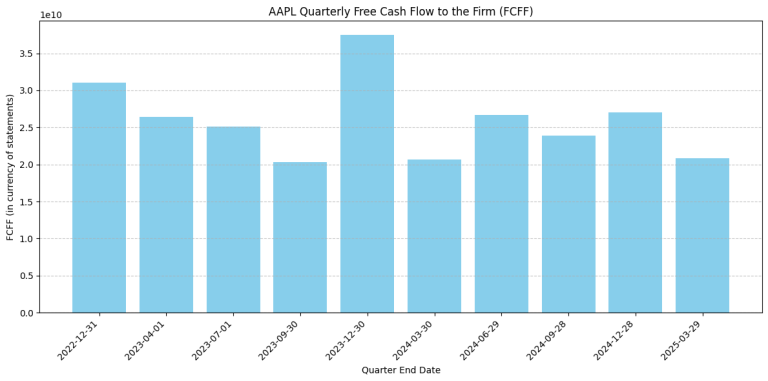
calculate FCF with Python
|

10. Python for Fundamental Analysis: Calculating Free Cash Flow with Python

Welcome to the 10th post in our Python for Finance series! We’ve covered significant ground, from ratios to qualitative analysis. Catch up here: Now, we pivot towards valuation, starting with a cornerstone metric for Discounted Cash Flow (DCF) analysis: Free Cash Flow (FCF). FCF represents the cash generated by a company after accounting for all operational needs and…

Earning call sentiment python
|

9. Python for Fundamental Analysis: Gauge Market Tone with NLP Sentiment Analysis

Hello again, and welcome to the eighth installment of the Python for Finance series! We’ve journeyed from basic ratios to complex data retrieval and even dipped our toes into qualitative analysis by fetching earnings call transcripts and doing basic keyword searches. Catch up on the series here: In Post 8, we saw that keyword counts lack nuance…

Earnings call with Python
|

8. Python for Fundamental Analysis: Unlock Insights with Earnings Call Transcript Analysis

Welcome back to the Python for Fundamental Analysis series! We’ve built a strong quantitative toolkit over the last posts: While numbers are essential, they don’t capture management strategy, competitive dynamics, outlook, or the nuances behind performance. For this, we turn to qualitative sources, and one of the richest is the earnings call transcript. These quarterly calls offer direct…

Peer analysis python
|

7. Python for Fundamental Analysis: Automate Peer Company Analysis & Benchmarking

Welcome back to the Python for Fundamental Analysis series! We’ve built a solid foundation by calculating individual metrics and ratios for single companies. Check out the previous posts: Analyzing a company in isolation, however, only tells part of the story. Is a P/E ratio of 25 high or low? Is a Net Profit Margin of 15% good…