Understanding the Dance Between Short and Long-Term Interest Rates: A 30-Year Perspective
The relationship between short-term and long-term interest rates tells a fascinating story about economic cycles, monetary policy, and market expectations. Over the past three decades, we’ve witnessed several distinct patterns that shed light on how these rates interact, particularly during periods of monetary easing and tightening.
The Historical Pattern
Traditionally, long-term rates tend to be higher than short-term rates, creating what’s known as a “normal” yield curve. This makes intuitive sense: investors typically demand higher compensation for locking up their money for longer periods. However, our 30-year analysis reveals some intriguing dynamics that challenge this conventional wisdom.
Short-Term Rate Cuts and Long-Term Yield Response
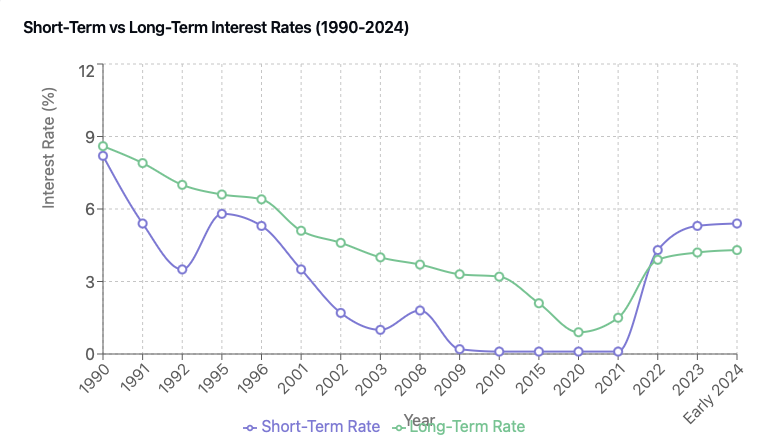
One of the most reliable patterns observed over the past three decades is the response of long-term yields to short-term rate cuts. When the Federal Reserve begins lowering short-term rates, long-term yields typically follow suit within 2-3 months, though usually with less magnitude. This relationship has held true across different economic cycles – from the 1990s recession to the 2008 financial crisis and the 2020 pandemic response. However, the long-term yield decline tends to be about 50-70% of the short-term rate drop, reflecting the market’s forward-looking nature and longer-term inflation expectations. This pattern suggests that investors watching for Fed pivot signals should anticipate some lag time before seeing significant movement in long-term yields.
The Short term rates represent the Federal Funds rate. We can find the data in the FRED site. For the Long term, we use the 10-Year Treasury Constant Maturity Rate which can also be extracted from the FRED.
Key Periods and Patterns
The 1990s: Traditional Relationships

During the early 1990s recession, we observed a classic pattern: as the Federal Reserve cut short-term rates aggressively (from 8.2% to 3.5%), long-term rates declined more gradually, maintaining a positive spread. This illustrates the market’s belief in eventual economic recovery and higher future rates.
- Short rates plummeted 4.7 percentage points (8.2% to 3.5%)
- Long rates declined 2.3 percentage points over 15 months
- The long-term rate decline was approximately 49% of the short-term cut
- Long rates began responding about 2 months after the initial cuts
This cycle demonstrates the classic relationship where long rates follow short rates down, but with less magnitude and a slight delay.
The Tech Bubble and 2000s
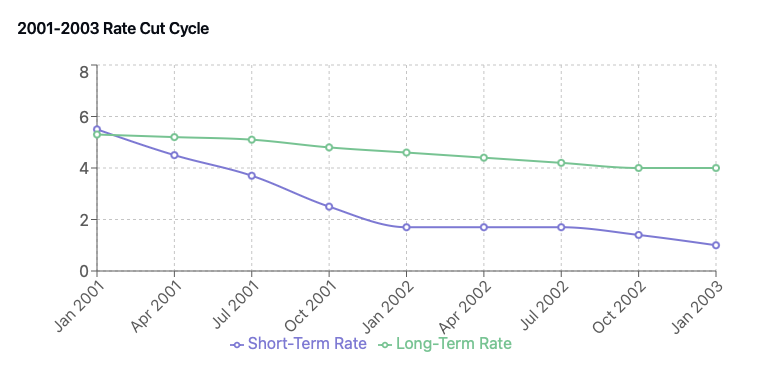
The aftermath of the tech bubble (2001-2003) showed similar dynamics but at lower levels. Short-term rates plunged to 1%, while long-term rates maintained a significant premium, settling around 4%. This spread reflected both confidence in long-term economic growth and inflation expectations.
- Short rates dropped 4.5 percentage points (5.5% to 1.0%)
- Long rates fell 1.3 percentage points over 15 months
- The response ratio decreased to 29% of the short-term cut
- Long rates began moving almost immediately but at a more measured pace
This cycle marked a shift toward more modest long-term rate responses, possibly reflecting changing market structures and inflation expectations.
The Global Financial Crisis
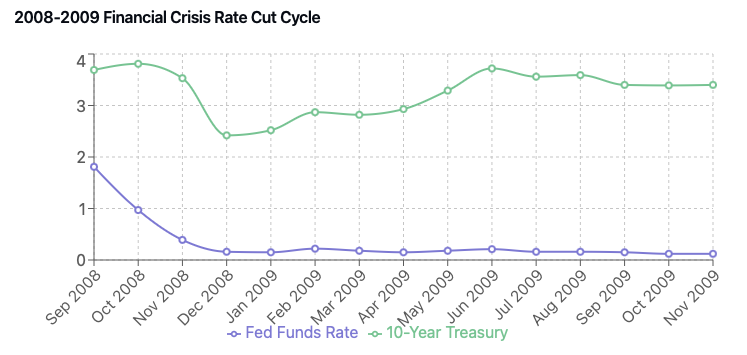
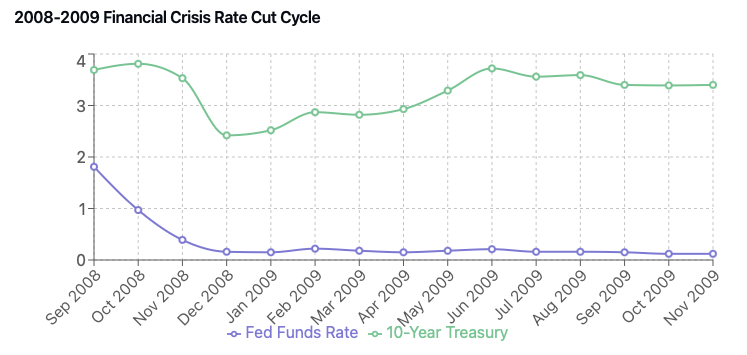
The 2008-2010 period marked new territory. Short-term rates hit near-zero levels for the first time in modern history, while long-term rates, though declining, maintained a level above 3%. This persistent spread highlighted the market’s expectation that the zero-rate policy wouldn’t last indefinitely.
- Short rates fell 1.9 percentage points (2.0% to 0.1%)
- Long rates declined 0.5 percentage points over 15 months
- The long-term response was about 26% of the short-term movement
- A roughly 3-month lag before significant long-term rate movement
This period demonstrated how crisis conditions can affect the traditional relationship, with long rates showing more resistance to decline.
The Pandemic Era and Beyond (2020-2024)
The most recent major cycle showed yet another pattern:
- Short rates dropped 1.4 percentage points (1.5% to 0.1%)
- Long rates initially fell 0.8 percentage points before rising
- The initial response was about 57% of the short-term cut
- Nearly immediate long-term rate response due to crisis conditions
This cycle highlighted how modern crisis response can compress the traditional lag times in rate movements.
Key Insights
- Asymmetric Movement: Long-term rates consistently show less volatility than short-term rates. This “anchoring” effect suggests that long-term economic expectations change more slowly than immediate monetary policy needs.
- Declining Trend: Over the 30-year period shown in the first chart of the post, both short and long-term rates have trended downward, reflecting structural changes in the economy and lower inflation expectations.
- Compression of Spreads: The difference between short and long-term rates has generally narrowed over time, particularly during stress periods.
- Policy Impact: While the Fed directly controls short-term rates, its influence on long-term rates is more nuanced and filtered through market expectations.
- Response Magnitude: Long-term rate drops typically range from 25-60% of short-term cuts, though this relationship has varied over time.
- Diminishing Effects: The relationship becomes less pronounced at lower rate levels, suggesting possible “lower bound” effects on long-term rates.
- Historical Evolution: More recent cycles show less dramatic long-term rate movements, possibly reflecting changes in market structure and monetary policy effectiveness.
What This Means for Investors and the Economy
The current environment of inverted yields (2023-24) signals market skepticism about the sustainability of high rates. Historical patterns suggest that such inversions often precede economic slowdowns, though the timing can vary significantly.
Understanding these patterns has crucial implications:
- Investment Strategy: The lag in long-term rate responses provides a window for portfolio repositioning during policy shifts.
- Risk Management: The varying magnitude of long-term rate responses suggests the need for dynamic hedging strategies.
- Economic Implications: The decreasing effectiveness of rate cuts on long-term yields may impact monetary policy transmission.
Looking Forward
While historical patterns provide valuable context, the current environment presents unique challenges. The combination of persistent inflation concerns, high government debt levels, and structural economic changes suggests that traditional relationships may continue to evolve.
The next few years will be crucial in determining whether recent anomalies represent a temporary deviation or a more permanent shift in the relationship between short and long-term rates.


