4. Python Screener for Growth, Value and Momentum stocks
In our journey through building Python stock screeners, we’ve looked at value, dividends, and pure growth strategies individually. But what if you want the best of both worlds? This post dives into multi-factor stock screening with Python, demonstrating how to combine criteria – specifically creating a Growth at a Reasonable Price (GARP) screener and adding a basic technical trend filter.
Why Combine Screening Factors? GARP Explained
Screening for just one factor (like low P/E or high growth) can sometimes lead you to extremes: deeply undervalued but potentially struggling companies, or rapidly growing but extremely expensive stocks. Multi-factor screening aims for a more balanced approach.
Growth at a Reasonable Price (GARP) is a popular strategy that seeks companies offering solid earnings growth but trading at sensible valuation levels. It’s a hybrid approach, trying to avoid the potential pitfalls of pure value (value traps) and pure growth (overpaying).
Our GARP + Trend Screener Logic
To implement our GARP screener, we’ll combine metrics we’ve used before and add a new technical layer:
- Earnings Growth (> 10%): We still want companies demonstrating strong bottom-line growth. We’ll use the
earningsGrowthkey fromyfinance. - Price-to-Earnings (P/E) Ratio (< 25): We need a valuation check. We’ll use the
trailingPE. We set the threshold slightly higher than in our pure value screen (In the prior Post, we used a value of less than 20) to allow for the premium often associated with growth, but still aiming for a “reasonable” price. - Price > 50-Day Simple Moving Average (SMA): This is our technical filter. The 50-day SMA is the average closing price of the stock over the last 50 trading days. If the current price is above the 50-day SMA, it suggests the stock is in a short-to-medium term uptrend, potentially adding a layer of momentum confirmation to our fundamental criteria.
Our goal: Find stocks with good earnings growth, that aren’t excessively expensive, and are showing positive near-term price momentum. This is a practical example of how to combine fundamental and technical analysis in a Python screener.
Python Implementation: Building the GARP + SMA Screener
We’ll need pandas and yfinance. The key difference here is fetching historical price data to calculate the SMA.
Let’s look at the Python code for a GARP stock screener with an SMA filter.
# Import necessary libraries
import pandas as pd
import yfinance as yf
import warnings

# Ignore specific warnings from yfinance if necessary (optional)
warnings.filterwarnings("ignore", category=FutureWarning)
warnings.filterwarnings("ignore", message="Passing literal json to 'read_json' is deprecated")
# Suppress SettingWithCopyWarning which can sometimes appear with rolling calculations
pd.options.mode.chained_assignment = None # default='warn'

def screen_garp_sma_stocks(tickers):
    """
    Screens a list of stock tickers for GARP (Growth at a Reasonable Price)
    criteria combined with a simple moving average (SMA) trend filter.

    Args:
        tickers (list): A list of stock ticker symbols (strings).

    Returns:
        pandas.DataFrame: A DataFrame containing stocks that meet the criteria.
                          Returns an empty DataFrame if no stocks pass.
    """
    filtered_stocks = [] # List to hold stocks that pass the filters

    print(f"Screening {len(tickers)} tickers for GARP + SMA criteria...")

    # --- Define Screening Criteria ---
    min_earnings_growth = 0.10 # Minimum 10% earnings growth
    max_pe_ratio = 25.0      # Maximum P/E ratio
    sma_window = 50          # Window for the Simple Moving Average
    history_period = "3mo"   # How much historical data to fetch for SMA calculation
    # ---------------------------------

    # Loop through each ticker symbol
    for ticker in tickers:
        try:
            # Create a Ticker object
            stock = yf.Ticker(ticker)

            # Fetch stock information (for P/E, Growth)
            info = stock.info

            # --- Get Fundamental Metrics ---
            earnings_growth = info.get('earningsGrowth')
            pe_ratio = info.get('trailingPE')
            company_name = info.get('shortName', 'N/A')

            # --- Get Technical Metrics (Price & SMA) ---
            current_price = None
            sma_value = None
            try:
                # Fetch historical data
                hist = stock.history(period=history_period)

                # Check if enough data exists for SMA calculation
                if len(hist) < sma_window:
                    print(f"  [INFO] {ticker} - Skipped SMA check (Insufficient history: {len(hist)} days)")
                    continue # Not enough data, skip to next ticker

                # Calculate the Simple Moving Average
                hist[f'SMA_{sma_window}'] = hist['Close'].rolling(window=sma_window).mean()

                # Get the latest closing price and SMA value
                current_price = hist['Close'].iloc[-1]
                sma_value = hist[f'SMA_{sma_window}'].iloc[-1]

            except Exception as e:
                print(f"  [ERROR] {ticker} - Could not fetch history or calculate SMA: {e}")
                continue # Skip if history/SMA fails

            # --- Apply the Combined Filtering Logic ---
            passes = False
            reason = []

            # Check fundamental data availability
            if earnings_growth is None: reason.append("No earnings growth data")
            if pe_ratio is None: reason.append("No P/E data")
            # Check technical data availability
            if current_price is None or sma_value is None: reason.append("SMA calculation failed")

            # If all data is available, check criteria
            if earnings_growth is not None and pe_ratio is not None and current_price is not None and sma_value is not None:
                if earnings_growth > min_earnings_growth:
                    if 0 < pe_ratio < max_pe_ratio: # P/E must be positive and below threshold
                        if current_price > sma_value:
                            passes = True
                        else: reason.append(f"Price {current_price:.2f} <= SMA_{sma_window} {sma_value:.2f}")
                    else: reason.append(f"P/E {pe_ratio:.2f} not in (0, {max_pe_ratio})")
                else: reason.append(f"Earnings Growth {earnings_growth*100:.2f}% <= {min_earnings_growth*100:.1f}%")

            # --- Store Results ---
            if passes:
                filtered_stocks.append({
                    'Ticker': ticker,
                    'Company Name': company_name,
                    'Earnings Growth': f"{earnings_growth * 100:.2f}%",
                    'P/E Ratio': round(pe_ratio, 2),
                    'Current Price': round(current_price, 2),
                    f'SMA_{sma_window}': round(sma_value, 2)
                })
                print(f"  [PASS] {ticker} (Growth: {earnings_growth*100:.2f}%, P/E: {pe_ratio:.2f}, Price: {current_price:.2f} > SMA: {sma_value:.2f})")
            else:
                 print(f"  [FAIL] {ticker} - {' | '.join(reason) if reason else 'Criteria not met or data missing.'}")


        except Exception as e:
            # Handle potential errors during basic info fetching
            print(f"  [ERROR] Could not process {ticker} basic info: {e}")
            continue # Skip to the next ticker

    print("\nScreening complete.")

    # Convert the list of dictionaries to a pandas DataFrame
    if filtered_stocks:
        results_df = pd.DataFrame(filtered_stocks)
        # Define column order
        cols = ['Ticker', 'Company Name', 'Earnings Growth', 'P/E Ratio', 'Current Price', f'SMA_{sma_window}']
        results_df = results_df[cols]
    else:
        results_df = pd.DataFrame(columns=['Ticker', 'Company Name', 'Earnings Growth', 'P/E Ratio', 'Current Price', f'SMA_{sma_window}'])

    return results_df

# --- Main Execution ---
if __name__ == "__main__":
    # Define the list of stock tickers to screen
    ticker_list = [
        'AAPL', 'MSFT', 'GOOGL', 'AMZN', 'META', 'NVDA', # Tech / Growth
        'TSLA', # EV / Growth
        'JPM', 'BAC', # Banks
        'PFE', 'JNJ', 'LLY', # Pharma
        'XOM', 'CVX', # Energy
        'WMT', 'COST', # Retail
        'INTC', 'AMD', # Semiconductors
        'F', 'GM', # Auto
        'DIS', 'NFLX', # Entertainment
        'KO', 'PEP', # Consumer staples
        'CRM', 'ADBE', # Software
        'RDDT' # Example fail case
    ]

    # Run the screener function
    garp_sma_stocks_df = screen_garp_sma_stocks(ticker_list)

    # Display the results
    print("\n--- GARP + SMA Stock Screener Results ---")
    if not garp_sma_stocks_df.empty:
        print(garp_sma_stocks_df.to_string(index=False))
    else:
        print(f"No stocks met the specified GARP + SMA criteria "
              f"(Earnings Growth > {min_earnings_growth*100:.1f}%, "
              f"0 < P/E < {max_pe_ratio}, Price > SMA_{sma_window}).")

    print("\nDisclaimer: This information is for educational purposes only and not financial advice.")
Code Explanation
- Imports & Setup: Standard imports of
pandas,yfinance, and warning suppression. screen_garp_sma_stocksFunction: Encapsulates the logic.- Tickers & Storage: Define
tickersand initializefiltered_stocks. - Looping & Basic Info Fetching: Iterate through tickers, create
yf.Ticker, fetchinfo. - Fetching Fundamental Metrics: Safely get
earnings_growth,pe_ratio, andcompany_nameusing.get(). - Fetching Historical Data & Calculating SMA:
stock.history(period="3mo"): We fetch the last 3 months of historical price data. We need enough data to calculate a 50-day SMA (approx. 2 months of trading days). Fetching 3 months provides a buffer.if len(hist) < 50:: Check if we actually received enough historical data points. If not, we can’t calculate the SMA and skip this ticker.hist['SMA_50'] = hist['Close'].rolling(window=50).mean(): This is the core pandas calculation. We select the ‘Close’ price column, use the.rolling()method with awindowof 50 days, and calculate themean()for that window. This creates a new ‘SMA_50’ column.current_price = hist['Close'].iloc[-1]: Get the most recent closing price from the historical data.sma_50 = hist['SMA_50'].iloc[-1]: Get the latest calculated 50-day SMA value.
- Applying Combined Filters:
- Define thresholds:
min_growth,max_pe,sma_window=50. - The
ifcondition now checks multiple things:- Data availability (
earnings_growth is not None,pe_ratio is not None,sma_50 is not None). - Growth criterion (
earnings_growth > min_growth). - Value criterion (
pe_ratio < max_peandpe_ratio > 0to avoid negative P/E). - Technical criterion (
current_price > sma_50).
- Data availability (
- Define thresholds:
- Storing Results: If all conditions are met, append the Ticker, Name, Earnings Growth, P/E Ratio, Current Price, and 50-Day SMA to
filtered_stocks. Growth is formatted as %, others are rounded. - Error Handling: Includes
try-exceptblocks for fetchinginfoand calculating SMA, printing informative messages on failure. - DataFrame & Output: Convert the list to a DataFrame and display the results.
Interpreting the Python screener Output
Running this Python script combining GARP and SMA filters produce:
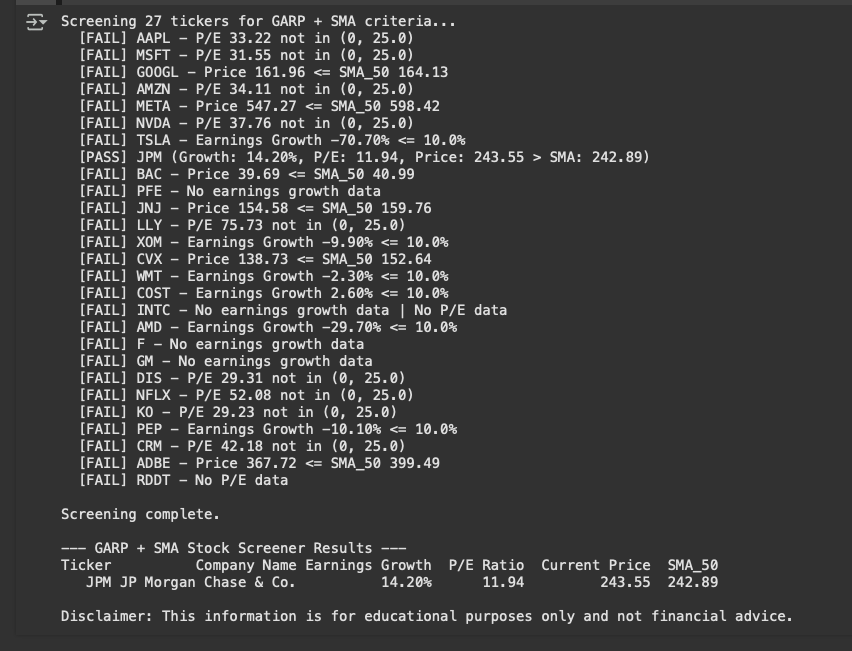
This table shows stocks that passed all criteria: >10% earnings growth, P/E between 0 and 25, and the current price was above the 50-day moving average at the time of screening.
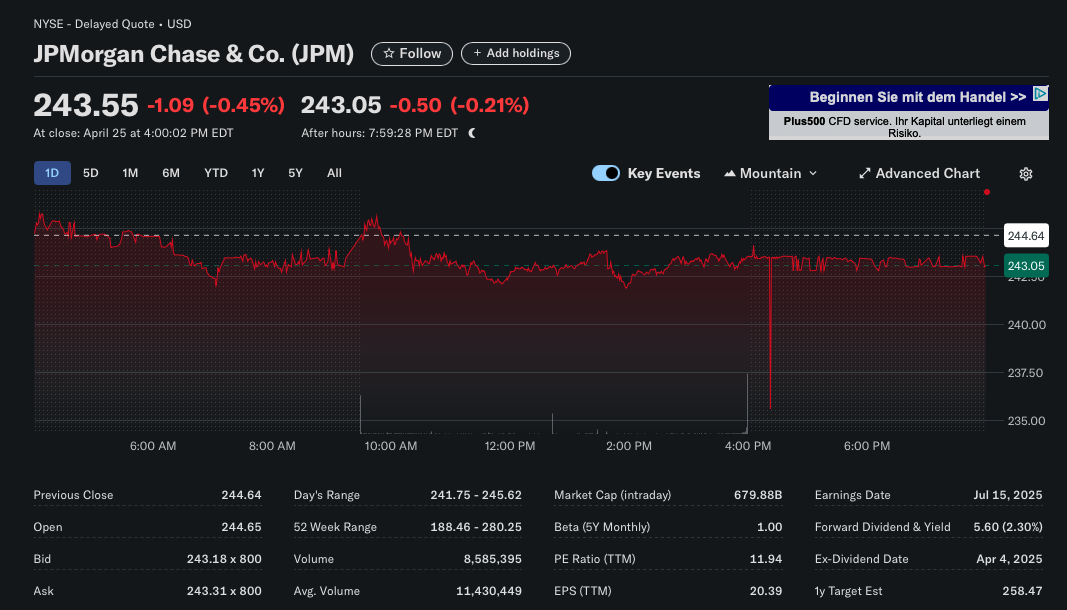
Most stocks failed to meet all the required criteria. The output helpfully tells you why each one failed. Only one stock, JPM (JP Morgan Chase & Co.), successfully met all the criteria simultaneously:
- Its Current Price (243.55) was greater than its 50-day SMA (242.89).
- Its Earnings Growth was 14.20% (which is > 10%).
- Its P/E Ratio was 11.94 (which is > 0 and < 25).
It is recommended to have a Quick Look at the financials in Yahoo finance or any other platform to double check that the output provided by the Python screener is accurate. P/E ratio and current price seems to be accurate as per below screenshot from Yahoo Finance. However, I could not find a the same earnings growth in Yahoo finance as provided by the screener. In this case, the screener may be more robust if we were to use a financial API.

Limitations and Wrapping Up the Series
This GARP + SMA screener is more sophisticated, but still has limitations:
- Parameter Sensitivity: The results heavily depend on the chosen thresholds (10% growth, P/E < 25, 50-day SMA). These aren’t magic numbers and may need adjustment based on market conditions or industry.
- SMA Lag: Moving averages are lagging indicators; they tell you about the past trend, not necessarily the future.
- Data Nuances: Remember the potential inconsistencies in
yfinanceinfodata. Calculating growth directly from financials might be more robust for critical applications. - Still Not Investment Advice: This tool helps narrow down possibilities, but deep fundamental analysis is crucial before investing.
- This screener doesn’t incorporate forward-looking estimates or expectations, which can be crucial for assessing investment potential. A company might have great past numbers but poor future prospects (or vice-versa), which this specific screener wouldn’t capture.
Where to Go Next?
This series demonstrated building basic screeners with yfinance and pandas. You could expand on this by:
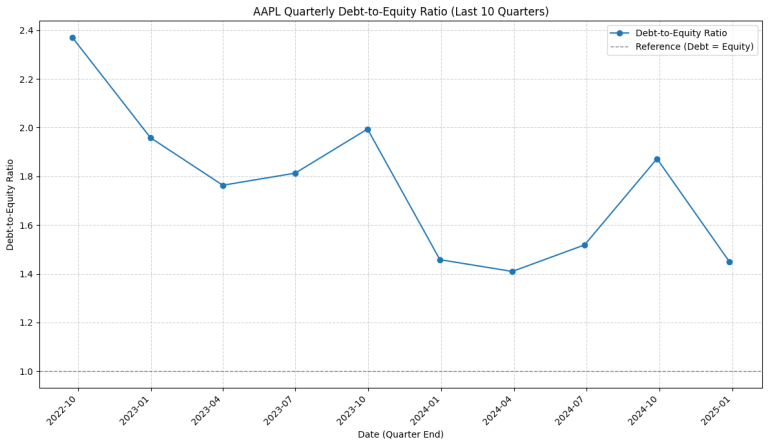
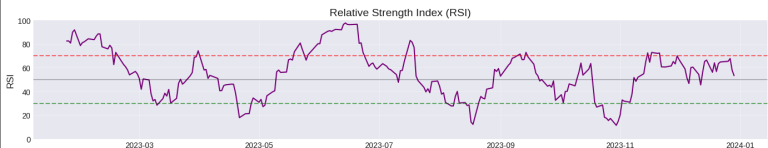
- Adding More Factors: Incorporate debt levels, return on equity (ROE), analyst ratings, or different technical indicators (RSI, MACD).
- Using Dedicated APIs: Explore robust financial data APIs like Financial Modeling Prep, Alpha Vantage, or IEX Cloud for more reliable and comprehensive data (often requiring API keys and potentially subscriptions).
- Backtesting: Test how these screening strategies might have performed historically (a complex but valuable exercise).
- Visualization: Use libraries like Matplotlib or Seaborn to visualize screener results or stock data.
We hope this series provided a solid foundation for using Python for stock screening and sparked your interest in applying programming skills to financial analysis!
Disclaimer: This educational content is for informational purposes only and does not constitute financial or investment advice. Always conduct thorough due diligence and consider consulting a qualified financial advisor. This blog post was drafted with the assistance of AI tools and reviewed and edited by the author.