Rate Cutting Cycles: A Deep Dive into SPY, XLU, and TLT Performance
Background: What to Expect When Rates Start Declining
When the Federal Reserve begins cutting interest rates, investors often scramble to position their portfolios optimally. This post examines the historical performance of three key assets during rate-cutting cycles: the S&P 500 (SPY), Utilities Sector (XLU), and Long-Term Treasury Bonds (TLT). Understanding these patterns can provide valuable insights for portfolio positioning in future rate-cutting environments.
Historical Cycle Analysis
2001-2003: The Dot-Com Aftermath
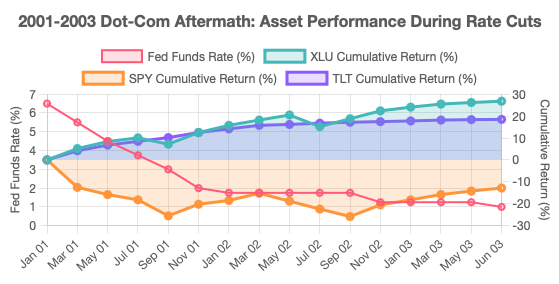
During this period, the Fed cut rates from 6.5% to 1.0% over 30 months. This cycle return for the three assets were as follows:
- XLU: +26.8%
- SPY: -12.8%
- TLT: +18.5%


This period serves as a classic example of how defensive assets can outperform during a gradual rate-cutting cycle accompanied by market stress. The measured pace of cuts and persistent economic uncertainty created ideal conditions for both utilities and Treasury bonds, while equities struggled to find footing amid multiple challenges.
2007-2009: The Global Financial Crisis
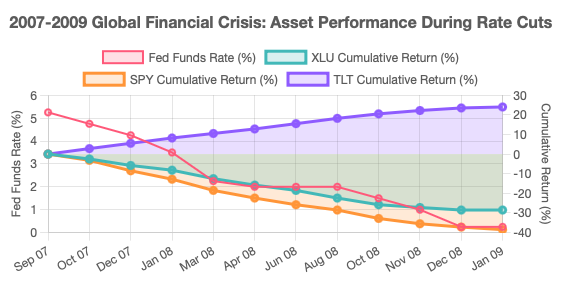
This aggressive cutting cycle saw rates drop from 5.25% to 0.25% in just 16 months:
- XLU: -28.5%
- SPY: -38.5%
- TLT: +24.0%
During this systemic crisis, even defensive sectors suffered, though less than the broader market. TLT emerged as the true safe haven, demonstrating the value of government bonds during severe market stress.

Below are some of the key Differences from 2001-2003 Cycle:
- Speed of rate cuts (31.3 bps/month vs 18.3 bps/month)
- Breakdown of traditional defensive characteristics
- Higher correlations among equity sectors
- More pronounced flight to quality (Treasuries)

And we can also visualize some of the risk carachteristics of this cycle on the different assets classes:

This period demonstrates how systemic financial crises can override traditional defensive characteristics of utilities, making Treasury bonds the only reliable safe haven. The speed and magnitude of rate cuts served as an indicator of crisis severity rather than a stabilizing force for markets. Lessons for Similar Environments: 1. Systemic risk overwhelms sector-specific characteristics, 2. Traditional defensive sectors may not provide expected protection, 3. Treasury bonds become crucial portfolio stabilizers, 4. Speed of rate cuts can signal severity of crisis.
2019-2020: The COVID-19 Pandemic
A unique cycle with rates falling from 2.5% to 0.25%:
- XLU: -1.2%
- SPY: +16.8%
- TLT: +15.5%


This cycle demonstrated how a non-financial crisis combined with unprecedented policy response can create unique market dynamics that deviate significantly from historical patterns. The traditional defensive characteristics of utilities were overshadowed by the growth/tech leadership in the recovery phase, while Treasuries provided their protective benefits primarily during the acute crisis period.
Portfolio Positioning Strategy
Current Market Application (2023-2024)
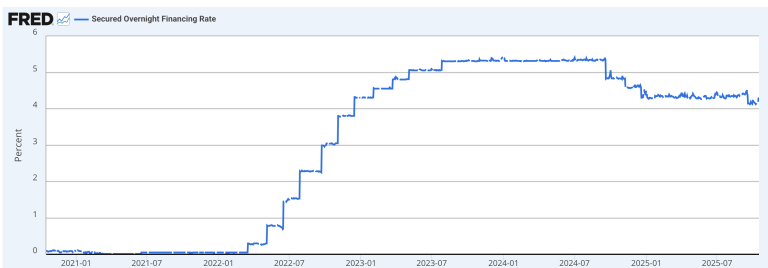
With the Fed potentially beginning a new cutting cycle from 5.5%, historical patterns suggest:
- Strategic Allocation
- Core Position: 40-50% TLT (based on historical consistency)
- Tactical Position: 20-30% XLU (monitoring cut pace)
- Growth Component: 20-40% SPY (based on economic indicators)
- Risk Management
- Monitor inflation trends for TLT exposure
- Track utility sector fundamentals
- Evaluate economic growth trajectory
- Timing Considerations
- Consider building positions before official cut announcements
- Phase in allocations during periods of market volatility
- Maintain flexibility to adjust based on cut trajectory
Conclusion
Historical analysis suggests that while TLT has been the most reliable performer during rate-cutting cycles, a diversified approach incorporating all three assets can provide optimal risk-adjusted returns. The current environment, starting from elevated rates, historically has favored both TLT and XLU, while SPY performance will likely depend on broader economic conditions.
Disclaimer
This analysis is for informational purposes only and should not be considered financial advice. Past performance does not guarantee future results. All investments carry risk, and individual circumstances, investment objectives, and time horizons should be considered with a qualified financial advisor before making investment decisions. The data presented is believed to be accurate but cannot be guaranteed. Market conditions change, and historical patterns may not repeat.
*Data Sources:
- Interest rate data: Federal Reserve Economic Data (FRED)
- Asset price data: Yahoo Finance, Bloomberg
- Period returns: Total return including dividends
- Analysis periods: Based on Federal Reserve rate cutting cycles
- All calculations performed using daily closing prices*


