Housing’s Tale of Two Markets: Starts vs. Permits Divergence
Welcome to the economic equivalent of a rom-com plot twist. In April 2025, the U.S. housing market decided to defy conventional wisdom by having housing starts rise 1.6% to 1.361 million units while building permits—which are supposed to predict future starts—fell 4.7% to 1.412 million units. It’s like having your GPS tell you to turn left while the road signs point right.
This divergence isn’t just a statistical quirk; it’s a window into the complex psychology of the housing market and a preview of what’s coming down the residential construction pipeline. For Python enthusiasts tracking economic indicators, housing data offers some of the richest and most actionable insights available—if you know how to read the signals.
The Housing Market’s Crystal Ball Problem
Here’s Housing Economics 101: building permits are supposed to be a leading indicator of housing starts, which are themselves a leading indicator of economic activity. The logic is beautifully simple—developers get permits before they break ground, so permit activity should predict construction activity, which should predict economic momentum.
In a perfect world, the relationship looks like this: permits ↑ → starts ↑ → construction jobs ↑ → economic growth ↑. But April 2025 threw us a curveball that would make a baseball pitcher jealous.
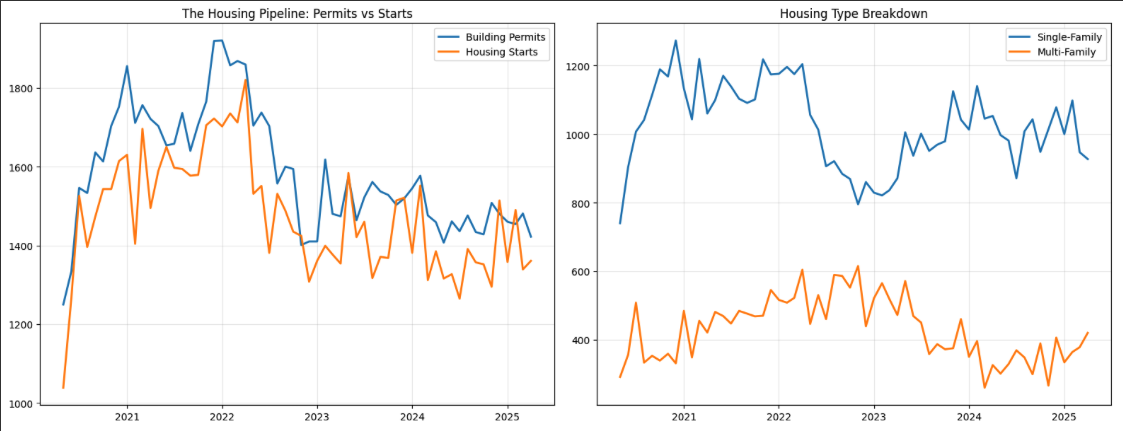
Housing starts climbed 1.6% to 1.361 million annualized units, driven entirely by multi-family construction, which surged 10.7%. Meanwhile, single-family starts—the bread and butter of the housing market—actually declined 2.1%. It’s like the housing market is saying, “We need more apartments, but we’re not so sure about those picket-fence dreams.”
On the permits side, the story gets more concerning. Total permits fell 4.7% to 1.412 million units, with declines in both single-family (-5.1%) and multi-family (-3.7%) segments. This suggests builders are getting increasingly nervous about future demand, even as they’re working through their existing backlog.
Python Detective Work: Unraveling the Data
The beauty of housing data is that it’s incredibly granular and updated monthly. The Census Bureau provides treasure troves of information broken down by region, housing type, and structure size. For Python analysts, it’s like having access to the housing market’s medical records.
Getting Started with Housing Data:
import pandas as pd
import matplotlib.pyplot as plt
from fredapi import Fred
import seaborn as sns

# Initialize FRED API
fred = Fred(api_key='your_fred_api_key')

# Key housing indicators
housing_starts = fred.get_series('HOUST', start='2020-01-01')
building_permits = fred.get_series('PERMIT', start='2020-01-01')
housing_completions = fred.get_series('COMPUTSA', start='2020-01-01')

# Single-family vs Multi-family breakdown
sf_starts = fred.get_series('HOUST1F', start='2020-01-01')  # Single-family
mf_starts = fred.get_series('HOUST5F', start='2020-01-01')  # Multi-family (5+ units)

# Create the housing pipeline visualization
fig, ((ax1, ax2), (ax3, ax4)) = plt.subplots(2, 2, figsize=(16, 12))

# Permits vs Starts relationship
ax1.plot(building_permits.tail(60), label='Building Permits', linewidth=2)
ax1.plot(housing_starts.tail(60), label='Housing Starts', linewidth=2)
ax1.set_title('The Housing Pipeline: Permits vs Starts')
ax1.legend()
ax1.grid(True, alpha=0.3)

# Single vs Multi-family starts
ax2.plot(sf_starts.tail(60), label='Single-Family', linewidth=2)
ax2.plot(mf_starts.tail(60), label='Multi-Family', linewidth=2)
ax2.set_title('Housing Type Breakdown')
ax2.legend()
ax2.grid(True, alpha=0.3)

plt.tight_layout()
plt.show()
The Regional Reality Check
One of the most powerful features of housing data is its regional breakdown. April’s overall numbers mask significant regional variations that tell different stories about local economic conditions.
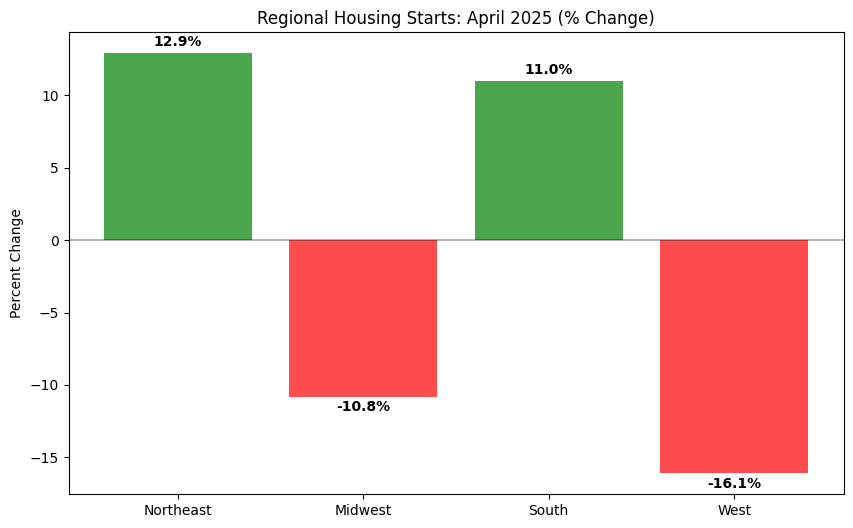
The Northeast saw housing starts surge 12.9%, while the South jumped 11.0%. But the West plummeted 16.1%, and the Midwest fell 10.8%. This isn’t random—it reflects different regional responses to interest rates, local job markets, and housing affordability.
For Python analysts, regional data offers opportunities for more sophisticated analysis:
# Regional housing analysis (conceptual - actual implementation requires Census API)
regions = ['Northeast', 'Midwest', 'South', 'West']
april_changes = [12.9, -10.8, 11.0, -16.1]  # Housing starts % change

# Visualize regional divergence
plt.figure(figsize=(10, 6))
colors = ['green' if x > 0 else 'red' for x in april_changes]
plt.bar(regions, april_changes, color=colors, alpha=0.7)
plt.title('Regional Housing Starts: April 2025 (% Change)')
plt.ylabel('Percent Change')
plt.axhline(y=0, color='black', linestyle='-', alpha=0.3)
for i, v in enumerate(april_changes):
    plt.text(i, v + 0.5 if v > 0 else v - 1, f'{v}%', ha='center', fontweight='bold')
plt.show()
The Multi-Family Puzzle
Here’s where April’s data gets really interesting. Multi-family starts surged 10.7%, suggesting strong demand for apartments and condos. This could signal several trends:
- Affordability Crisis Response: Single-family homes have become unaffordable for many buyers, driving demand for rental units
- Urban Revival: People are moving back to cities post-pandemic, increasing apartment demand
- Investment Shift: Developers are pivoting to rental properties as homeownership becomes less accessible
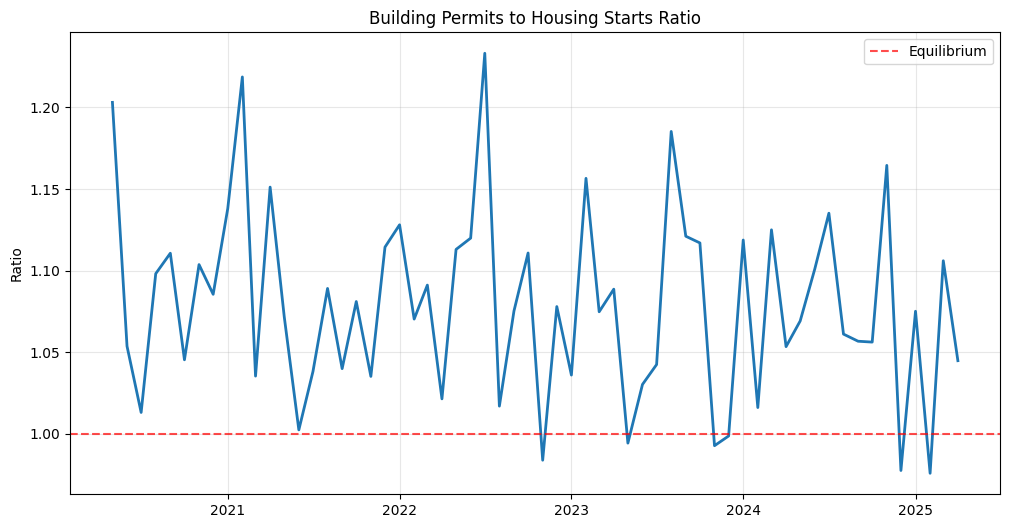
But here’s the concerning part: multi-family permits fell 3.7%. This suggests the current surge in multi-family starts is driven by working through existing permit backlogs, not new confidence in future demand.
Python Analysis: Ratio Analysis
# Calculate permits-to-starts ratio
permits_starts_ratio = building_permits / housing_starts

# Plot the ratio over time
plt.figure(figsize=(12, 6))
plt.plot(permits_starts_ratio.tail(60), linewidth=2)
plt.title('Building Permits to Housing Starts Ratio')
plt.ylabel('Ratio')
plt.axhline(y=1.0, color='red', linestyle='--', alpha=0.7, label='Equilibrium')
plt.legend()
plt.grid(True, alpha=0.3)

# When ratio > 1: More permits than starts (building up pipeline)
# When ratio < 1: More starts than permits (working down pipeline)
print(f"Current ratio: {permits_starts_ratio.iloc[-1]:.2f}")
The Interest Rate Connection
You can’t analyze housing data in 2025 without considering the Federal Reserve’s monetary policy stance. Even though the Fed has kept rates steady in the 4.25%-4.50% range, mortgage rates remain elevated compared to the pandemic-era lows.
This creates a fascinating dynamic: existing homeowners are reluctant to sell because they’d lose their sub-3% mortgages, creating inventory shortages that keep prices high. Meanwhile, potential buyers are priced out by both high home prices and high mortgage rates.
The result? Demand shifts toward rental properties (hence the multi-family surge) while single-family construction slows. It’s basic economics, but the real-world implications are profound.
Homebuilder Sentiment: The Human Factor
The Census Bureau’s data tells us what happened, but homebuilder sentiment surveys tell us why. According to the TD Economics report, preliminary readings for homebuilder sentiment in May remained downbeat as “elevated policy uncertainty weighed on sales activity.”
This policy uncertainty isn’t just about interest rates—it’s about tariffs, trade policy, and regulatory changes that affect construction costs. When builders don’t know what lumber will cost next quarter due to potential trade policy changes, they naturally become more cautious about new projects.
Python Application: Sentiment Analysis
# While we can't directly scrape sentiment data, we can track proxy indicators
import yfinance as yf

# Get homebuilder stock performance as sentiment proxy
homebuilders = ['DHI', 'LEN', 'PHM', 'TOL', 'KBH']  # Major homebuilding stocks
hb_data = {}

for ticker in homebuilders:
    try:
        stock = yf.Ticker(ticker)
        hist = stock.history(period='1y')
        hb_data[ticker] = hist['Close']
    except:
        print(f"Could not fetch {ticker}")

# Create homebuilder index
hb_df = pd.DataFrame(hb_data)
hb_index = hb_df.mean(axis=1)

# Plot homebuilder sentiment proxy
plt.figure(figsize=(12, 6))
plt.plot(hb_index, linewidth=2)
plt.title('Homebuilder Stock Index (Sentiment Proxy)')
plt.ylabel('Index Value')
plt.grid(True, alpha=0.3)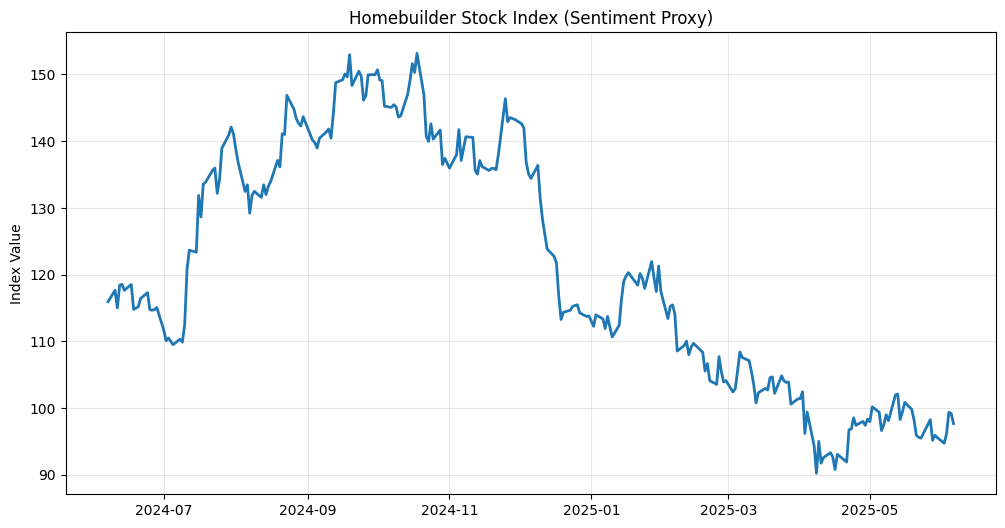
What This Means for the Broader Economy
Housing matters for the economy in ways that go far beyond construction jobs. Housing wealth effects influence consumer spending, construction activity drives demand for everything from appliances to landscaping services, and housing affordability affects labor mobility.
The current divergence between starts and permits suggests we’re in a transition period. The economy is working through existing construction commitments while builders grow more cautious about future projects. This isn’t necessarily recessionary, but it’s definitely not expansionary.
For investors, this creates both opportunities and risks. REITs focused on multi-family properties might benefit from continued rental demand. Traditional homebuilders face headwinds from both demand and supply sides. Building materials companies are caught in the middle, benefiting from current construction but facing uncertain future demand.
The Python Advantage: Building Your Housing Dashboard
The real power of Python for housing analysis comes from combining multiple data sources and creating automated monitoring systems:
# Comprehensive housing dashboard function
def create_housing_dashboard():
    """Create automated housing market dashboard"""

    # Fetch latest data
    starts = fred.get_series('HOUST')
    permits = fred.get_series('PERMIT')
    completions = fred.get_series('COMPUTSA')

    # Calculate key metrics
    latest_starts = starts.iloc[-1]
    latest_permits = permits.iloc[-1]
    permits_starts_ratio = latest_permits / latest_starts

    # Monthly changes
    starts_change = (starts.iloc[-1] / starts.iloc[-2] - 1) * 100
    permits_change = (permits.iloc[-1] / permits.iloc[-2] - 1) * 100

    # Print dashboard
    print("🏠 HOUSING MARKET DASHBOARD")
    print("=" * 40)
    print(f"Housing Starts: {latest_starts:.3f}M ({starts_change:+.1f}%)")
    print(f"Building Permits: {latest_permits:.3f}M ({permits_change:+.1f}%)")
    print(f"Permits/Starts Ratio: {permits_starts_ratio:.2f}")

    if permits_starts_ratio > 1.1:
        print("📈 Signal: Building pipeline expanding")
    elif permits_starts_ratio < 0.9:
        print("📉 Signal: Working down pipeline")
    else:
        print("➡️ Signal: Balanced pipeline")

# Run the dashboard
create_housing_dashboard()
🏠 HOUSING MARKET DASHBOARD ========================================
Housing Starts: 1361.000M (+1.6%)
Building Permits: 1422.000M (-4.0%)
Permits/Starts Ratio: 1.04
➡️ Signal: Balanced pipeline
The Bottom Line: Reading the Housing Tea Leaves
April’s housing data tells a story of an economy in transition. Rising starts suggest current economic activity remains solid, but falling permits hint at growing caution about the future. The shift toward multi-family construction reflects changing demographics and affordability pressures.
For Python-enabled analysts, housing data offers some of the richest opportunities for economic forecasting. The data is timely, granular, and directly tied to broader economic trends. Master housing indicators, and you’ll have a significant edge in understanding where the economy is headed.
The divergence between starts and permits isn’t cause for panic, but it’s definitely worth watching. Like many economic indicators in early 2025, housing is flashing yellow warning lights rather than red stop signs. The economy is pumping the brakes, not slamming them.
Next week, we’ll dive into the labor market’s early warning system: initial unemployment claims, which just hit an 8-month high and are sending their own mixed signals about economic momentum.
Read Next: The Jobs Picture: What Rising Unemployment Claims Really Mean
Previous: Manufacturing’s Mixed Signals: Durable Goods Orders Volatility
The post is for informational purposes only and does not constitute financial advice. You should not construe any such information or other material as legal, tax, investment, financial, or other advice.