The Great Small-Cap Mystery: How Python Revealed Wall Street’s Best-Kept Secret
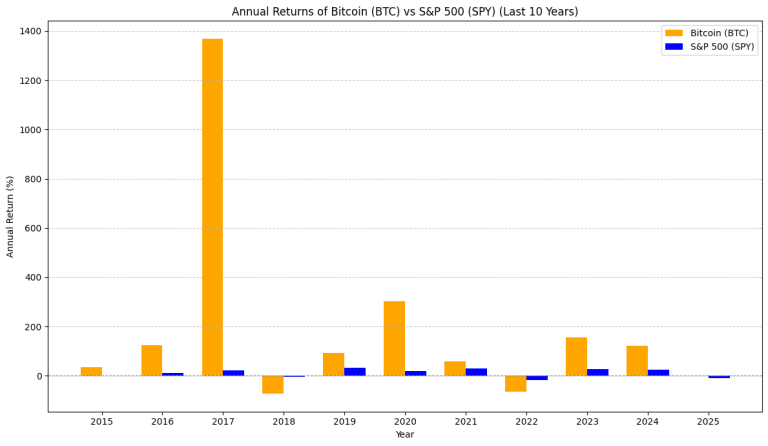
You know that feeling when you’re scrolling through your phone and suddenly see something that makes you do a double-take? That’s exactly what happened to me last week while running some Python code on small-cap stocks. The numbers were so extreme, I thought my script was broken. Spoiler alert: it wasn’t. The Tale of Two…