A Primer on the Biotechnology Sector (GICS 352010): Foundation for Analysis
The Biotechnology sector (GICS 352010) represents the high-risk, high-reward frontier of drug development, characterized by novel modalities and intensive R&D investment. This primer equips financial analysts with the foundational knowledge required to dissect this complex ecosystem.
We analyze the sector’s structure, differentiating between platform and asset-centric models, and detail the core economics defined by high attrition rates (Probability of Success, PoS) and significant capital requirements.
The article provides a deep dive into major therapeutic modalities—including monoclonal antibodies, ADCs, Cell and Gene Therapies (CGT), and RNA therapeutics—focusing on technical risks and manufacturing challenges (CMC). Regulatory pathways (FDA/EMA) and market access dynamics (U.S. Payer mix, IRA implications, HTA frameworks) are detailed, alongside an analysis of biotech capital market cycles. The core of the primer focuses on the risk-adjusted Net Present Value (rNPV) valuation methodology, outlining key assumptions, SOTP frameworks, and common analytical pitfalls. This comprehensive overview serves as an essential reference for rigorous, evidence-based biotechnology analysis.
The biotechnology sector serves as the primary innovation engine within the broader healthcare landscape, distinguished by its focus on translating foundational scientific discoveries into novel therapeutics. While large-cap pharmaceutical companies increasingly rely on mergers and acquisitions or late-stage licensing to supplement internal R&D, biotechnology companies build their entire existence around pushing the frontiers of medical science. This fundamental difference in orientation—innovation over optimization, discovery over development—creates a sector with unique analytical requirements.
Successfully analyzing biotechnology investments demands integration of multiple specialized disciplines. Scientific literacy enables assessment of biological plausibility and mechanism of action. Regulatory expertise informs probability of approval and development timeline estimates. Financial modeling capabilities translate uncertain future outcomes into present valuations. Clinical trial design knowledge reveals which data will prove meaningful and which will disappoint. No single expertise suffices—the sector punishes analysts who attempt to evaluate companies through a purely financial, purely scientific, or purely clinical lens.
1.1 Defining Biotechnology: Scope and Business Models
Industry Classification
Biotechnology, classified under GICS code 352010, encompasses companies primarily engaged in the research, development, manufacturing, and marketing of products based on genetic analysis and genetic engineering [S&P Global, Global Industry Classification Standard (GICS) Methodology, 2024]. This definition centers on the manipulation of living organisms or their components to produce therapeutics, distinguishing biotech from traditional pharmaceutical chemistry and from medical device or diagnostic companies.
Strategic Archetypes: Platforms Versus Assets
Biotechnology business models organize around two fundamental strategic approaches, each creating distinct value propositions and risk profiles.
- Platform-Centric Companies: Building the Innovation Engine
Platform companies develop proprietary enabling technologies that can generate multiple drug candidates rather than focusing on individual therapeutic programs. Examples include gene editing systems like CRISPR/Cas9, RNA delivery vehicles such as lipid nanoparticles, or antibody discovery engines that can identify therapeutic antibodies across diverse targets. The platform itself—the repeatable technology—constitutes the core asset.
Value creation in platform models derives from multiple sources. Scalability determines whether the platform can efficiently generate numerous high-quality candidates or faces bottlenecks that limit productivity. Validation through business development and licensing partnerships provides external validation of platform value and generates non-dilutive capital through upfront payments, milestones, and royalties. Intellectual property strength protects the platform from competition and enables attractive partnership economics. The efficiency of candidate generation—how quickly and reliably the platform produces clinical-stage assets—ultimately determines whether the platform model creates more value than pursuing individual assets independently.
Platform companies face the challenge of demonstrating value before clinical validation of multiple programs. Investors must assess technology potential based on preclinical data, mechanism plausibility, and management’s articulation of the platform vision. However, successful platforms that achieve clinical validation across multiple programs can create exceptional value, as each new program leverages proven technology with reduced risk.
- Asset-Centric Development Companies: Concentrated Execution
In contrast, asset-centric development companies (DevCos) concentrate resources on developing one or a small number of specific drug candidates. Company value ties directly to the clinical and commercial success of the lead asset, creating highly binary risk profiles. A single Phase 3 failure can destroy most of the company’s value, while success can deliver exceptional returns.
Value drivers for DevCos are straightforward but demanding. Clinical data quality determines whether the asset advances or fails at each stage. Total addressable market size bounds the potential commercial opportunity. Competitive landscape assessment reveals whether the asset offers differentiation versus existing therapies and anticipated pipeline competition. Regulatory pathway clarity influences development timelines, costs, and approval probability.
Asset-centric models offer focus and clarity—investors can understand exactly what they’re investing in and when binary outcomes will resolve. However, this concentration creates vulnerability. Unlike platform companies that can absorb individual program failures across a portfolio of opportunities, DevCos typically cannot survive lead asset failure without radical restructuring or acquisition.
The Evolving Therapeutic Toolkit: Modality Landscape
The therapeutic landscape has expanded dramatically beyond traditional drug classes, creating a diverse array of modalities with distinct characteristics, development considerations, and commercial profiles.
- Small Molecules: The Traditional Foundation
Small molecules—chemically synthesized compounds with low molecular weight—represent the traditional foundation of drug development. Their advantages include oral bioavailability, enabling convenient patient administration, and well-established manufacturing processes refined over decades. However, small molecules face increasing competitive pressure and limited ability to target certain protein classes, particularly intracellular targets and protein-protein interactions that lack traditional binding pockets.
- Biologics: The Protein Revolution
Biologics encompass large, complex molecules produced by or derived from living organisms, including proteins and antibodies [FDA, What Are “Biologics” Questions and Answers, 2018]. These sophisticated therapeutics generally exhibit high target specificity, enabling precise intervention in disease pathways with potentially fewer off-target effects. However, biologics typically require injection or infusion administration, face complex and expensive manufacturing processes collectively termed chemistry, manufacturing, and controls (CMC), and often encounter immunogenicity challenges where patients develop anti-drug antibodies that neutralize efficacy.
- The Modern Advanced Modality Arsenal
Recent decades have witnessed the emergence of several sophisticated therapeutic approaches that expand medicine’s reach into previously intractable diseases.
Monoclonal antibodies (mAbs) and their derivatives have become workhorses of modern therapeutics. Standard mAbs target single disease-relevant proteins with high specificity. Bispecific antibodies (BsAbs) simultaneously bind two different targets, enabling novel mechanisms such as T-cell engagers that bridge immune cells and tumor cells. Antibody-drug conjugates (ADCs) link targeting antibodies to cytotoxic payloads, delivering chemotherapy specifically to diseased cells while sparing healthy tissue—combining the precision of antibodies with the potent cell-killing capacity of traditional chemotherapy.
Cell and gene therapy (CGT) represents perhaps the most transformative frontier. Gene therapy introduces or modifies genetic material to treat disease, typically using viral vectors such as adeno-associated virus (AAV) or lentivirus to deliver therapeutic genes. Cell therapy involves transferring intact, living cells into patients, with CAR-T therapies—which engineer a patient’s own T cells to target cancer—demonstrating proof of concept for cellular medicine. These approaches offer potential for durable, potentially curative outcomes from one-time treatments, fundamentally altering the treatment paradigm for genetic diseases and certain cancers.
RNA therapeutics exploit RNA molecules to modulate gene expression without permanently altering DNA. Antisense oligonucleotides (ASOs) and small interfering RNA (siRNA) reduce expression of disease-causing genes, while messenger RNA (mRNA) provides instructions for cells to produce therapeutic proteins. The COVID-19 pandemic validated mRNA technology at global scale, accelerating investment and development across numerous other diseases.
Gene editing technologies, particularly CRISPR/Cas9, enable precise modification of DNA sequences, offering the potential to correct genetic mutations at their source. Unlike traditional gene therapy that adds functional genes, gene editing can repair, delete, or modify specific genetic sequences with unprecedented precision.
This expanding modality toolkit creates both opportunity and complexity. Each modality carries distinct development risks, manufacturing requirements, regulatory considerations, and commercial characteristics. Investors must develop modality-specific expertise while maintaining sufficient breadth to assess competitive dynamics across therapeutic approaches targeting similar diseases. The analyst who masters these distinctions gains significant advantage in evaluating programs and anticipating which approaches will succeed in specific therapeutic contexts.
1.2 GICS Taxonomy
The Global Industry Classification Standard (GICS) provides a hierarchical framework for classifying companies.
- Sector (35): Health Care
- Industry Group (3520): Pharmaceuticals, Biotechnology & Life Sciences
- Industry (352010): Biotechnology
Boundaries and Distinctions
- Biotechnology (352010) vs. Pharmaceuticals (352020): The distinction is often based on size, R&D intensity, and modality focus, though large-cap biotechs behave similarly to pharma.
- Biotechnology (352010) vs. Life Sciences Tools & Services (352030): Tools companies provide the enabling technologies and services (like CROs and CDMOs) used by biotech and pharma.
| Hierarchy | GICS Code | Name | Notes / Examples |
|---|---|---|---|
| Sector | 35 | Health Care | Top-level GICS sector |
| Industry Group | 3510 | Health Care Equipment & Services | Providers, managed care, equipment/supplies |
| Industry Group | 3520 | Pharmaceuticals, Biotechnology & Life Sciences | Therapeutics and enabling tools/services |
| Industry | 352010 | Biotechnology | Therapeutics using biological processes/genetic engineering |
| Industry | 352020 | Pharmaceuticals | Primarily small-molecule drug manufacturers (plus some biologics) |
| Industry | 352030 | Life Sciences Tools & Services | CROs, CDMOs, instruments, reagents, research services |
| Sub-Industry | 35201010 | Biotechnology | Sub-industry under 352010 (classification used by indices/ETFs) |
Caption: The hierarchical structure of the GICS Health Care Sector. Source: S&P Global GICS Methodology, 2024.
1.3 Sector Footprint
The biotechnology sector is heavily concentrated in the U.S., particularly on the NASDAQ exchange.
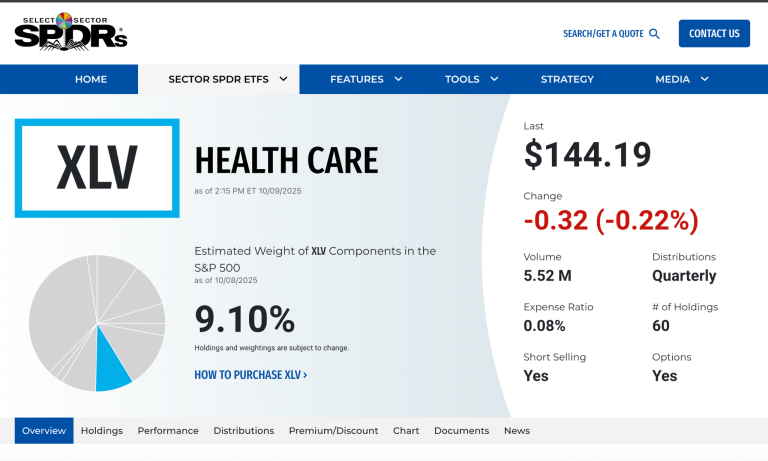
- Index Weights and ETFs: Biotechnology is tracked primarily through:
- iShares Biotechnology ETF (IBB): Market-cap weighted, concentrating exposure in large-cap, established biotechs.
- SPDR S&P Biotech ETF (XBI): Equal-weighted, providing broader exposure to small- and mid-cap (SMID) development-stage companies. XBI is often used as the benchmark for the health of the broader biotech ecosystem.
- Number of Issuers: Fluctuates with IPO windows and M&A cycles. As of early 2024, there were over 600 publicly traded biotech companies in the U.S. [Evaluate Pharma, Biotech in 2024, Jan 2024].
- Financial Profile: The sector is characterized by a barbell distribution: a few large, profitable companies and a majority of pre-revenue development-stage companies (DevCos).
1.4 Why Biotech Matters
- Innovation Externality to Pharma: Biotechnology is the primary source of novel mechanisms of action (MoA). Large pharmaceutical companies rely heavily on acquiring or licensing assets originated by smaller biotechs. Over 60% of new molecular entities (NMEs) approved by the FDA originate in smaller companies. [IQVIA Institute, The Changing Landscape of Research and Development, April 2022].
- rNPV Leverage: Biotechnology valuation is highly sensitive to clinical and regulatory catalysts. A positive Phase 3 readout can shift the Probability of Success (PoS) assumption in a risk-adjusted Net Present Value (rNPV) model dramatically, leading to binary shifts in equity value.
- Policy Sensitivity: The sector is highly exposed to regulatory (FDA standards) and political shifts (drug pricing legislation, e.g., the Inflation Reduction Act of 2022), and intellectual property law.
2. Core Economics of Biotech
The fundamental economic challenge defining biotechnology lies in managing the collision between high costs, extreme risk, and finite capital resources. Drug development demands hundreds of millions to billions of dollars invested over a decade or more, with the majority of programs ultimately failing. This creates a unique financial dynamic: companies must continuously raise capital to fund development programs whose success remains uncertain until late-stage clinical data emerges, yet the capital markets that provide funding fluctuate based on factors often unrelated to individual program merit.
Understanding biotechnology economics requires recognizing drug development as a process of sequential risk reduction. Each clinical stage generates data that either validates the therapeutic hypothesis—justifying continued investment and reducing uncertainty—or reveals flaws that terminate the program. This staged progression creates discrete value inflection points where probabilities of success shift dramatically based on new information, driving the sector’s characteristic volatility.
2.1 The Development Funnel: Sequential Risk Resolution
Drug development proceeds through a well-defined sequence of stages, each designed to answer specific questions about safety, efficacy, and manufacturability. This progression—often visualized as a funnel narrowing from many early-stage candidates to the few that achieve approval—reflects systematic attrition as programs fail to meet increasingly stringent requirements.
Discovery and Preclinical Development: Establishing Biological Foundation
The journey begins with discovery research, where scientists identify biological targets implicated in disease pathology and design molecules capable of modulating those targets therapeutically. Lead optimization refines initial candidates to improve potency, selectivity, and drug-like properties. Extensive preclinical testing in vitro (in cells and biochemical assays) and in vivo (in animal models) generates the foundational safety and efficacy data required before human testing can commence.
This phase culminates in filing an Investigational New Drug (IND) application with the FDA in the United States, or equivalent submissions to regulatory authorities internationally. The IND package presents preclinical safety data, manufacturing information, and proposed clinical trial protocols. FDA approval of the IND—typically granted within 30 days absent significant concerns—permits the critical transition from laboratory research to human clinical trials.
- Phase 1: First Proof of Safety in Humans
Phase 1 trials mark the first administration of an investigational drug to humans, typically conducted in small cohorts of healthy volunteers (except in oncology, where patients with advanced disease participate given the toxicity of most cancer therapies). The primary objective centers on safety assessment: identifying adverse events, determining tolerability, and establishing the maximum tolerated dose (MTD)—the highest dose that can be administered without unacceptable toxicity.
Phase 1 also generates the first human pharmacokinetic (PK) data, measuring how the body absorbs, distributes, metabolizes, and excretes the drug. These PK parameters inform dosing regimens for subsequent trials. While Phase 1 typically does not aim to demonstrate efficacy, any signals of clinical activity generate excitement and can substantially impact valuations despite the small sample sizes and early stage.
- Phase 2: Validating the Therapeutic Hypothesis
Phase 2 trials transition from healthy volunteers to patients with the target disease, aiming to provide preliminary evidence of efficacy—proof-of-concept (PoC) that the drug actually works in humans—while continuing to assess safety in the target population. These trials employ smaller sample sizes than Phase 3, typically enrolling dozens to a few hundred patients, and often use biomarkers or surrogate endpoints that provide faster readouts than definitive clinical outcomes.
The quality of Phase 2 data critically influences whether programs advance to the expensive pivotal stage. Well-designed Phase 2 trials that demonstrate clear efficacy signals with acceptable safety substantially de-risk Phase 3 execution. Conversely, marginal Phase 2 results—statistically positive but with small effect sizes or concerning safety signals—often lead to Phase 3 failures despite technically “positive” Phase 2 outcomes.
The End-of-Phase-2 (EoP2) meeting with the FDA represents a crucial regulatory interaction. Companies present their Phase 2 data and proposed Phase 3 trial designs, seeking FDA agreement on endpoints, patient population, trial size, and success criteria. Achieving clear FDA alignment at the EoP2 meeting substantially reduces the risk that pivotal trials will fail due to design flaws or endpoint disputes, making this often-overlooked regulatory milestone highly consequential for development risk.
- Phase 3: Definitive Evidence for Approval
Phase 3 trials are large-scale randomized controlled trials (RCTs) designed to provide definitive evidence of safety and efficacy sufficient for regulatory approval. These “pivotal” trials typically enroll hundreds to thousands of patients, compare the investigational drug against placebo or active comparators, and measure clinically meaningful endpoints over extended treatment periods. The statistical rigor, sample size, and duration make Phase 3 trials the most expensive stage of development, often consuming hundreds of millions of dollars per program.
Phase 3 represents the highest-stakes binary event in drug development. Success—meeting the primary endpoint with statistical significance and acceptable safety—typically enables regulatory filing and drives substantial valuation appreciation. Failure destroys years of investment and often renders the program unviable, particularly if the failure reflects fundamental issues with efficacy rather than correctable trial design flaws.
- Regulatory Review: The Path to Approval
Following successful Phase 3 trials, companies compile comprehensive data packages into either a New Drug Application (NDA) for small molecules or Biologics License Application (BLA) for biologics. These submissions present all clinical, preclinical, and manufacturing data, arguing that the benefit-risk profile justifies approval for the proposed indication.
The FDA assigns a PDUFA (Prescription Drug User Fee Act) date establishing the target decision deadline, typically ten months after filing for standard review or six months for priority review granted to therapies addressing serious conditions with evidence of significant improvement over available therapies. The PDUFA date becomes a known catalyst, creating a defined timeline for the binary approval decision that will determine whether years of development culminate in commercial success or regulatory rejection.
This staged progression—from preclinical through Phase 1, 2, 3, and regulatory review—creates the fundamental structure of biotechnology value creation. Understanding what each stage proves, what risks it retires, and what uncertainties persist enables sophisticated assessment of where programs stand on the risk-reward spectrum and how upcoming data readouts will shift probabilities of ultimate success.
Probability of Success (PoS)
Attrition rates are high. The most critical metric in biotech analysis is the Probability of Success (PoS), also known as the Likelihood of Approval (LoA).
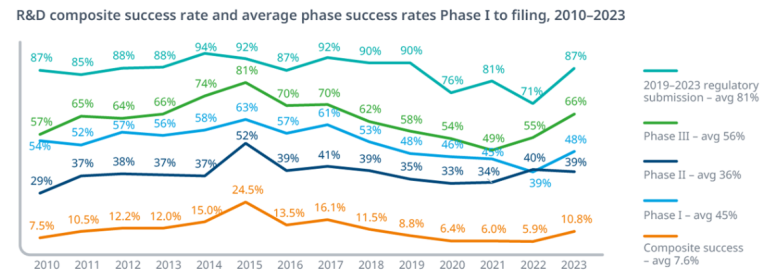
Historical data consistently shows that the majority of drug candidates fail. According to a major study covering 2011-2020:
- The overall LoA from Phase 1 to FDA approval was 7.9%.
- Phase 2 is the largest hurdle, with only around 30% of candidates advancing to Phase 3. This reflects the difficulty of demonstrating efficacy in patients.
[Wong, CH et al., Estimation of clinical trial success rates and related parameters, Biostatistics, 2022 (Based on BIO/Informa/QLS data)].
Exhibit 2.1: Clinical Development Success Rates (2011-2020)
| Phase Transition | Overall Success Rate (%) |
|---|---|
| Phase 1 to Phase 2 | 52.0% |
| Phase 2 to Phase 3 | 28.9% |
| Phase 3 to Submission | 57.8% |
| Submission to Approval | 90.0% |
| Overall (Phase 1 to Approval) | 7.9% |
Caption: Historical probability of transitioning between clinical development phases across all therapeutic areas. Source: Wong et al., Biostatistics, 2022.
PoS Varies Significantly by Therapeutic Area (TA) and Modality:
- Oncology historically has the lowest overall PoS (~5.3%).
- Hematology (~23.9%) tends to have higher success rates.
- Rare diseases often exhibit higher PoS (~17.0%). [Wong et al., 2022].
Analysts must use TA-specific PoS estimates in valuation models.
Cycle Times
Drug development is lengthy. The average time from Phase 1 initiation to approval is approximately 9 years. [Wong et al., 2022].
2.2 Capital Model
Biotechnology is capital intensive. Developing a successful drug can cost, on a fully loaded and risk-adjusted basis, upwards of $2.5 billion. [Wouters, OJ et al., Estimated Research and Development Investment Needed to Bring a New Medicine to Market, 2009-2018, JAMA, 2020].
Key Financial Metrics for DevCos
- Cash Runway (Months): (Current Cash + Equivalents + Marketable Securities) / (Quarterly Cash Burn Rate). A runway <12 months typically signals imminent financing needs.
- Cash Burn Rate: Net Cash Used in Operating Activities (GAAP).
OPEX Split
- Research & Development (R&D): Includes clinical trial costs, manufacturing (CMC), and personnel. R&D is expensed as incurred under GAAP.
- General & Administrative (G&A): Includes executive salaries, legal/IP costs, and (pre-launch) commercial planning.
Outsourcing: CDMO/CRO Reliance
Most SMID biotechs rely heavily on outsourcing.
- Contract Development and Manufacturing Organizations (CDMOs): Provide drug substance and drug product manufacturing.
- Contract Research Organizations (CROs): Manage the execution of clinical trials.
Revenue Structures: Partnerships (BD&L)
DevCos often partner with larger firms to fund development. Deals include upfront payments, contingent milestone payments, and royalties on net sales.
Priority Review Vouchers (PRVs)
A PRV is a transferable asset awarded by the FDA for approval of drugs for certain rare pediatric or tropical diseases. It entitles the holder to a 6-month Priority Review for a subsequent application. PRVs can be sold; the market price has historically ranged from $80M to $120M. [FDA, Priority Review Voucher Programs, 2024].
2.3 Dilution Mechanics
Given the high cash burn, DevCos must frequently raise capital, leading to shareholder dilution.
Equity Financing
- Follow-On (FO) Offerings / Secondaries: Public companies selling newly issued shares, often after positive clinical data.
- At-The-Market (ATM) Facilities: Allows a company to sell shares gradually into the open market.
Debt and Alternatives
- Convertible Bonds: Debt that can be converted into equity.
- Royalty Monetization: Selling a future royalty stream for upfront cash.
Key Considerations
- Cash vs. Non-Cash Charges: Analysts must distinguish between cash expenses and non-cash charges. Stock-based compensation (SBC) is a significant non-cash expense that impacts GAAP profitability but not short-term cash burn.
2.4 Value Drivers
The value of a biotech asset is driven by:
- MoA Novelty and Target Risk: Is the mechanism validated? High novelty offers greater upside but carries higher biological risk.
- Clinical Data Quality: Robustness of efficacy data (magnitude, durability) and the safety/tolerability profile.
- CMC / Manufacturability: The ability to manufacture the product consistently, at scale, and with acceptable COGS. A major risk factor for complex modalities.
- Payer / Access Hurdles: Likelihood of securing favorable reimbursement.
- KOL and Guideline Adoption: Endorsement by Key Opinion Leaders (KOLs) and inclusion in clinical practice guidelines are critical for establishing a new Standard of Care (SoC).
2.5 Regulatory Leverage: Expedited Programs
Regulatory agencies offer programs to accelerate development and review of drugs addressing unmet needs. [Source: FDA, Expedited Programs for Serious Conditions – Drugs and Biologics, Guidance for Industry, 2014].
- Fast Track Designation (FTD): Benefits include eligibility for Rolling Review and increased FDA interaction.
- Breakthrough Therapy Designation (BTD): Requires preliminary clinical evidence indicating substantial improvement over available therapy. Includes intensive FDA guidance.
- Regenerative Medicine Advanced Therapy (RMAT) Designation: Specific to cell and gene therapies, similar criteria to BTD.
- Priority Review (PR): FDA aims to take action within 6 months (vs. 10 months standard).
- Accelerated Approval (AA): Allows approval based on a surrogate endpoint “reasonably likely to predict clinical benefit.”
Confirmatory Trial Risk
Accelerated Approval requires post-marketing Phase 4 studies (Confirmatory Trials) to verify the clinical benefit. If the trial fails, the FDA can withdraw the approval.
3) Regulatory Pathways & Evidence Standards
The U.S. Food and Drug Administration (FDA) and the European Medicines Agency (EMA) are the two most critical regulatory bodies globally.
3.1 U.S. IND → NDA/BLA Basics
The process begins with the IND (Investigational New Drug application) application. The culmination is the submission of an NDA (New Drug Application) (regulated by CDER) or a BLA (Biologics License Application) (regulated by CDER (Center for Drug Evaluation and Research) or CBER(Center for Biologics Evaluation and Research)). CDER is a branch of the FDA responsible for regulating pharmaceutical drugs while CBER is a branch of the FDA responsible for regulating biological products.
Pivotal Trial Design
Phase 3 trials must be “adequate and well-controlled”.
- Superiority vs. Non-Inferiority (NI):
- Superiority: Designed to show the new drug is statistically significantly better than the comparator (placebo or Standard of care SoC).
- Non-Inferiority (NI): Designed to show the new drug is not worse than the active comparator by more than a predefined margin.
Endpoints
The choice of endpoint is critical and must be agreed upon with the FDA.
- Clinical Benefit Endpoints: Direct measures of how a patient feels, functions, or survives.
- Overall Survival (OS): The gold standard in oncology. Time from randomization to death from any cause.
- Surrogate Biomarkers: Laboratory measures or physical signs used as a substitute for clinical benefit.
- Progression-Free Survival (PFS): Time from randomization to disease progression or death.
- Objective Response Rate (ORR): Percentage of patients whose tumor shrinks by a predefined amount. Often used for Accelerated Approval.
[FDA, Clinical Trial Endpoints for the Approval of Cancer Drugs and Biologics, Guidance for Industry, 2018].
Advisory Committees (AdComs)
The FDA often convenes independent expert panels (AdComs) to review data and provide recommendations on approval. AdCom meetings are public and represent significant binary events.
3.2 EMA/UK Parallels
The EU uses a centralized procedure coordinated by the EMA. The Committee for Medicinal Products for Human Use (CHMP) provides the scientific opinion.
- Conditional Marketing Authorisation (CMA): Similar to FDA’s Accelerated Approval.
- PRIME (PRIority MEdicines) Scheme: Similar to FDA’s Breakthrough Designation. [EMA, PRIME: Priority Medicines, 2024].
In the UK, the Medicines and Healthcare products Regulatory Agency (MHRA) is the regulator.
Health Technology Assessment (HTA)
In Europe, regulatory approval is separate from reimbursement decisions. HTA bodies evaluate the clinical and economic value of new drugs.
- UK (NICE): The National Institute for Health and Care Excellence uses cost-effectiveness analysis (Incremental Cost-Effectiveness Ratio, ICER), measured in cost per Quality-Adjusted Life Year (QALY) gained. Typical threshold: £20,000-£30,000 per QALY.
- Germany (G-BA/IQWiG): The Federal Joint Committee (G-BA) assesses the “added benefit” compared to the appropriate comparator. This determines the price negotiated under the AMNOG process.
- France (HAS): Assesses clinical benefit (SMR) and improvement (ASMR) to inform pricing.
3.3 Safety/Risk Management
- Risk Evaluation and Mitigation Strategies (REMS): Required for drugs with serious safety concerns. REMS can include specialized prescriber training or restricted distribution. [FDA, REMS, 2024].
- Black-Box Warnings (Boxed Warnings): The strongest safety warning on a drug label.
- Post-Marketing Commitments (PMCs) and Requirements (PMRs): Studies conducted after approval.
3.4 CMC (CBER/CDER)
Chemistry, Manufacturing, and Controls (CMC) ensures the drug product is manufactured consistently and meets quality standards. CMC is a frequent source of regulatory delays (Complete Response Letters, CRLs).
- Comparability: When manufacturing processes change (e.g., scaling up), the sponsor must demonstrate the product remains comparable.
- Potency Assays: Critical for biologics/CGT to measure biological activity.
- Viral Vector Manufacturing (CGT): Manufacturing AAV or Lentiviral vectors at scale is challenging (low yields, high costs, capacity constraints).
- CRISPR Off-Target Testing (Gene Editing): Assessing the risk of unintended genetic modifications. [FDA, Human Genome Editing, Draft Guidance for Industry, 2022].
- GMP Compliance: FDA inspections of manufacturing facilities (Pre-Approval Inspections) are required.
4) Modalities Deep Dive
Understanding different therapeutic modalities is essential for assessing technical risk, manufacturing complexity, and commercial potential.
4.1 Monoclonal Antibodies, Immuno-Oncology, and Antibody-Drug Conjugates
Immuno-Oncology (IO) Therapeutics
The IO landscape centers on two main antibody approaches. Checkpoint inhibitors (CPIs) are monoclonal antibodies that target key immune regulatory pathways, particularly PD-1/PD-L1 and CTLA-4. While this class has reached maturity, it remains highly competitive.
Bispecific antibodies (BsAbs) represent a newer strategy, designed to bind two different targets simultaneously. T-cell engagers, for example, bridge tumor cells and immune cells to enhance anti-tumor responses. However, these potent immune activators carry notable safety risks, including cytokine release syndrome (CRS) and immune effector cell-associated neurotoxicity syndrome (ICANS).
Antibody-Drug Conjugates (ADCs)
ADCs merge the precise targeting of monoclonal antibodies with the cytotoxic power of chemotherapy. Current development efforts focus on optimizing two critical components: the linker (which determines when and where the payload is released) and the payload itself (the cytotoxic drug). The drug-to-antibody ratio (DAR) serves as a key parameter for balancing efficacy and safety.
ADCs face distinct challenges. Off-target toxicity remains a concern, along with payload-specific adverse effects such as ocular toxicity and interstitial lung disease (ILD). Additionally, manufacturing complexity is heightened because ADC production requires expertise in both biologic antibody production and high-potency chemical synthesis.
General Monoclonal Antibody Considerations
Across all monoclonal antibody platforms, immunogenicity presents a universal risk. Patients may develop anti-drug antibodies (ADAs) that can neutralize therapeutic efficacy or trigger infusion-related reactions (ISRs).
4.2 Cell & Gene Therapy (CGT)
Cell and gene therapies represent a paradigm shift in medicine, offering the potential for durable and potentially curative treatments through one-time interventions.
Gene Therapy: In Vivo Approaches
In vivo gene therapy delivers genetic material directly into the patient’s body, primarily through viral vectors. Adeno-associated virus (AAV) has emerged as the most common delivery vehicle. These non-integrating vectors are favored for their safety profile, though their packaging capacity is limited to approximately 4.7 kilobases of genetic material. Lentiviral vectors, which integrate into the host genome, are used primarily in ex vivo applications where cells are modified outside the body before reinfusion.
Gene Editing Technologies
Precision gene editing platforms like CRISPR/Cas9 enable targeted modification of DNA sequences. However, these powerful tools carry inherent risks: off-target editing can affect unintended genomic locations, on-target edits may produce unexpected outcomes, and mosaicism—where not all cells receive the intended edit—can limit therapeutic efficacy.
Critical Challenges in CGT Development
Durability of therapeutic effect remains a fundamental uncertainty. Unlike traditional therapies, CGTs promise long-lasting or permanent benefits, but this requires extensive long-term follow-up (LTFU) studies to validate.
Dosing and immunogenicity present complex hurdles, particularly for AAV-based therapies. High vector doses can trigger serious toxicity, while pre-existing neutralizing antibodies (NAbs) against AAV—common in the general population—may exclude patients from treatment entirely. Redosing, should the initial therapy wane, faces significant immunological barriers.
Manufacturing represents a critical bottleneck for the field. The complexity of CGT production demands solutions for scalability, cost reduction, and robust analytical characterization. Delivery efficiency, especially to challenging targets like the central nervous system (CNS), remains an active area of innovation.
Economic Considerations: One-and-Done Pricing
The transformative potential of CGTs comes with price tags often exceeding several million dollars per patient, creating substantial challenges for healthcare payers. To address this, the industry is pioneering innovative reimbursement models. Outcomes-based contracts and value-based agreements (VBAs) tie payment to therapeutic success through mechanisms such as annuity payments spread over multiple years or milestone-based payments contingent on sustained patient response.
4.3 RNA Therapeutics
RNA-based therapies offer a unique approach to disease treatment by modulating gene expression without permanently altering DNA. This class encompasses two primary strategies with distinct mechanisms of action.
Small interfering RNA (siRNA) and antisense oligonucleotides (ASOs) work by binding to target messenger RNA (mRNA), either triggering its degradation (gene knockdown) or modulating RNA splicing to alter protein production. In contrast, messenger RNA (mRNA) therapies function as genetic instructions, directing cells to produce therapeutic proteins directly.
The Delivery Challenge
Delivery remains the defining challenge for RNA therapeutics. Lipid nanoparticles (LNPs) have emerged as the leading delivery system for mRNA and siRNA, though they predominantly target the liver. For liver-directed therapies, conjugate technologies such as GalNAc (N-acetylgalactosamine) offer highly efficient delivery of siRNA and ASO molecules. However, efficient extrahepatic delivery—reaching tissues beyond the liver—represents a major unsolved hurdle that limits the therapeutic potential of these modalities.
Manufacturing presents its own complexities, requiring specialized processes for producing chemically modified oligonucleotides or mRNA, as well as precise LNP formulation techniques that demand rigorous quality control.
4.4 Small Molecules
Despite the rise of biologics, small molecule drugs remain indispensable in the therapeutic arsenal. Their advantages include oral bioavailability, which enables convenient patient administration, and generally lower manufacturing costs compared to complex biologics.
Kinase inhibitors represent a major success story, constituting a dominant class of targeted oncology therapeutics. More recently, targeted protein degraders such as PROTACs (proteolysis-targeting chimeras) have emerged as a sophisticated approach that hijacks the cell’s own protein degradation machinery to eliminate disease-causing proteins.
However, small molecules face a distinct commercial challenge: generic competition. The regulatory landscape further complicates planning, as the Inflation Reduction Act (IRA) subjects small molecules to Medicare price negotiation significantly earlier than biologics—nine years post-approval versus thirteen years for biologics. This compressed exclusivity window fundamentally impacts the economic calculus for small molecule development.
4.5 Companion Diagnostics
The intersection of diagnostics and therapeutics has become increasingly critical in modern drug development. Companion diagnostics (CDx) are tests specifically required for the safe and effective use of a corresponding therapeutic product, typically by identifying patients most likely to benefit or those at risk for adverse events.
This creates a codependence that significantly impacts development strategy. Drug developers must often pursue parallel development and regulatory approval of both the therapeutic and its companion diagnostic, adding complexity, cost, and timeline considerations to the overall program. The CDx becomes an integral component of the drug’s label, making its successful development essential to the therapeutic’s commercial viability.
5) Market Access, Pricing & Reimbursement
Beyond demonstrating safety, efficacy, and manufacturing capability, pharmaceutical products face what industry experts call the “fourth hurdle”: securing market access and reimbursement. Without favorable coverage and payment terms, even highly effective therapies may fail commercially.
5.1 The U.S. Payer Landscape
The U.S. healthcare system operates as a fragmented ecosystem of public and private payers, each with distinct reimbursement mechanisms and constraints.
Medicare: The Dominant Public Payer
Medicare structures drug coverage through two primary pathways. Part B, the medical benefit, covers physician-administered drugs—typically infused or injected therapies delivered in clinical settings. Reimbursement follows a formula based on the Average Sales Price (ASP) plus a 6% add-on (ASP+6%), which compensates providers for acquisition and handling costs. Part D, the pharmacy benefit, covers self-administered medications that patients take at home, primarily oral therapies.
The Inflation Reduction Act: A Paradigm Shift
The Inflation Reduction Act (IRA) of 2022 fundamentally reshaped the Medicare landscape with three major provisions. First, Medicare gained authority to negotiate prices directly for selected high-expenditure drugs, ending decades of statutorily prohibited price negotiation. Second, inflation rebates now penalize manufacturers whose price increases outpace inflation, constraining annual pricing flexibility. Third, the Part D redesign caps annual out-of-pocket costs for beneficiaries while simultaneously restructuring liability for catastrophic coverage. This shifts significantly more financial responsibility onto manufacturers, creating new pressure on product economics.
Medicaid: The “Best Price” Constraint
Medicaid operates under the “best price” rule, which mandates that manufacturers provide Medicaid the lowest price offered to virtually any other purchaser. This creates a complex web of pricing interdependencies, as discounts offered to one customer can trigger mandatory rebates to Medicaid, potentially eroding margins across the entire business.
Commercial Payers and Market Dynamics
The commercial insurance market adds additional layers of complexity. The 340B Drug Pricing Program requires manufacturers to provide substantial discounts to eligible healthcare organizations serving vulnerable populations, though the program has expanded controversially in recent years.
Copay assistance programs represent a common manufacturer strategy to reduce patient out-of-pocket costs and improve adherence. However, many payers have implemented “copay accumulator” programs that prevent manufacturer assistance from counting toward patient deductibles, effectively neutralizing these programs and creating affordability barriers for patients.
5.2 Commercial Dynamics
Manufacturers negotiate with PBMs and insurers for formulary placement.
- PBMs: Intermediaries negotiating drug prices. The top 3 PBMs control ~80% of the market. [Drug Channels Institute, The 2024 Economic Report on U.S. Pharmacies and Pharmacy Benefit Managers, 2024].
- Gross-to-Net (GTN) Bubble: The difference between the list price (WAC) and the net price realized after all discounts and rebates. GTN discounts often reach 40-60%+ in competitive classes.
Utilization Management (UM)
- Prior Authorization (PA): Requires payer approval before dispensing.
- Step Therapy (“Fail First”): Requires patients to fail on preferred (cheaper) alternatives first.
5.3 International Pricing and Reimbursement
Markets outside the United States generally achieve significantly lower drug prices through centralized negotiation and formalized health technology assessment (HTA) processes. These mechanisms create a fundamentally different pricing environment compared to the fragmented U.S. system.
International Reference Pricing: The Global Interconnection
International reference pricing (IRP) creates a web of interdependencies across global markets. Many countries establish their drug prices by referencing a basket of prices from other nations, meaning that a price concession in one market can cascade into mandatory price reductions elsewhere. This makes launch sequencing and pricing strategy across geographies a high-stakes exercise in balancing market access against price erosion.
Health Technology Assessment in Europe
European markets employ rigorous HTA frameworks to determine reimbursement and pricing. Bodies such as the National Institute for Health and Care Excellence (NICE) in the UK assess cost-effectiveness using metrics like incremental cost-effectiveness ratios (ICER) and quality-adjusted life years (QALYs). Germany’s Federal Joint Committee (G-BA) conducts added benefit assessments to quantify therapeutic value relative to existing standards of care. As detailed in Section 3.2, these assessments directly determine market access and acceptable pricing levels, making robust health economics data essential from early development.
Japan’s Controlled Pricing System
Japan’s National Health Insurance (NHI) system operates with centralized price setting and mandates regular price revisions. Unlike Western markets where launch prices may remain relatively stable, Japanese prices face periodic downward adjustments, creating unique forecasting and planning challenges for manufacturers.
5.4 Pricing Dynamics: Disease Prevalence and Market Economics
The economic logic of drug pricing diverges sharply based on disease prevalence and patient population size.
Common Diseases: Volume and Competition
For diseases affecting large populations, pricing faces natural constraints from competitive dynamics and budget impact considerations. Payers scrutinize therapies treating hundreds of thousands or millions of patients, as even modest per-patient costs can create substantial aggregate budget burdens. Competition within therapeutic classes further pressures prices toward cost-effectiveness thresholds.
Rare and Orphan Diseases: The Small Population Premium
In contrast, rare and orphan diseases—affecting small patient populations—can sustain exceptionally high prices, often exceeding $200,000 annually per patient. The economic rationale follows from spreading fixed development costs across limited patient numbers. Regulatory frameworks reinforce this model through orphan drug exclusivity provisions: seven years in the United States and ten years in the European Union. These extended market protection periods enable manufacturers to recoup investments while treating small populations, though they also generate ongoing debate about pricing sustainability and healthcare equity.
This pricing dichotomy fundamentally shapes development strategy, making orphan diseases particularly attractive from a commercial perspective despite their limited epidemiology.
6) Capital Markets & Industry Cycles
The biotechnology sector exhibits pronounced cyclicality, driven by shifting investor sentiment, macroeconomic conditions, and waves of technological innovation. Understanding these cycles is essential for timing investment decisions and assessing risk.
6.1 The Biotech Equity Cycle
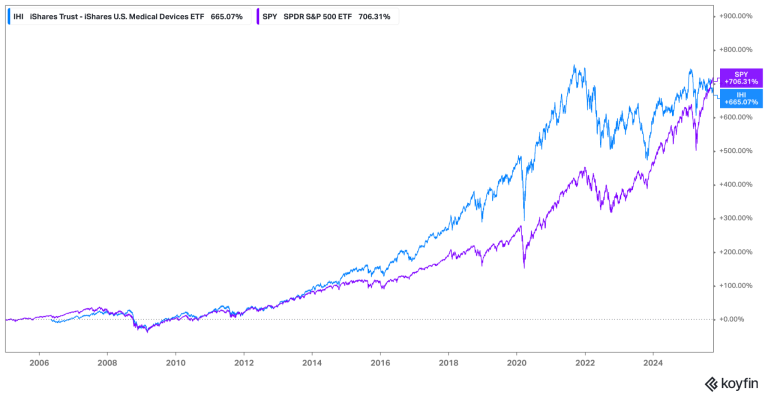
High-Beta Growth Characteristics
Biotechnology, particularly small- and mid-cap stocks tracked by indices like the XBI, functions as a high-beta growth sector. In “risk-on” market environments, biotech stocks amplify broader market movements, delivering outsized gains. Conversely, during risk-off periods, they suffer disproportionate declines as investors flee to safety.
Interest Rate Sensitivity: The Long-Duration Challenge
Biotech companies represent long-duration assets with cash flows heavily weighted toward the distant future. This makes valuations acutely sensitive to interest rate changes. When rates rise, the discount rates applied to future cash flows increase proportionally, reducing net present value (NPV) calculations and compressing valuations. This mathematical reality explains why biotech often underperforms dramatically in rising rate environments.
Capital Formation Windows
The ability to raise capital through initial public offerings (IPOs) and follow-on offerings fluctuates cyclically. “Open windows” emerge during periods of strong XBI performance and low market volatility (as measured by the VIX). During closed windows, companies—even those with promising pipelines—may find capital markets effectively inaccessible, forcing difficult decisions around cash runway and development priorities.
Innovation-Driven Enthusiasm
Periodic waves of excitement around breakthrough technologies can drive substantial sector inflows. Historical examples include the genomics revolution, the emergence of checkpoint inhibitors, and more recently, gene editing platforms like CRISPR. These innovation cycles create opportunities but also risks of excessive valuation during peak enthusiasm.
6.2 The M&A and Business Development Pendulum
Mergers and acquisitions (M&A) and business development and licensing (BD&L) represent critical drivers of returns in biotechnology, functioning as the sector’s primary liquidity mechanism for investors in smaller companies.
The Strategic Imperative: Patent Cliffs
Large pharmaceutical companies face a structural dependence on external innovation. As blockbuster drugs approach loss of exclusivity (LOE) and confront generic competition, these companies must continuously replenish their pipelines. Acquisitions and licensing deals provide the most reliable mechanism for accessing late-stage assets and innovative platforms.
Transaction Structures
Deal types vary based on strategic objectives. Bolt-on acquisitions target single assets or companies with late-stage products ready for commercialization, offering relatively predictable integration and near-term revenue contribution. Platform acquisitions represent more strategic bets, securing access to entire technology platforms—such as a novel drug delivery system or a new therapeutic modality—that can generate multiple future products.
Bridging Valuation Gaps
Deal structures often employ mechanisms to bridge disagreements between buyers and sellers about future value. Contingent Value Rights (CVRs) provide payments to shareholders if specific future milestones—such as regulatory approvals or sales targets—are achieved. However, CVRs present valuation challenges due to their contingent nature and often trade at significant discounts to their theoretical maximum value.
In partnerships and licensing deals, “biobucks”—the headline total potential deal value—can reach billions of dollars. However, sophisticated analysis requires risk-adjusting these figures, as milestone payments depend on successful achievement of development and commercial objectives that carry substantial uncertainty.
6.3 Alternative Financing: The Royalty Ecosystem
Beyond traditional equity and debt, specialized financing structures have emerged to address biotech’s unique capital needs.
Royalty aggregators purchase existing royalty streams from academic institutions, inventors, or early investors, providing immediate liquidity in exchange for future revenue rights. More recently, “synthetic royalties” or revenue-interest financings allow companies to monetize specific assets before approval by selling a percentage of future revenues. These structures provide non-dilutive capital but at the cost of reduced future economics.
6.4 Investor Pitfalls: Read-Throughs and Event Clustering
The Read-Through Trap
A common analytical error involves extrapolating clinical trial results from one company directly to competitors—the “read-through.” While superficially similar programs may appear comparable, differences in molecular design, patient population selection, trial endpoints, or dosing regimens frequently lead to divergent outcomes. Successful investors recognize that each program carries independent risk and avoid mechanical read-throughs without careful analysis of distinguishing factors.
Managing Event Clustering
Major medical conferences such as the American Society of Clinical Oncology (ASCO) and the American Society of Hematology (ASH) serve as key venues for clinical data presentations, often driving significant price movements across multiple companies within days. Similarly, regulatory events—particularly Advisory Committee (AdCom) meetings and Prescription Drug User Fee Act (PDUFA) decision dates—cluster around predictable timelines, creating periods of concentrated volatility.
Investors must manage portfolio exposure around these clustered events, as concentrated risk in a single therapeutic area or regulatory pathway can create correlated outcomes that undermine diversification.
7) Valuation Playbook for Biotech
Biotechnology valuation centers on the risk-adjusted net present value (rNPV) model, which forms the analytical foundation for assessing individual drug programs. For companies with multiple assets, analysts employ a sum-of-the-parts (SOTP) approach, valuing each program independently and aggregating the results.
7.1 Risk-Adjusted NPV Methodology
The rNPV framework calculates the present value of future cash flows generated by a drug program, explicitly adjusted for the probability that the program will successfully navigate clinical development and regulatory approval. This probability adjustment distinguishes biotech valuation from traditional discounted cash flow analysis.
The Core Formula
The rNPV calculation follows this structure:
rNPV = PoS × Σ [(CFt) / (1 + WACC)^t]
Where the probability of success (PoS) scales all future cash flows, and each year’s cash flow (CFt) is discounted back to present value using the weighted average cost of capital (WACC) raised to the power of the time period (t).
Building the Model: Critical Inputs
Constructing a robust rNPV model requires carefully estimating numerous interdependent assumptions, each carrying significant uncertainty.
- Market Opportunity and Commercial Assumptions
The foundation begins with defining the addressable market through rigorous epidemiological analysis. Analysts must identify the target patient population, considering factors such as disease prevalence, diagnosis rates, treatment eligibility, and current standard of care penetration.
Market share and penetration estimates follow, projecting the drug’s competitive positioning at peak market adoption. This requires assessing differentiation versus existing therapies, anticipated competition from pipeline products, and realistic prescriber adoption patterns. The launch curve models the trajectory from initial approval to peak sales, typically spanning 5-10 years depending on therapeutic area and commercial complexity.
Pricing assumptions must account for both the wholesale acquisition cost (WAC)—the list price—and the gross-to-net (GTN) discount percentage. The GTN adjustment captures mandatory rebates, contractual discounts to payers, patient assistance programs, and other price concessions. In the current environment, GTN adjustments of 40-60% are common, though they vary significantly by therapeutic area and payer mix.
Finally, the loss of exclusivity (LOE) timing and subsequent revenue decay curve model the patent cliff. Upon LOE, generic or biosimilar competition typically erodes revenues by 80-90% within 12-24 months for small molecules, though biologics may experience more gradual erosion.
- Cost Structure
Cost of goods sold (COGS) reflects manufacturing expenses as a percentage of revenue, varying dramatically by modality. Small molecules typically carry COGS of 10-20%, while complex biologics may reach 25-35%, and cell and gene therapies can exceed 50% given their manufacturing complexity.
Sales, general, and administrative (SG&A) expenses capture the costs of commercialization, including sales force deployment, marketing campaigns, and medical affairs activities. For specialty products, SG&A might represent 20-30% of revenues, while broad primary care launches can exceed 40%.
Research and development (R&D) costs include both the risk-adjusted cost to complete current development programs and ongoing R&D to support lifecycle management, line extensions, and label expansions post-launch.
- Financial and Structural Considerations
Tax rate assumptions and the value of net operating losses (NOLs) significantly impact valuation. Many biotechnology companies accumulate substantial NOLs during development, which can shield early profits from taxation, effectively increasing after-tax cash flows during the initial commercial years.
The discount rate—expressed as the weighted average cost of capital (WACC)—reflects the risk-adjusted return required by investors. Commercial-stage companies with approved products typically warrant WACCs of 10-12%, while development-stage companies face higher rates of 12-15% or more, reflecting greater uncertainty and risk.
- The Defining Variable: Probability of Success
Among all inputs, the probability of success (PoS) stands as the most critical and contentious assumption. As detailed in Section 2.1, PoS estimates vary widely by indication, phase of development, and program-specific factors. Small variations in PoS assumptions can swing valuations by hundreds of millions of dollars, making rigorous, evidence-based PoS estimation essential to credible analysis.
The art of biotech valuation lies in balancing optimism about a drug’s potential with realistic assessment of the substantial risks that must be overcome before that potential can be realized.
7.2 Portfolio Valuation: The Sum-of-the-Parts Approach
Companies with multiple drug programs or commercial products require a sum-of-the-parts (SOTP) valuation methodology. Rather than attempting to value the entire company as a single entity, analysts separately value each component and aggregate them to derive total enterprise value.
Constructing Enterprise Value
The SOTP framework builds enterprise value (EV) by systematically accounting for all value-generating assets within the company’s portfolio.
The foundation consists of inline products—already-approved and commercialized drugs generating current revenues. Each inline product receives its own rNPV calculation, projecting future cash flows until loss of exclusivity and subsequent generic erosion. These valuations typically carry higher certainty and lower discount rates given their commercial validation.
Pipeline programs in clinical development contribute the next layer of value. Each program undergoes independent rNPV analysis with probability of success adjustments appropriate to its development stage.
The aggregate pipeline value represents the sum of these risk-adjusted program valuations, though analysts must remain vigilant for potential portfolio-level correlations that could concentrate risk.
Beyond Individual Assets
Several additional value components warrant consideration depending on the company’s specific circumstances.
Platform value applies when a company possesses proprietary technology—such as a novel drug delivery system, unique manufacturing capability, or discovery engine—that can generate multiple future products beyond those currently in development. Valuing platforms requires estimating the probability-weighted value of future programs that might emerge, typically employing option value frameworks or conservative NPV assumptions.
Milestone payments and royalty streams from out-licensed assets or past partnerships contribute contractually defined cash flows. These require careful analysis of the triggering events, payment structures, and associated probabilities, though their contractual nature generally makes them more predictable than internal pipeline programs.
Priority Review Vouchers (PRVs), earned through approval of drugs for rare pediatric diseases or neglected tropical diseases, carry tangible value as tradeable assets. Recent PRV transactions have established a market value range, though this fluctuates with regulatory policy and the broader biotech funding environment.
Accounting for Corporate Costs
Enterprise value must be reduced by the present value of ongoing corporate overhead—the G&A expenses required to maintain the corporate structure that aren’t captured in individual program P&Ls. This includes executive compensation, public company costs, corporate facilities, and unallocated support functions.
The Bridge to Equity Value
The final step translates enterprise value into equity value by adjusting for the company’s net cash position:
Equity Value = Enterprise Value + Net Cash
Where net cash equals cash and marketable securities minus total debt obligations. Companies with substantial cash balances see equity value exceed enterprise value, while those carrying debt face a reduction. This net cash adjustment is particularly significant in biotech, where cash runway directly determines a company’s ability to fund development programs to value-inflecting milestones without dilutive financing.
The resulting equity value provides the theoretical fair value for the company’s entire equity capitalization, which can then be compared to market capitalization to assess relative valuation.
7.3 Validation Through Market Comparables
Risk-adjusted NPV models, despite their analytical rigor, require validation against market-based benchmarks. Relying solely on bottom-up modeling without cross-checking against observable market data can lead to valuations detached from investor reality.
Trading Multiples for Commercial Assets
For companies with approved products or late-stage assets nearing commercialization, enterprise value-to-sales (EV/Sales) multiples provide a useful sanity check. Forward EV/Sales ratios—using projected revenues 12-24 months ahead—allow comparison across companies at similar commercial stages. These multiples vary significantly by growth rate, profitability, and therapeutic area, but clusters typically emerge within comparable peer groups.
For late-stage pipeline assets approaching approval, a common heuristic values programs at 3-5 times projected peak sales, adjusted for risk and time to market. While crude, this rule of thumb reflects historical patterns in how markets value near-commercial assets and provides a rapid cross-check against detailed rNPV outputs.
Learning from Precedent Transactions
Precedent transaction analysis examines historical M&A deals and licensing agreements for comparable assets, providing market-validated benchmarks. By analyzing what acquirers actually paid for similar programs—accounting for stage of development, indication, and deal structure—analysts gain insight into market pricing conventions. However, transaction comparables require careful adjustment for deal-specific factors such as strategic rationale, competitive bidding dynamics, and the acquiring company’s specific needs.
7.4 Embracing Uncertainty: Sensitivity and Scenario Analysis
Given the inherent uncertainty in biotech valuation, responsible analysis requires explicitly modeling a range of potential outcomes rather than relying on a single point estimate.
Scenario Construction
Scenario analysis defines distinct cases—typically Base, Bear, and Bull—each reflecting internally consistent sets of assumptions. The Base case represents the most probable outcome based on balanced assumptions. The Bear case models disappointing but plausible scenarios, such as narrower label indications, deeper pricing pressure, or slower market adoption. The Bull case captures upside potential from favorable outcomes like broader indications, faster penetration, or additional lifecycle opportunities.
Presenting valuations across these scenarios acknowledges uncertainty while providing a framework for understanding the range of potential outcomes and their probabilities.
Visualizing Sensitivity with Tornado Charts
Tornado charts offer powerful visualization of how individual assumptions drive valuation outcomes. By varying each key input—probability of success, peak market share, pricing, discount rate—while holding others constant, analysts identify which variables exert the greatest influence on rNPV. The resulting chart displays sensitivity in rank order, with the most impactful variables appearing at the top.
This analysis reveals where additional diligence would most improve conviction, guides risk management strategies, and helps investors understand which future events will most significantly move valuations.
7.5 Avoiding Common Valuation Pitfalls
Even experienced analysts fall prey to recurring errors in biotech valuation. Recognizing these pitfalls improves analytical discipline and prevents systematic bias.
Probability of Success Inflation
The most prevalent error involves unrealistic probability of success assumptions. Analysts often anchor on a company’s optimistic projections without sufficient skepticism, or fail to adjust base rates for program-specific risk factors. Overstating PoS by even 10-20 percentage points can inflate valuations by hundreds of millions of dollars, creating a false sense of value that market reality eventually corrects.
Market Access Naïveté
Assuming frictionless market adoption ignores the substantial hurdles that drugs face post-approval. Payer resistance manifests through formulary restrictions, step therapy requirements, and prior authorization barriers that slow adoption curves. Deep gross-to-net discounts required to secure access erode realized pricing. Models that assume rapid uptake to peak market share without accounting for these real-world constraints systematically overstate commercial potential.
Manufacturing Complexity Blindness
Chemistry, manufacturing, and controls (CMC) risks frequently receive insufficient attention in early-stage valuations. Complex modalities—particularly cell and gene therapies or antibody-drug conjugates—face substantial manufacturing scale-up risk, supply chain vulnerabilities, and cost structures that can fundamentally alter program economics. Underestimating COGS or ignoring manufacturing feasibility risk leads to overly optimistic projections.
Commercial Infrastructure Underestimation
Successfully launching a drug requires substantial commercial infrastructure investment. Sales force deployment, market access teams, medical affairs organizations, and marketing campaigns demand significant SG&A spending that scales with the breadth of prescriber and patient populations. Models that apply generic SG&A assumptions without considering therapeutic area-specific requirements or the company’s existing capabilities tend to understate the true cost of commercialization.
Global Pricing Assumptions
Projecting U.S. pricing globally represents a fundamental error. Ex-U.S. markets achieve prices typically 30-70% below U.S. levels due to government price controls, health technology assessment requirements, and international reference pricing dynamics. Failing to apply appropriate regional price adjustments dramatically overstates total addressable market value.
The Dilution Oversight
Finally, many valuations ignore future dilution from equity financing required to fund development. Pre-revenue biotechnology companies regularly raise capital through offerings that dilute existing shareholders. Sophisticated valuation incorporates expected future financing needs, dilution from these raises, and their impact on per-share value. Ignoring this reality presents an artificially optimistic picture for current equity holders.
Avoiding these pitfalls requires disciplined assumptions, conservative base cases, and constant reality-checking against both clinical data and market dynamics.
8. Therapeutic Area Snapshots
Understanding the strategic landscape of major therapeutic areas provides essential context for evaluating individual programs. Each therapeutic area exhibits distinct competitive dynamics, regulatory pathways, clinical development challenges, and commercial considerations that fundamentally shape program economics and risk profiles.
8.1 Oncology: The Innovation Epicenter
Oncology commands the largest share of both R&D investment and global pharmaceutical market size, driven by high unmet medical need, rapid scientific innovation, and willingness from payers and patients to embrace novel therapies. The global oncology market is projected to exceed $350 billion by 2027, reflecting both expanding treatment options and growing patient populations [IQVIA Institute, Global Oncology Trends 2023, May 2023].
Standard of Care Evolution
Immuno-oncology has fundamentally reshaped cancer treatment, with PD-1 and PD-L1 checkpoint inhibitors now serving as backbone therapy for many solid tumors. These agents have moved from late-line salvage treatments to first-line standards, often in combination regimens. This evolution creates both opportunity—as novel agents seek to combine with IO—and challenge, as new entrants must demonstrate incremental benefit over an increasingly effective standard of care.
Emerging Therapeutic Frontiers
Three major trends are reshaping the competitive landscape. IO combination strategies dominate clinical development, seeking to overcome resistance mechanisms through multi-pronged immune activation. Antibody-drug conjugates (ADCs) have rapidly emerged as a major therapeutic class, offering the targeting precision of antibodies with the potent cell-killing capacity of cytotoxic payloads. Cell therapies, particularly CAR-T products, have established proof of concept in hematologic malignancies and now pursue the considerably more challenging solid tumor setting.
Regulatory and Clinical Considerations
Overall survival (OS) remains the gold standard endpoint, providing unambiguous evidence of clinical benefit. However, the FDA frequently grants Accelerated Approval based on progression-free survival (PFS) or objective response rate (ORR) for drugs addressing high unmet need. This creates significant confirmatory risk—companies must subsequently validate the surrogate endpoint benefit with OS data in confirmatory trials, and failure to do so can result in withdrawal of approval, destroying commercial value despite initial market access.
8.2 Immunology and Inflammation: Established Market Disruption
The immunology and inflammation (I&I) therapeutic area encompasses chronic diseases such as rheumatoid arthritis, psoriasis, inflammatory bowel disease, and other immune-mediated conditions. This large, established market has been characterized by high biologic utilization and intense competition among mechanism classes.
The Anti-TNF Era and Its Disruption
For two decades, anti-TNF biologics dominated I&I treatment, led by blockbusters like Humira. However, the market is experiencing fundamental disruption from two directions. Mechanistically, newer biologic classes targeting specific interleukins—particularly IL-17 and IL-23 inhibitors—offer improved efficacy or safety profiles for certain indications, gradually capturing share through “IL-class laddering” as physicians optimize patient-specific therapy selection. JAK inhibitors provide oral bioavailability advantages but face ongoing safety scrutiny following FDA warnings about cardiovascular and malignancy risks.
Novel mechanisms continue to emerge, including FcRn inhibitors that reduce pathogenic antibody levels, representing entirely new approaches to autoimmune disease management.
The second major disruption comes from biosimilars. The entry of multiple biosimilar competitors for major anti-TNFs, most notably Humira, has dramatically reshaped market economics, accelerating price erosion and forcing incumbent manufacturers to defend share through rebating and contracting strategies.
Commercial Realities
Payers manage the I&I category intensively given its large patient populations and chronic treatment duration. Significant rebates drive gross-to-net discounts exceeding 50% in many cases, compressing realized revenues far below list prices. Prior authorization requirements, step therapy protocols, and formulary positioning create substantial market access friction that shapes launch curves and peak share potential.
8.3 Rare and Genetic Diseases: The High-Price, High-Innovation Frontier
Rare diseases—affecting small patient populations—represent a strategically attractive therapeutic area characterized by high unmet need, premium pricing, and increasing focus on potentially curative therapies. Orphan drug sales are projected to reach $268 billion by 2028, reflecting both the proliferation of approved rare disease therapies and their substantial per-patient pricing [Evaluate Vantage, Orphan Drug Report 2023, 2023].
Technological Convergence
Three transformative technology platforms are converging on rare genetic diseases. Gene therapy, predominantly using AAV vectors, can potentially correct genetic defects with a single treatment. Gene editing technologies like CRISPR offer even more precise genetic modification. RNA therapeutics, including antisense oligonucleotides and siRNA, provide a third modality for modulating disease-causing genes. This technological diversity creates competitive dynamics where multiple approaches may target the same rare disease, each with distinct risk-benefit profiles.
Unique Development Challenges
Patient identification represents a fundamental hurdle. Many rare diseases suffer from diagnostic delays, small dispersed patient populations, and limited natural history data. Enrolling adequately powered clinical trials can take years and require global recruitment efforts.
Manufacturing complexity, particularly for cell and gene therapies, creates both technical risk and cost structure challenges. Autologous cell therapies require patient-specific manufacturing, while gene therapy vector production faces yield and quality challenges that constrain commercial scalability.
Perhaps most critically, durability of effect remains uncertain for many one-time genetic medicines. Long-term follow-up data extending 5-10 years or more is essential to validate claims of durable benefit, yet this evidence lags years behind initial approval.
Payer Dynamics
Payers have demonstrated willingness to reimburse premium prices for rare diseases, recognizing small budget impact and high unmet need. However, multi-million dollar one-time treatments are testing this willingness and prompting evolution toward value-based agreements (VBAs). These innovative contracting structures tie payment to long-term outcomes, addressing payer concerns about durability while providing manufacturers with pathways to appropriate reimbursement.
8.4 Neurology: Biological Complexity Meets Clinical Challenge
Neurology has historically proven among the most challenging therapeutic areas, reflecting fundamental biological obstacles and clinical development difficulties. The blood-brain barrier restricts drug delivery to the central nervous system. Disease biology often remains incompletely understood. Clinical endpoints frequently rely on subjective functional scales rather than objective biomarkers. High placebo response rates, particularly in pain and neurodegenerative conditions, obscure true treatment effects.
Alzheimer’s Disease: A Landscape in Transition
Alzheimer’s disease exemplifies both the challenges and recent progress in neurology. After decades of failures, anti-amyloid antibodies have finally demonstrated modest clinical benefit, securing FDA approvals despite significant controversy about benefit-risk balance. The field is now pursuing second-generation approaches, including tau-targeting therapies and combination strategies addressing multiple pathological pathways simultaneously.
Beyond Alzheimer’s, genetically defined neurological diseases—where specific genetic mutations drive disease—offer more tractable targets. Clear genetic causality, measurable biomarkers, and well-defined patient populations improve development probability of success compared to complex neurodegenerative conditions.
Clinical and Commercial Hurdles
High placebo response rates in many neurological conditions necessitate larger trial sizes and longer duration to achieve statistical significance, increasing development costs and timelines. Reliance on subjective functional scales, such as cognitive assessments or quality-of-life instruments, introduces measurement variability and regulatory skepticism.
Payer posture in neurology remains conservative. Clear demonstration of functional improvement—not just biomarker changes—is required for reimbursement. The controversial Alzheimer’s antibody approvals have intensified payer scrutiny, with CMS imposing restrictive coverage policies that limit real-world access despite FDA approval.
8.5 Metabolic and Cardio-Renal: Large Markets, Transformative Innovation
Metabolic and cardiovascular-renal diseases affect enormous patient populations, creating markets where even modest improvements in standard of care generate substantial value. Type 2 diabetes, obesity, heart failure, and chronic kidney disease represent interconnected conditions often sharing common pathological mechanisms.
The GLP-1 Revolution
GLP-1 receptor agonists have revolutionized metabolic disease treatment, transforming both type 2 diabetes and obesity management. These agents demonstrate not only glucose control and weight loss but also cardiovascular and renal protective effects validated in cardiovascular outcomes trials (CVOTs). The success has triggered intense competition for next-generation incretin therapies, including oral formulations, longer-acting compounds, and multi-agonists targeting GLP-1 plus additional pathways like GIP or glucagon.
Payer Economics and Evidence Requirements
The large prevalent populations affected by metabolic diseases create significant budget impact concerns for payers. Diabetes treatment faces substantial gross-to-net pressure as payers negotiate aggressive rebates to manage costs. Coverage for obesity medications is evolving, with many payers historically excluding weight loss drugs but now reconsidering given the magnitude of health benefits demonstrated in recent trials.
Critically, payers demand demonstration of long-term cardiovascular and renal outcomes through dedicated CVOTs. These large, expensive, multi-year trials have become the standard for differentiation and market access in metabolic disease, fundamentally shaping development strategies and timelines. Positive CVOT results can transform commercial trajectories, while neutral or negative outcomes can severely limit market penetration regardless of metabolic efficacy.
9. Case Studies: Archetypal Biotechnology Business Models
The following profiles examine representative biotechnology companies across different business model archetypes and development stages. These case studies, reflecting the landscape as of October 2025, illustrate how strategic positioning, pipeline composition, and commercial execution shape investment considerations. Financial data and timelines are illustrative for analytical purposes.
9.1 The Platform Company: CRISPR Therapeutics (CRSP)
Strategic Positioning: Gene Editing Pioneer
CRISPR Therapeutics represents the platform company archetype—organizations built around proprietary enabling technologies that can generate multiple therapeutic programs. The company leverages its CRISPR/Cas9 gene editing platform to develop both ex vivo therapies (where cells are edited outside the body) and in vivo therapies (where editing occurs directly in patients).
The company’s most significant validation came with Casgevy (exagamglogene autotemcel), developed in partnership with Vertex Pharmaceuticals, which secured regulatory approval for sickle cell disease (SCD) and transfusion-dependent beta-thalassemia (TDT). This landmark approval—the first CRISPR-edited therapy reaching market—validates the core technology while generating partnership economics. Beyond Casgevy, CRISPR Therapeutics maintains wholly-owned programs in CAR-T oncology and in vivo gene editing, offering upside optionality independent of the Vertex collaboration.
Critical Performance Metrics
Three key performance indicators drive CRISPR’s investment narrative. First, Casgevy launch metrics—particularly patient treatment numbers and reimbursement success—provide real-world validation of both the therapy’s clinical value and the practical feasibility of complex autologous cell therapy commercialization. Second, clinical progress in next-generation CAR-T programs will determine whether the platform can expand beyond rare genetic diseases into larger oncology markets. Third, validation of the in vivo editing platform through positive clinical data would dramatically expand the addressable opportunity, as in vivo therapies avoid the manufacturing complexity inherent in ex vivo approaches.
Scenario Analysis
The base case envisions steady Casgevy rollout as treatment centers establish capabilities and payers implement coverage, combined with encouraging CAR-T clinical data that supports continued investment. Bear case risks center on slower-than-expected Casgevy adoption due to treatment center capacity constraints or reimbursement friction, safety concerns from off-target editing effects that shake confidence in CRISPR technology broadly, or outright failures in the wholly-owned pipeline that would concentrate value in the Vertex partnership. The bull case requires transformative in vivo platform validation through compelling clinical data that demonstrates durable efficacy with acceptable safety, enabling rapid expansion across multiple disease targets.
Near-term catalysts include commercial updates on Casgevy patient starts and revenue trajectory, along with clinical data readouts from the CAR-T oncology pipeline.
9.2 The Late-Stage Oncology Developer: ADC Therapeutics (ADCT)
Focused ADC Strategy
ADC Therapeutics exemplifies the focused late-stage development company in oncology, concentrating its efforts on antibody-drug conjugates—a technology platform combining antibody targeting with cytotoxic payloads. The company’s sole commercial asset, Zynlonta (loncastuximab tesirine), secured approval for relapsed/refractory diffuse large B-cell lymphoma (DLBCL), establishing a revenue base while the pipeline pursues label expansion opportunities.
Commercial Execution and Pipeline Advancement
Three metrics define ADCT’s investment story. Zynlonta’s sales trajectory determines current cash generation and validates the commercial infrastructure. Pivotal trial progress for moving Zynlonta into earlier lines of therapy—where patient populations expand dramatically—represents the primary value driver. Cash runway calculations dictate whether the company can self-fund to these value-inflection points or will require dilutive financing.
Navigating Intense Competition
The investment case hinges critically on successful commercial execution and clinical advancement in a highly competitive DLBCL landscape. The base case assumes steady Zynlonta adoption in its approved late-line setting combined with positive data supporting earlier-line use. However, bear case risks loom large: DLBCL has become intensely competitive with CAR-T cell therapies and bispecific antibodies demonstrating remarkable efficacy, potentially compressing Zynlonta’s market opportunity. Pipeline setbacks in earlier-line studies would eliminate the primary growth driver, leaving a late-line-only asset with constrained commercial potential.
The bull scenario requires clinical differentiation—perhaps through combination regimens or biomarker-selected populations—that establishes Zynlonta as preferred therapy in specific DLBCL segments despite fierce competition.
Near-term catalysts center on pivotal trial readouts for Zynlonta combination studies that could expand the label and market opportunity.
9.3 The Rare Disease Specialist: Ultragenyx Pharmaceutical (RARE)
Multi-Modality Rare Disease Portfolio
Ultragenyx represents a scaled rare disease company with multiple approved products and a technology-agnostic approach spanning biologics, gene therapy, and mRNA platforms. This diversified rare disease strategy provides revenue stability from the commercial portfolio while pursuing transformational gene therapy opportunities in diseases like Wilson disease and ornithine transcarbamylase (OTC) deficiency.
Balanced Growth and Innovation
The company’s key performance indicators reflect its dual identity as both commercial operator and late-stage developer. Revenue growth from the existing commercial portfolio funds operations and validates the rare disease business model. Pivotal data from gene therapy programs represents the primary value creation opportunity, as successful one-time curative therapies command premium pricing and transform treatment paradigms. Regulatory execution—particularly in coordinating FDA interactions for novel modalities and securing timely approvals—determines the pace of value realization.
Gene Therapy Execution Risk
Ultragenyx’s investment case depends heavily on successful execution of late-stage gene therapy programs, which carry substantial binary risk. The base case assumes positive pivotal data and regulatory approvals that expand the commercial portfolio with high-value gene therapy assets. Bear case scenarios include clinical failures that would destroy near-term pipeline value, AAV-related safety signals that could affect multiple programs simultaneously, or regulatory delays that extend time-to-market and burn cash. The bull case envisions not only successful gene therapy approvals but also platform validation that enables rapid expansion into additional rare genetic diseases.
Near-term catalysts include Phase 3 data readouts from lead gene therapy assets, which will provide definitive risk resolution on the most valuable pipeline programs.
9.4 The Commercial SMID-Cap: Neurocrine Biosciences (NBIX)
Established Neuroscience Franchise
Neurocrine Biosciences exemplifies the successful commercial-stage small- to mid-cap biotechnology company. The company built its foundation on Ingrezza (valbenazine), the leading therapy for tardive dyskinesia—a debilitating movement disorder. This flagship asset generates substantial cash flows while the company advances a pipeline focused on expanding indications for existing assets and developing novel therapies in adjacent neurology and psychiatry areas, including schizophrenia.
Operational Excellence and Pipeline Progress
Three metrics capture Neurocrine’s value drivers. Ingrezza sales growth and gross-to-net percentage trends determine current profitability and the sustainability of the franchise amid potential competition. Pipeline advancement, particularly progression of Phase 3 assets, will determine whether Neurocrine can diversify beyond single-product dependence. Operating margin expansion reflects the company’s ability to leverage commercial infrastructure and achieve profitability levels typical of mature biotechnology companies.
Defending and Expanding the Franchise
The base case projects continued Ingrezza growth as the tardive dyskinesia market expands with increased awareness and diagnosis, supplemented by successful advancement of key pipeline programs that begin contributing to revenue by the late 2020s. Bear case risks include pipeline failures that would leave the company dependent on a single mature asset facing eventual competitive pressure, or earlier-than-expected competition in tardive dyskinesia that erodes Ingrezza’s market position. The bull scenario requires successful development of multiple pipeline assets that establish Neurocrine as a diversified neuroscience company with multiple commercial franchises.
Near-term catalysts focus on Phase 3 data readouts for priority pipeline assets that will determine the probability of achieving portfolio diversification.
9.5 The Diversified Leader: Vertex Pharmaceuticals (VRTX)
From Dominant Franchise to Portfolio Transformation
Vertex Pharmaceuticals represents a unique position in biotechnology: a company that achieved dominance in a single disease area—cystic fibrosis—and now aggressively pursues diversification into cell and gene therapy and other modalities. The company’s CF franchise, built on breakthrough CFTR modulators, generates billions in annual revenue and creates a cash engine funding ambitious expansion into entirely new therapeutic areas.
Strategic Diversification Initiatives
Vertex’s strategic positioning encompasses both defending an exceptional existing franchise and building new growth drivers. In cell and gene therapy, the company co-developed Casgevy with CRISPR Therapeutics for sickle cell disease and beta-thalassemia, marking its entry into genetic medicine. The wholly-owned pipeline includes a potentially transformative cell therapy program for Type 1 diabetes that could functionally cure the disease, and VX-548, a novel non-opioid pain medication addressing an enormous market opportunity.
Performance Metrics Across the Portfolio
Three key performance indicators define Vertex’s investment narrative. CF franchise durability—maintaining revenue and market share against potential competitive threats—provides the foundation. Casgevy launch execution tests Vertex’s ability to successfully commercialize complex cell therapies in new therapeutic areas. Pipeline diversification success, particularly in Type 1 diabetes and pain, will determine whether Vertex can replicate its CF success in other disease areas and justify its premium valuation.
Validating the Diversification Strategy
The base case assumes continued CF franchise strength combined with successful clinical validation of at least one major non-CF asset, establishing Vertex as a multi-franchise company. Bear case risks include failure of high-profile pipeline programs—particularly the closely watched Type 1 diabetes program—which would raise questions about the company’s ability to replicate its CF success, or unexpected competition in CF from emerging therapies that threaten the core franchise. The bull scenario requires clinical home runs in multiple diversification programs, potentially establishing Vertex as a leader in both genetic medicine and other therapeutic areas.
Near-term catalysts include clinical updates from the Type 1 diabetes cell therapy program, which represents perhaps the highest-conviction opportunity for transformative impact, and Phase 3 data and regulatory filing for VX-548 in pain, which addresses a massive commercial opportunity if successful.
10) Analyst Dashboard & Calendars
Effective biotechnology analysis requires establishing systematic monitoring of multiple information streams that flow continuously and often unpredictably. Building a robust information architecture—tracking the right data sources at the right frequency—separates sophisticated analysis from reactive commentary.
Regulatory Event Tracking: The Highest-Conviction Catalysts
Regulatory milestones represent the most predictable and consequential catalysts in biotechnology, making comprehensive tracking essential. FDA PDUFA (Prescription Drug User Fee Act) dates establish legally binding deadlines for regulatory decisions, creating known binary events that drive significant volatility. These dates are published months in advance, allowing analysts to prepare investment frameworks and position ahead of outcomes.
Advisory Committee (AdCom) meetings occur when the FDA convenes external experts to debate contentious approval decisions. While technically non-binding, AdCom votes heavily influence final FDA determinations and often generate substantial market movement. Tracking the FDA’s AdCom calendar and understanding which applications warrant external review provides advance warning of potential controversy.
European regulatory pathways follow parallel but distinct timelines. The European Medicines Agency’s Committee for Medicinal Products for Human Use (CHMP) meets monthly to issue opinions on marketing authorization applications. Following CHMP meeting schedules and anticipated opinion dates enables tracking of ex-U.S. regulatory progress.
Health technology assessment timelines, particularly from influential bodies like NICE in the UK and G-BA in Germany, determine pricing and reimbursement outcomes that can equal or exceed the importance of regulatory approval itself. Monitoring HTA calendars reveals when market access decisions will resolve, often months after initial approval.
Clinical Data Flow: Anticipating Scientific Catalysts
Clinical trial registries provide essential infrastructure for tracking development progress. ClinicalTrials.gov in the United States and the EU Clinical Trials Register offer real-time visibility into trial status changes, protocol amendments, enrollment updates, and—critically—results posting. Monitoring these databases reveals enrollment completion, unexpected protocol changes that may signal efficacy or safety issues, and preliminary results before formal publication.
Medical meeting calendars structure the clinical data release calendar. Major oncology conferences like the American Society of Clinical Oncology (ASCO) and American Society of Hematology (ASH) serve as preferred venues for companies to present pivotal data. Tracking abstract submission and presentation schedules often provides weeks or months of advance notice for anticipated data readouts. The J.P. Morgan Healthcare Conference in January has become the de facto industry gathering where companies provide annual guidance and strategic updates, making it essential for understanding management priorities.
Capital Markets Pulse: Gauging Sector Sentiment
Biotechnology operates within broader capital markets cycles that fundamentally affect company valuations and financing ability. Tracking sector-specific indices—particularly the SPDR S&P Biotech ETF (XBI) and iShares Biotechnology ETF (IBB)—provides real-time sentiment indicators. XBI, with its equal-weight methodology, offers particular insight into small- and mid-cap biotech performance and risk appetite.
IPO and follow-on offering cadence serves as a leading indicator of financing windows. Periods of robust IPO activity signal open capital markets and risk-on sentiment, while IPO droughts reveal closed windows that constrain capital formation. Monitoring the IPO pipeline and pricing outcomes helps assess whether companies will be able to access capital when needed.
Macro indicators, particularly the VIX volatility index and interest rate movements, drive biotech valuations through the mechanisms discussed in Section 6. Systematic tracking of these inputs enables anticipation of sector-wide valuation pressure or expansion independent of company-specific developments.
Safety Surveillance: Early Warning Systems
The FDA Adverse Event Reporting System (FAERS) database provides public access to post-marketing adverse event reports. While this data requires careful interpretation—reports do not establish causality and vary in quality—systematic monitoring can identify emerging safety signals before they become widely recognized. Unusual clustering of serious adverse events, even in preliminary reports, warrants investigation and may presage regulatory actions.
FDA safety alerts, recalls, and communications represent official regulatory concerns that often drive immediate market impact. Establishing notification systems for these announcements ensures real-time awareness of safety developments across the sector.
Manufacturing Capacity Constraints: The Hidden Bottleneck
Contract development and manufacturing organization (CDMO) capacity represents an often-overlooked factor that can constrain entire therapeutic modalities. Viral vector manufacturing capacity, essential for gene therapy and some vaccine applications, has experienced persistent constraints that limit production scale and increase costs. Similarly, specialized manufacturing capabilities for complex modalities—such as autologous CAR-T production or antibody-drug conjugate synthesis—can create bottlenecks.
Monitoring CDMO announcements about capacity expansions, technology partnerships, and manufacturing constraints provides early insight into which modalities may face supply limitations. Understanding manufacturing capacity dynamics helps assess execution risk for companies dependent on constrained manufacturing technologies.
Building the Information Edge
The analyst who systematically monitors these diverse information streams—regulatory calendars, clinical registries, capital markets indicators, safety databases, and manufacturing capacity—develops an information advantage over those who react to events after they occur. The compounding effect of small informational edges across dozens of monitored inputs creates the foundation for superior analytical insights and investment decisions.
11) Toolkit for Juniors
11.1 Twelve Diligence Questions
- Target Biology and MoA: Is the target validated by human genetics or clinical data?
- PoS Precedent: What is the historical PoS for this TA/modality?
- Trial Design: Are the endpoints, comparator, and statistical plan robust and aligned with regulatory expectations?
- CMC Readiness: Is the manufacturing process scalable, validated, and characterized?
- CDMO Risk: Is the company reliant on third-party manufacturers? What is their GMP track record?
- IP/FTO: Is the intellectual property defensible (Composition of Matter)? Is there Freedom to Operate (FTO)?
- Payer Access Plan: What is the pricing and reimbursement strategy? What is the pharmacoeconomic rationale?
- Safety Margin: What is the therapeutic window? Are Adverse Events (AEs) manageable?
- Manufacturing Yields/COGS: What are the expected COGS at commercial scale?
- Competitive Landscape: How differentiated is the asset from SoC and pipeline competitors?
- Capitalization: Does the company have sufficient cash runway to the next inflection point?
- Ex-U.S. Strategy: What is the plan for global development/commercialization and HTA engagement?
11.2 Data-Gathering Checklist
- Company Filings: SEC Filings (10-K, 10-Q, 8-K), Investor Decks, Earnings Transcripts.
- Regulatory Documents: FDA Guidance Documents, AdCom Briefing Docs, Approved Labels (Drugs@FDA), EPARs (EMA).
- Clinical Data: ClinicalTrials.gov, Published Manuscripts (PubMed), Medical Meeting Presentations/Abstracts.
- IP Databases: USPTO, FDA Orange Book/Purple Book, WIPO PatentScope.
11.3 rNPV Mini-Model Skeleton
Building an rNPV model requires systematic progression through interconnected analytical layers, each building upon the previous foundation. Understanding this structural architecture ensures comprehensive coverage of all value drivers while maintaining internal consistency.
The Market Foundation
The model begins with epidemiological analysis that defines the total disease population. From this starting point, the addressable population emerges after applying appropriate filters: diagnosed patients, treatment-eligible patients based on label restrictions, and patients who gain access given reimbursement and distribution realities. Peak market share assumptions then determine the program’s competitive positioning at maturity, reflecting differentiation versus existing and anticipated therapies. The launch curve models the trajectory from initial approval to peak penetration, typically spanning five to ten years depending on therapeutic area dynamics. These components combine to generate the treated patient forecast—the fundamental driver of all subsequent revenue projections.
Revenue Architecture
Treated patient volumes convert to net revenue through pricing assumptions. The wholesale acquisition cost (WAC) represents list pricing, which then suffers reduction through gross-to-net (GTN) adjustments capturing rebates, discounts, and other price concessions. Multiplying treated patients by net realized price yields the net revenue forecast that forms the top line of the financial model.
Cost Structure Modeling
Three major expense categories reduce revenue to operating profit. Cost of goods sold (COGS) reflects manufacturing expenses scaled to revenue. Sales, general, and administrative (SG&A) expenses capture commercialization costs required to generate sales. Research and development (R&D) includes the risk-adjusted cost to complete current development programs plus ongoing R&D to support lifecycle management and label expansions post-launch.
From Revenue to Value
The valuation calculation proceeds methodically from net revenue through operating profit (EBIT), then applies tax adjustments—accounting for tax rates and the value of net operating losses that shield early profits—to reach net operating profit after tax (NOPAT). Adjustments for non-cash items and working capital changes yield unlevered free cash flow (UFCF), representing the actual cash generation available to all capital providers.
These annual UFCF projections are discounted back to present value using the weighted average cost of capital (WACC), producing the net present value (NPV). The final step applies the probability of success (PoS) as a scalar: rNPV equals NPV multiplied by PoS, yielding the risk-adjusted valuation that accounts for development and regulatory uncertainty.
Sensitivity and Scenario Analysis
Comprehensive analysis requires understanding how valuation responds to assumption changes. Tornado charts visualize sensitivity by varying key inputs—probability of success, peak market share, pricing, and discount rate—while holding others constant. This reveals which assumptions drive valuation most significantly and therefore warrant the greatest analytical scrutiny and diligence.
11.4 The Development and Approval Event Path
Understanding the typical sequence of catalysts from proof-of-concept through commercial launch provides a framework for tracking program progression and anticipating future value-inflection points.
Early Clinical Validation
The pathway begins with Phase 2 data readout, where the program demonstrates proof-of-concept efficacy and acceptable tolerability in patients. This represents the first substantial clinical validation and typically drives significant de-risking of the probability of success. Successful Phase 2 data establishes the scientific rationale for advancing to pivotal development.
Regulatory Alignment
Following positive Phase 2 results, companies typically request an End-of-Phase-2 (EoP2) meeting with the FDA to achieve alignment on pivotal trial design. This critical regulatory interaction secures agreement on primary endpoints, patient population, trial size, and success criteria. EoP2 meeting outcomes directly influence Phase 3 probability of success, as FDA agreement substantially reduces the risk of future regulatory rejection based on trial design deficiencies.
Pivotal Development
Phase 3 initiation marks the beginning of pivotal development, with enrollment commencing in the registrational trials designed to support approval. The enrollment period typically spans one to three years depending on indication and trial complexity, though rare disease programs or trials with restrictive eligibility may extend longer.
Phase 3 topline data readout represents the most significant binary catalyst in drug development. Topline results—reporting whether the trial met its primary endpoint—provide the first indication of pivotal success or failure. Positive topline data typically drives substantial appreciation as approval probability increases dramatically, while failure often results in severe valuation destruction.
Regulatory Submission and Review
Following successful Phase 3 results, companies file either a New Drug Application (NDA) for small molecules or Biologics License Application (BLA) for biologics. The FDA assigns a PDUFA date—the target decision deadline—typically ten months after filing for priority review or standard ten-month review, creating a known catalyst on the calendar.
For controversial or complex applications, the FDA may convene an Advisory Committee (AdCom) meeting where external experts publicly debate the risk-benefit profile and vote on whether to recommend approval. While non-binding, AdCom votes strongly influence final FDA decisions and create significant volatility.
The PDUFA date brings the binary approval decision. Approval unlocks commercial launch and validates years of development investment. Complete Response Letters (CRLs)—effectively rejections requiring additional data or analysis—delay market entry and can destroy substantial value depending on the issues identified.
Commercial Realization
Upon approval, the focus shifts to commercial execution. Pricing and reimbursement negotiations with payers determine market access and realized pricing. Sales force deployment and market access infrastructure development prepare for launch. The initial launch quarters provide early signals about commercial potential, physician adoption, and payer receptivity that validate or challenge pre-launch commercial assumptions.
This event pathway—from Phase 2 through commercial launch—provides the roadmap for tracking development progress, anticipating catalysts, and assessing which upcoming events carry the greatest potential to move valuations.
12) Conclusion: Key Takeaways
Biotechnology investing stands apart from traditional equity analysis through its unique combination of scientific uncertainty, binary outcomes, and transformative potential. Success in this sector requires not merely understanding these characteristics but building systematic frameworks to navigate them effectively.
Embracing Binary Risk
The defining feature of biotechnology investment remains its high-risk, high-reward profile. Low probabilities of success—driven by high clinical and regulatory attrition rates—combine with substantial capital requirements to create investments characterized by binary outcomes. Programs either succeed and generate exceptional returns, or fail and destroy invested capital. This reality demands position sizing discipline, portfolio diversification, and psychological resilience to withstand inevitable setbacks while maintaining conviction in winners.
Unlike traditional industries where incremental progress and gradual value creation dominate, biotechnology delivers value through discrete, identifiable inflection points. A single Phase 3 readout can double a company’s valuation or reduce it to salvage value within hours. Understanding and preparing for this binary nature—rather than fighting against it—represents the foundation of successful biotech investing.
Valuation Discipline Through Risk-Adjusted NPV
The risk-adjusted net present value model provides the analytical anchor for biotechnology valuation, serving as both a rigorous framework and a common language across the investment community. The rNPV methodology forces explicit articulation of assumptions about probability of success, market potential, competitive dynamics, pricing realization, and cost structures. This granular approach—while time-consuming and assumption-laden—prevents the hand-waving optimism that often accompanies excitement about novel science.
Valuation discipline requires resisting the temptation to simply accept company projections or consensus estimates. Instead, building bottoms-up models with defensible assumptions, then stress-testing those assumptions through scenario and sensitivity analysis, separates sophisticated analysis from superficial commentary. The analysts who consistently generate alpha are those who maintain rigorous valuation frameworks even when market sentiment drives prices far from fundamental value.
Regulatory and Manufacturing Reality
Scientific innovation, while necessary, proves insufficient for success. Navigating FDA and EMA regulatory pathways, understanding the nuances of clinical trial design, and securing robust chemistry, manufacturing, and controls capabilities represent essential but often underestimated challenges. Companies fail not only because their science proves wrong, but because they designed inadequate trials, encountered manufacturing obstacles, or misread regulatory expectations.
CMC risk, in particular, receives insufficient attention from many investors focused primarily on clinical data. Yet manufacturing failures can delay launches by years, dramatically inflate costs, or prevent commercialization entirely. The complexity of modern biologics, cell therapies, and gene therapies magnifies these risks, making manufacturing diligence as important as clinical assessment for complex modalities.
The Modality Imperative
Different therapeutic modalities carry fundamentally distinct risk profiles, development timelines, manufacturing requirements, and economic characteristics. Monoclonal antibodies, cell and gene therapies, RNA therapeutics, and small molecules cannot be analyzed using identical frameworks. Each modality demands specific technical expertise, understanding of modality-specific risks, and awareness of the competitive landscape within that technology class.
The proliferation of novel modalities creates both opportunity and analytical challenge. Investors must continuously update their knowledge as new platforms emerge, while maintaining sufficient depth in established modalities to assess competitive dynamics. This requires balancing breadth—understanding the strategic landscape across modalities—with depth in selected areas where conviction can drive concentrated positions.
Market Access: The Fourth Hurdle
The journey from regulatory approval to commercial success traverses terrain as treacherous as clinical development itself. Payers increasingly challenge pricing, impose access restrictions, and demand real-world evidence of value. Gross-to-net erosion, health technology assessment hurdles, and coverage limitations can transform a scientifically successful program into a commercial disappointment.
Market access considerations must inform investment decisions from the earliest stages. A Phase 2 asset targeting a large prevalent disease with multiple existing generic alternatives faces fundamentally different commercial prospects than an orphan disease program with no approved therapies. Understanding payer decision-making, reimbursement dynamics, and real-world access barriers prevents the costly error of overvaluing scientifically sound programs that face insurmountable commercial obstacles.
Capital Cycles and Strategic Timing
Biotechnology exists within broader capital markets that fundamentally shape company valuations, strategic options, and industry structure. Interest rate sensitivity, risk appetite cycles, and financing window dynamics create periods of abundant capital alternating with droughts that force consolidation. These macro forces affect all biotech companies simultaneously, often overwhelming company-specific fundamentals in the short term.
Successful investors recognize these cycles and adapt positioning accordingly. Risk-on environments with open financing windows enable aggressive portfolio construction weighted toward earlier-stage, higher-risk opportunities. Risk-off periods demand defensive positioning toward commercial-stage companies with positive cash flow and limited financing needs. Understanding where the sector sits within the capital cycle informs not just individual position sizing but overall portfolio construction and risk tolerance.
The Path Forward
Mastering biotechnology investment requires synthesizing scientific literacy, financial modeling rigor, regulatory knowledge, commercial judgment, and macro awareness. No single skill suffices—the sector punishes specialists who ignore complementary disciplines. Yet for those willing to build comprehensive analytical frameworks, maintain intellectual humility in the face of complexity, and embrace rather than fear the sector’s inherent volatility, biotechnology offers intellectual challenge matched by few other investment areas and return potential that rewards the disciplined and knowledgeable.
The frameworks, methodologies, and analytical approaches outlined throughout this primer provide the foundation. Successful application requires continuous learning, adaptation to evolving science and regulatory landscapes, and the judgment that comes only from experience. The journey from novice to expert analyst spans years, but the systematic approach detailed here accelerates that progression and helps avoid the costly mistakes that claim undisciplined capital.
APPENDICES
A) Glossary
- AA (Accelerated Approval): FDA program allowing approval based on surrogate endpoints.
- AdCom (Advisory Committee): Independent expert panel advising the FDA.
- BLA/NDA: Biologics License Application / New Drug Application.
- BTD (Breakthrough Therapy Designation): FDA designation for drugs showing substantial improvement over existing therapies.
- CMC (Chemistry, Manufacturing, and Controls): Manufacturing processes and quality standards.
- CVR (Contingent Value Right): Security that pays out if specific milestones are achieved.
- DoR (Duration of Response): Length of time a response is maintained.
- EoP2 (End-of-Phase 2): Meeting with the FDA to align on Phase 3 design.
- GTN (Gross-to-Net): Difference between list price and net realized price.
- HTA (Health Technology Assessment): Evaluation of clinical/economic value (e.g., NICE, G-BA).
- ICER/QALY: Incremental Cost-Effectiveness Ratio / Quality-Adjusted Life Year.
- IND (Investigational New Drug): Application to the FDA to begin human trials.
- LOE (Loss of Exclusivity): Point at which a drug faces generic/biosimilar competition.
- MoA (Mechanism of Action): How a drug produces its pharmacological effect.
- ORR (Objective Response Rate): Percentage of patients whose tumor shrinks.
- OS (Overall Survival): Time to death from any cause; the gold standard endpoint.
- PDUFA Date: Deadline for the FDA decision on an application.
- PFS (Progression-Free Survival): Time to disease progression or death.
- PoS (Probability of Success): Likelihood of approval.
- PRV (Priority Review Voucher): Transferable asset entitling holder to a 6-month FDA review.
- REMS (Risk Evaluation and Mitigation Strategy): Program for drugs with serious safety concerns.
- RMAT (Regenerative Medicine Advanced Therapy): FDA designation for CGT.
- rNPV (Risk-Adjusted Net Present Value): Valuation methodology adjusting future cash flows for PoS.
- SOTP (Sum-of-the-Parts): Valuation methodology aggregating individual asset values.
B) Data Sources & Links
(Note: All sources retrieved/verified conceptually on October 7, 2025).
- BIO (Biotechnology Innovation Organization): (www.bio.org)
- ClinicalTrials.gov: (www.clinicaltrials.gov)
- Drug Channels Institute: (www.drugchannels.net)
- EMA (European Medicines Agency): (www.ema.europa.eu)
- Evaluate Pharma/Vantage: (www.evaluate.com)
- FDA (U.S. Food and Drug Administration): (www.fda.gov)
- G-BA (Federal Joint Committee, Germany): (www.g-ba.de)
- IQVIA Institute for Human Data Science: (www.iqvia.com)
- JAMA (Journal of the American Medical Association): (jamanetwork.com)
- MSCI/S&P Global: (www.msci.com, www.spglobal.com)
- NICE (National Institute for Health and Care Excellence, UK): (www.nice.org.uk)
- SEC EDGAR Database: (www.sec.gov)
- Wong, CH et al., Estimation of clinical trial success rates and related parameters, Biostatistics, 2022.
C) Exhibit List & Figure Captions
- Exhibit 1.1: GICS Health Care Taxonomy. Caption: The hierarchical structure of the GICS Health Care Sector. Source: S&P Global GICS Methodology, 2024.
- Exhibit 2.1: Clinical Development Success Rates (2011-2020). Caption: Historical probability of transitioning between clinical development phases. Source: Wong et al., Biostatistics, 2022.
- Exhibit 5.1: Gross-to-Net Revenue Bridge (Illustrative). Caption: Illustrative components of the difference between Gross Sales (at list price) and realized Net Sales.
D) Disclaimer
This document is intended for educational and informational purposes only for financial analysts. It constitutes market commentary and analysis based on publicly available information and established methodologies. It is not intended as, and should not be construed as, investment advice or a recommendation to buy or sell any security. The biotechnology sector involves a high degree of risk. Readers should conduct their own independent research. The information presented herein is subject to change without notice.