Digital Infrastructure
Section 1: Letter to the Financial Investor
The Physicality of the Cloud
For decades, the definition of “Real Assets” was immutable: toll roads, pipelines, and power grids. These assets were prized for their monopolistic positioning, high barriers to entry, and inflation-linked cash flows. Today, we argue that a new asset class has not only joined this rank but superseded it in strategic importance: Digital Infrastructure.
This paper is an investment primer for the allocator who recognizes that the global economy’s dependency on data is now absolute. While the volatility of the technology sector (software and hardware) grabs headlines, the infrastructureunderpinning it—data centers, fiber networks, and towers—has quietly matured into a distinct asset class.
Our analysis, supported by reviewing the operating models of sector leaders like American Tower, Equinix, and Brookfield, suggests we are entering a period of “Industrialization” for the digital economy. The investment thesis rests on five data-backed claims:
1. The “Bridge” Asset Class: Growth + Defensive Yield Digital infrastructure is the rare hybrid that bridges the defensive nature of utilities with the secular growth of tech. This is not a theoretical claim; it is structural.
- Evidence: As detailed in American Tower’s recent filings, the standard Master Lease Agreement (MLA) features non-cancellable terms with fixed annual escalators (typically ~3% in the U.S. or CPI-linked globally).
- Implication: Unlike tech equities, these assets offer embedded, compounding organic growth that is contractually divorced from the business cycle.
2. The Demand Super-Cycle is Durable, Not Cyclical We are witnessing the collision of three cycles: enterprise cloud migration, 5G network densification, and the generative AI revolution.
- Evidence: This durability is best evidenced by Equinix, which has delivered 21 consecutive years of quarterly revenue growth—a streak spanning the Dot-com crash, the Great Financial Crisis, and the COVID-19 pandemic.
- Implication: Demand is not driven by consumer whims but by corporate architecture. As noted in Iron Mountain’s reporting (FY2023), global data center portfolio leasing reached 93%, a utilization level that has remained structurally tight into 2025, indicating a supply-constrained environment where demand outpaces physical build capabilities.
3. The “Megawatt Wall” is the New Moat The era of “easy” digital growth is over. The primary constraint on the sector is no longer fiber or servers, but power availability.
- Evidence: In their recent risk disclosures, operators like Digital Realty increasingly cite utility interconnection delays and grid capacity as material bottlenecks.
- Implication: This scarcity is bullish for incumbents. The value of a data center today is defined by its secured power access. We are seeing a shift where “Power Shells” are valued like prime real estate.
4. Risk Has Shifted from “Obsolescence” to “Execution” Ten years ago, the risk was that technology would change (e.g., satellites replacing towers). Today, the risk is execution.
- Evidence: Brookfield Infrastructure Partners notes that the vast majority of cash flows in its data infrastructure segment are contracted or regulated, with average contract durations typically exceeding 10 years.
- Implication: The risk is no longer “will they come?” but “can we build?” The complexity of permitting and grid connection protects established players from new entrants.
5. Valuation Arbitrage Persists Public markets frequently misprice these assets, toggling between viewing them as volatile tech stocks or sleepy REITs. We believe the market underestimates the operating leverage inherent in these models—where adding a second tenant to a tower or fiber strand incurs virtually zero incremental cost, dropping nearly 100% of that new revenue to the bottom line.
How to Read This Report
- Generalist Allocators (Sections 1–4): Focus here for the macro narrative, the “Megawatt Wall” thesis, and the demand metrics driving the AI revolution.
- Sector Specialists (Sections 5–7): Proceed to the “Engine Room.” These sections dissect the unit economics of specific asset classes, utilizing “Investable Object” definitions to separate the real estate from the technology.
The digital economy is ephemeral; digital infrastructure is concrete. It is heavy, capital-intensive, and difficult to replicate. It is the toll road of the 21st century.
Section 2: What Is “Digital Infrastructure”?
Taxonomy, Scope, and the Investable Object
This section defines the playing field—not by engineering function, but by capital allocation. For the purposes of this report, we define digital infrastructure as the physical assets that deliver compute, storage, and connectivity at scale.
While the ecosystem is complex, the “Investable Universe” is distinct. It is characterized by high initial capital intensity, long-term contracts, and a shift from “technological risk” (will the tech work?) to “execution risk” (can you build it?).
Below, we categorize the sector into three mature “Core” asset classes and one emerging frontier.
2.1 Data Centers: The Digital Factory
Data centers are the physical core of the investment thesis. These are not merely warehouses; they are highly specialized industrial facilities engineered to Tier III/IV standards, delivering ~99.982% (Tier III) to ~99.995% (Tier IV) availability for high-performance servers.
The Investable Object Investors own the Power Shell: the land, the hardened building shell, and the mission-critical electrical and mechanical infrastructure (chillers, generators, UPS systems). Crucially, the investor rarely owns the servers; those are the property of the tenant (OpEx), while the building is the property of the landlord (CapEx).
The Two Distinct Business Models Allocators must distinguish between two sub-sectors often conflated in casual analysis:
- Wholesale / Hyperscale: Large, “industrial” leases (5MW to 100MW+) sold to cloud giants (AWS, Azure, Google).
- Economics: Stabilized Yield on Cost of ~6–8% for core Tier-1 builds (wider in emerging markets). Long leases (10–15 years). “Triple Net” structures where the tenant pays for power. This is a spread business: the value creation comes from the delta between development yield and exit cap rate.
- Retail / Interconnection: Denser ecosystems (e.g., Equinix) where hundreds of networks, banks, and clouds physically plug into each other.
- Economics: ROIC of 10%+ on incremental cabinets. Shorter leases (3–5 years), but significant revenue from “Cross-Connects” (high-margin cabling fees). This is a “Network Effect” business with a wide moat.
The AI Shift: Power Density as the New Governor As noted in recent filings from Digital Realty (DLR) and Vertiv (VRT), AI is forcing a physical redesign.
- The Gap: While the legacy installed base averages ~8–12 kW per rack in most portfolios, new AI training halls are already being specced for 40 kW to 100 kW+ per rack.
- Implication: This breaks traditional air-cooling economics, forcing a shift to liquid cooling and requiring heavy power grid upgrades. Older vintage data centers face obsolescence risk if they cannot support these densities.
| Key Investment Characteristics: Data Centers | |
| Metric | Description |
| Key Constraint | Power Availability. As emphasized by major REITs, “Power is the new absorption” (in constrained metros). |
| Revenue Driver | Contracted backlog (MW) & Rental Rate changes on renewals (Mark-to-Market). |
| Valuation | Primary: P/AFFO or NAV. EV/EBITDA is used as a secondary cross-check but varies widely based on power security. |
| Churn* | Extremely low for Hyperscale (<2%); moderate for Retail (6–8%). |
*Churn figures are stylized market ranges.
2.2 Towers: Vertical Real Estate
Towers are the most mature, “utility-like” asset class in the sector.
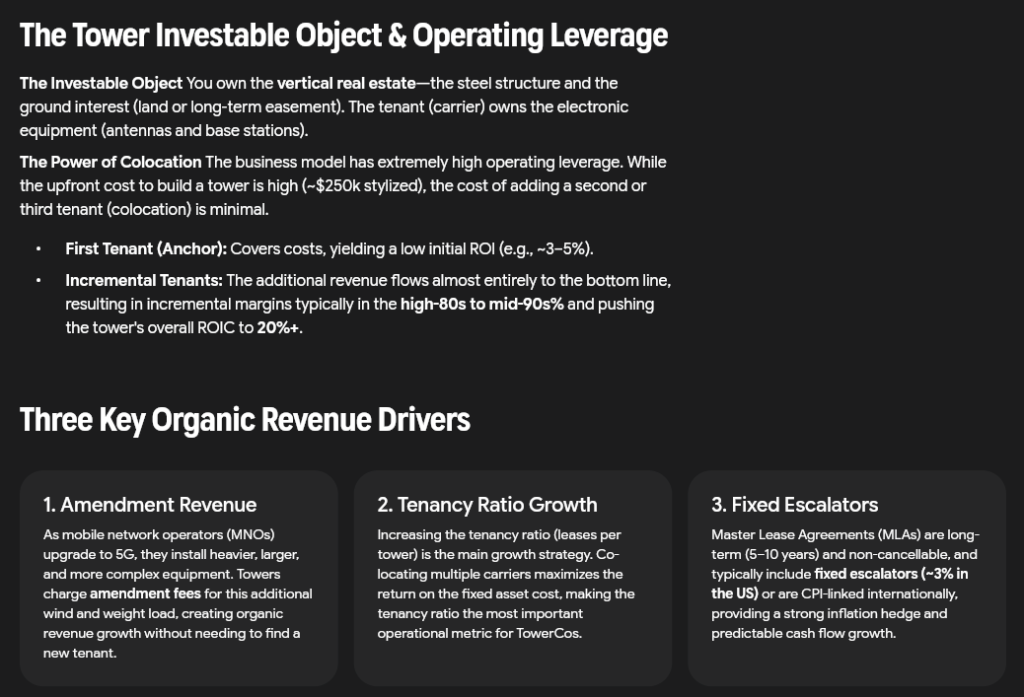
The Investable Object You own a steel vertical structure and a ground interest (either owned land or a long-term easement). The tenant (Verizon, AT&T, Telefonica) owns the antennas, coaxial cables, and base stations.
Revenue Model & The “Colocation” Engine The beauty of the tower model—championed by American Tower (AMT) and SBA Communications (SBAC)—is Operating Leverage.
- The Math (Stylized): Building a tower costs ~$250k. The first tenant generates an ROI of ~3–5%. However, adding a second or third tenant incurs minimal incremental OpEx.
- Result: The incremental margin on a second tenant is typically high-80s to mid-90s%. A three-tenant tower can yield 20%+ ROIC.
- Amendment Revenue: As carriers upgrade to 5G, they add heavier equipment. Towers charge “amendment fees” for this additional wind-load, creating organic growth without new leasing.
| Key Investment Characteristics: Towers | |
| Metric | Description |
| Barriers to Entry | Zoning. NIMBY (“Not In My Backyard”) sentiment makes building new towers in developed markets nearly impossible, protecting incumbents. |
| Contract Structure | Master Lease Agreements (MLAs): 5–10 years non-cancellable with typically ~3% fixed escalators (US) or CPI-linked terms (Int’l). |
| Valuation | EV / Tower Cash Flow (TCF). TCF is the sector-specific proxy for AFFO. |
2.3 Fiber & Subsea: The Circulatory System
Fiber is the glass piping that connects the data centers and towers.
The Investable Object
- Terrestrial: Buried conduits containing fiber optic strands.
- Subsea: Trans-oceanic cables. Note a major structural shift: Historically owned by Telco consortiums, Subsea is now increasingly anchored by Hyperscalers. Google and Meta are now among the largest owners and anchor tenants of new cable capacity globally, seeking to control their own backbones.
Revenue Model: Lit vs. Dark
- Lit Fiber: The operator provides bandwidth (active electronics). Higher margins, but higher churn and equipment capex.
- Dark Fiber (IRU): The operator sells the physical strand via an Indefeasible Right of Use (IRU) for 20 years. The customer lights it. This is a “Infrastructure” pure-play—effectively a real estate lease on glass.
| Key Investment Characteristics: Fiber | |
| Metric | Description |
| Key Constraint | Right of Way (ROW). The cost is not the fiber cable; it is the trenching and permitting. |
| Economics | High fixed cost, low marginal cost. Density matters: “Route Miles” vs. “Strand Miles.” |
| Risk | Overbuild. Unlike towers (zoning) or DCs (power), fiber is easier to overbuild in non-urban areas, leading to price compression. |
2.4 Emerging: The “Edge” and Power-Adjacent
- Edge: Small-form-factor data centers located at the base of cell towers or in secondary cities to reduce latency. Currently high-growth but fragmented.
- Power-Adjacent: As grid queues lengthen (4+ years for large-load interconnections in some US markets), data center operators are investing “behind the meter.” This includes on-site substations, natural gas peaker plants, and battery storage. We increasingly view these power assets as part of the digital infra valuation stack.
Section 3: Why It Matters Now
The Digital Infrastructure Super-Cycle
If digital infrastructure is the factory of the modern economy, we are currently witnessing a re-tooling of the entire industrial base.
The “Why Now” question is answered by the simultaneous collision of three secular cycles. Any one of these would be sufficient to drive a bull market; together, they are creating a capital super-cycle that is decoupling from the broader macroeconomic environment.
- The AI Shock: A step-change in capital intensity and power density.
- The Cloud Maturation: The shift from “adoption” to “reliance.”
- The Energy Transition: The hardening of the physical constraints (the “Megawatt Wall”).
3.1 The AI Shock: From Capex to Concrete
The numbers are staggering, but the intensity is the real story. In 2025, the “Top 5 Hyperscalers” (Microsoft, Amazon, Google, Meta, and Oracle) are projected to deploy approximately $443 billion in combined capital expenditure (CreditSights, Nov 2025). To put this in perspective, this figure exceeds the entire GDP of countries like Finland or Portugal.
However, the “Bubble” counter-argument often misses the financial nuance of where this capital is actually landing. We are not just buying chips; we are capitalizing a new industrial base.
The Financial Anatomy of the Spend: Silicon vs. Concrete For the allocator, it is critical to bifurcate this spend between the P&L and the Balance Sheet.
- The “Kit” (Short-Duration Assets): Approximately 60–65% of this capex is allocated to technical infrastructure—GPUs, servers, and networking switches. These are deflationary assets with short useful lives (3–5 years). On the P&L, this creates a massive near-term depreciation drag that temporarily suppresses EPS.
- The “Shell” (Long-Duration Assets): The remaining 35–40% is flowing into land, power interconnects, and hardened building shells. These are inflationary assets with long useful lives (30+ years).
- The Balance Sheet Implication: While the “Kit” burns off, the “Shells” accumulate. The hyperscalers are effectively converting current cash flow into a massive portfolio of owned real estate and power rights. Even if the AI software cycle slows, the underlying physical assets (the “Power Shells”) retain value due to the grid constraints mentioned later in this report.
Capital Intensity: The Divergence Investors should note a sharp divergence in capital intensity (Capex/Revenue). While the aggregate intensity for the hyperscale sector hovered around 16% in H1 2025, the “AI Leaders” are operating in a different stratosphere. Microsoft and Oracle, who are building the most aggressive training clusters, have reported intensity spikes exceeding 45% and 50% respectively. This signals that for the market leaders, we are in an infrastructure super-cycle where capacity must be built years before revenue is fully realized.
Beyond Chatbots: The “Industrial Utility” Defense A common bearish pushback is that “Chatbots cannot monetize $300 billion of capex.” This view is too narrow. We are witnessing the deployment of AI as a general-purpose technology, akin to the electrification of factories in the 1920s. The capacity is being absorbed by three distinct layers:
- Coding & Productivity (The Opex Saver): Tools like GitHub Copilot are not novelties; they are deflationary forces for corporate IT budgets, with adoption rates in the Fortune 500 exceeding 60%.
- Recommendation Engines (The Revenue Driver): Meta has publicly attributed its 2024/2025 ad-revenue resurgence to AI-driven algorithm updates (e.g., Reels), which require massive inference compute to serve the right video to the right user.
- Simulation & R&D (The New Frontier): DeepMind’s AlphaFold (biology) and industrial “Digital Twins” (manufacturing) consume vast training resources to solve problems that traditional software cannot touch. This is not a consumer fad; it is heavy industrial R&D moving to the data center.
3.2 The “Megawatt Wall”: Scarcity Creates Value
For the last decade, the primary constraint on digital growth was demand: could we sell enough rack space? Today, the primary constraint is supply: can we find enough power?
The industry is hitting what we call the “Megawatt Wall.” The availability of high-voltage power has replaced fiber proximity as the critical determinant of asset value.
- Grid Queues: In top-tier markets, the timeline to energize a new transmission-scale load has extended dramatically. While timelines vary by jurisdiction, interconnection queues in constrained hubs like Northern Virginia (PJM) and Frankfurt can now extend 4 to 6 years.¹
- Density Shock: As noted in recent technical disclosures from Digital Realty and others, legacy data centers were often designed for densities of 4–8 kW per rack. Leading-edge AI deployments (e.g., clusters of NVIDIA Blackwell/H100) increasingly demand 40 kW to 100 kW+ per rack.
- The Result: A bifurcation of the asset class. Old facilities with low power density face obsolescence risk, while new facilities with secured power enjoy a widening pricing moat.
Analyst Insight: The Duration Mismatch The “Megawatt Wall” is structural, not cyclical. It takes roughly 24 months to build a data center shell. It takes 5 to 7 years to permit, procure, and build a high-voltage substation and transmission line. This duration mismatch guarantees that demand will outpace supply in Tier 1 markets for the medium term.
3.3 The Cloud is No Longer “Discretionary”
While AI grabs the headlines, the “base load” of the digital economy—enterprise cloud migration—provides the floor.
During the 2008 financial crisis, enterprise IT was a cost center to be cut. Today, it is the revenue engine. Equinix noted in their 2024 reporting that despite macro headwinds, interconnection bandwidth continues to grow at a 20%+ CAGR. This resilience is driven by a fundamental shift in what the cloud is used for.
The Nature of the Workload: From “Lift-and-Shift” to “Cloud Native” The first wave of cloud migration (2010–2020) was simple storage and virtual machines (“Lift-and-Shift”). The current wave is far stickier. Enterprises are deploying complex Data Platforms (Snowflake, Databricks) and Observability Suites (Datadog, Splunk) that weave deeply into their daily operations.
- The Lock-in: Once a bank builds its fraud detection system on a cloud-native data lake, or a retailer runs its logistics on a SaaS ERP, the cost of switching becomes prohibitive.
- The AI Layer: Crucially, these platforms are the staging grounds for AI. You cannot run a “Copilot” on data that is sitting in a dusty server closet. To adopt AI, companies must first migrate their data to a modern architecture, creating a forced march toward cloud and colocation.
Resilience and the “Sovereign” Shift A quiet but massive driver of demand is the migration of regulated industries (Healthcare, Finance, Government) out of on-premise basements and into high-spec infrastructure.
- The Driver: It is no longer just about cost; it is about Operational Resilience and Digital Sovereignty. New frameworks like the EU’s DORA (Digital Operational Resilience Act) mandate that financial institutions prove they can survive a cyberattack or power outage.
- The Result: Banks are realizing they cannot achieve “Tier IV” resilience in their own headquarters. They are moving critical workloads to third-party colocation facilities that offer “Sovereign Cloud” zones—physically secure cages with dedicated, air-gapped hardware that meets national security standards. This is creating a new class of “Premium Enterprise” demand that is insensitive to price but hyper-sensitive to compliance.
3.4 The Investment Implications: A New Playbook
For the financial investor, this “Super-Cycle” requires a fundamental rewriting of the investment rubric. The days of buying “generic capacity” in Tier 1 markets and waiting for yield compression are over.
1. Location Strategy: The “Latency vs. Power” Trade-Off We are witnessing a geographic decoupling of workloads.
- Training (The Factory): AI model training is insensitive to latency but hypersensitive to power cost. This demand is migrating to “Power-Rich, Connectivity-Poor” regions—think the US Midwest, the Nordics, or Aragon, Spain—where gigawatt-scale interconnects are available at <$0.06/kWh.
- Inference (The Storefront): Once a model is trained, it must serve users in real-time. This “Inference” capacity must remain in power-constrained Tier 1 metros (London, Ashburn, Frankfurt) to minimize latency.
- The Play: Portfolios need exposure to both: the “remote industrial” yield plays and the “urban core” scarce assets.
2. Valuation Bifurcation: The “AI-Ready” Premium The market is beginning to price a structural spread between “AI-Ready” shells and legacy inventory.
- The Premium: Assets with high-density cooling loops (liquid-ready) and secured power of 100 MW+ are trading at compressed cap rates (structurally tighter than historical averages) and higher EV/MW multiples.
- The Discount: Conversely, older enterprise facilities (3–5 kW/rack) are facing a “CapEx Wall” to retrofit for AI. Without significant investment, these risk becoming “Stranded Assets”—functionally obsolete despite being physically sound. We expect the valuation gap between Tier 1 AI assets and legacy Tier 2 assets to widen significantly in 2026.
3. The New Utility: From Tenant to Grid Resource Digital infrastructure is ceasing to be a passive load and becoming an active grid participant.
- The Scale: In constrained markets, data centers are no longer niche; they are the demand. Data centers now consume ~22% of Ireland’s total electricity and ~26% of Northern Virginia’s, effectively making them the anchor tenants of the grid.
- The Revenue Shift: Sophisticated operators are co-optimizing with the grid—selling “frequency response” (batteries) and “demand reduction” (shutting down workloads during peak pricing) back to the utility. In this world, a data center’s ability to navigate power markets becomes as valuable as its ability to lease space.
Section 4: Demand Engine: Data, Cloud, AI & Network Traffic
Quantifying the Digital Appetite
The investment case for digital infrastructure is often reduced to a single word: “Growth.” However, for the analyst, “Growth” is too vague to model. We must decompose demand into its constituent parts to understand which asset classes benefit from which trend.
We view demand as a layer cake. The base is the steady, linear growth of human connectivity (Mobile/Broadband). The middle layer is the compounding migration of corporate IT to the cloud. The top layer—the accelerator—is the exponential shock of Generative AI.
4.1 Data Creation and Traffic: The Base Load
While AI grabs the headlines, the fundamental “Base Load” of the internet—human connectivity—continues to expand at a robust, linear pace. This layer of demand is the bedrock of the investment thesis: it is predictable, insensitive to economic cycles, and geographically distributed.
According to Ericsson, 5G networks now carry approximately 35% of all mobile traffic, a share that continues to climb steadily from the mid-20s just two years prior.
- The Metric: Total global mobile data traffic is projected to reach 280 Exabytes (EB) per month by 2030, a 2.3x increase from 2024 levels.
- The Driver: The “Bitrate Multiplier.” User growth has slowed, but intensity has accelerated. As video streaming shifts from Standard Definition (SD) to High Definition (HD) and 4K, the bandwidth cost of a single session multiplies.
- The Math: An SD stream consumes ~0.7 GB per hour. A 4K stream consumes ~7 GB per hour. As users upgrade devices and plans, they effectively increase the load on the tower ten-fold without increasing the subscriber count.
The “Hidden” Fixed Layer: Wi-Fi and Broadband Offload It is critical to note that mobile traffic is only the visible tip of the iceberg. The majority of smartphone data is offloaded to Wi-Fi networks before it ever reaches a cellular tower.
- The Nuance: While global averages historically hovered around 50–60%, recent data from Opensignal indicates that in mature markets like the U.S., Wi-Fi offload rates can reach nearly 90%.
- The Implication: This massive “offload” volume underpins the thesis for Fiber-to-the-Home (FTTH) and Cable assets. Investors should view Fiber and Mobile not as competitors, but as symbiotic networks where growth in one necessitates capacity in the other.
Connecting Usage to Economics For the infrastructure owner, this sustained traffic growth translates directly into two high-margin revenue streams:
- Tower Amendments: As carriers struggle to handle the “Bitrate Multiplier,” they must add heavier, advanced antennas (Massive MIMO). This triggers “Amendment Revenue”—contractual rent increases paid to the tower company for the additional weight and wind load.
- Fiber Deepening: While rural sites may rely on microwave backhaul, 5G macro sites in dense urban areas increasingly demand 10 Gbps to 100 Gbps fiber backhaul to handle the traffic surge. Traffic growth effectively forces wireless carriers to become larger customers of wireline fiber networks.
4.2 Cloud, SaaS, and Enterprise: The Migration Continues
The “Cloud Cycle” is not over; it has merely entered its industrial phase. In 2025, we are seeing the “Hollow Middle” of the corporate world—regulated industries, mid-sized manufacturing, and government—finally migrate core workloads off-premise.
- Market Sizing: We must distinguish between two key metrics. Gartner forecasts Global Public Cloud Services spending (IaaS/PaaS/SaaS) will reach ~$723 billion in 2025. However, the broader Cloud Computing Market(including private cloud and edge services) is projected by independent research to exceed $1.6 trillion by 2030.
- The Driver: This is no longer about cost arbitrage; it is about capability. Enterprises cannot run modern AI or data analytics stacks on legacy on-premise servers. To access the toolset of the 21st century, they must move their data to where the tools live.
Clarifying “Repatriation”: It’s Not Back to the Basement Headlines often cite “Cloud Repatriation” as a threat to the sector. This is a misunderstanding of the topology. When a CIO “repatriates” a workload, they are rarely moving it back to a dusty server closet in their headquarters.
- The Reality: They are moving from a generic Public Cloud environment (where costs can spiral) to a Private Hybrid Colocation environment.
- The Infrastructure Implication: This volume moves into high-spec Retail Colocation facilities (e.g., Equinix, Digital Realty) that offer direct, private fiber links to the public cloud. The workload leaves AWS, but it moves into a building next door to AWS.
Case Study: The “Hybrid” Bank Architecture To visualize this, consider a typical Global Systemically Important Bank (G-SIB) in 2025:
- The Core Ledger: The bank’s transaction processing engine—which demands extreme security and zero latency—resides in private cages within a Retail Colocation facility.
- The Analytics Layer: The bank uses the Public Cloud (Azure/AWS) for risk modeling, leveraging infinite scalability.
- The Interconnect: The critical piece is the fiber cross-connect linking the private cage to the public cloud “on-ramp” within the same building.
- Value Capture: The Colocation operator captures the high-margin interconnection rent, acting as the “Switzerland” of the internet.
4.3 AI: The Step-Change, Not the Slope
This is the most critical distinction in the report. AI is not just “more cloud.” It is a fundamentally different industrial process that breaks the traditional data center model.
The Capex Shock: From Software to Concrete In 2025, the “Top 5 Hyperscalers” (Microsoft, Amazon, Google, Meta, and Oracle) are projected to deploy approximately $443 billion in combined capital expenditure (CreditSights, Nov 2025). To put this in perspective, this figure exceeds the entire GDP of countries like Finland or Portugal.
Capital Intensity: The Divergence Investors should note a sharp divergence in capital intensity (Capex/Revenue). While the aggregate intensity for the hyperscale sector hovered around 16% in H1 2025, the “AI Leaders” are operating in a different stratosphere. Microsoft and Oracle, who are building the most aggressive training clusters, have reported intensity spikes exceeding 45% and 50% respectively. This signals that for the market leaders, we are in an infrastructure super-cycle where capacity must be built years before revenue is fully realized.

The Density Disconnect & The Cooling Shift The physical requirements of AI are severing links with the past. A standard cloud rack draws 8–10 kW; an AI training rack (e.g., NVIDIA Blackwell/H100) draws 40 kW to 100 kW+.
- The Hybrid Reality: This heat density overwhelms traditional air conditioning, but the transition is not binary. Rather than bypassing air cooling entirely, operators are increasingly adopting hybrid liquid cooling.
- The Adoption Curve: While dedicated AI halls often use Direct-to-Chip (DTC) liquid loops for the GPUs, the surrounding equipment (storage, networking) remains air-cooled. According to the Uptime Institute (2024–2025), roughly 22% of operators have deployed some form of liquid cooling, often as a “hybrid” solution in a minority of racks.
- The Moat: Even this hybrid approach creates a “technical moat.” Older facilities often lack the floor loading, water loops, and power density to support even a partial liquid deployment without prohibitive retrofits.
Capacity Planning: The “Lumpy” vs. The “Recurring”
- Training (The Factory): Hyperscalers sign massive, long-term leases (15+ years) for entire campuses to train a single model. This capacity gravitates toward remote, power-rich regions (e.g., Midwest US, Nordics) where electrons are cheap.
- Inference (The Application): Once a model is live, it must answer user queries in real-time. This capacity gravitates toward urban, Tier-1 markets (e.g., Ashburn, London, Tokyo) to minimize latency.
The Analyst’s Envelope: Calculating the Physical Reality To understand why the “Megawatt Wall” is real, consider the math of a single AI training cluster:
- The Kit: A standard training run might utilize 40,000 GPUs.
- The Load: At ~700W per GPU, the chips alone draw 28 MW.
- The Overhead: Add networking switches, storage, and cooling (PUE of ~1.3), and the total facility load rises to 36–42 MW.
- The Implication: A single tenant requirement now consumes the entire capacity of a traditional wholesale data center building.
4.4 Other Demand Layers: The Reinforcing Loop
While AI and Cloud provide the explosive growth, the “Other” category acts as the mortar in the wall. These trends—IoT and Fixed Wireless Access (FWA)—are less capital-intensive but serve a critical function: they fill the spare capacity of existing assets, driving Return on Invested Capital (ROIC) through higher utilization.
1. The Industrial Internet of Things (IoT): Stickiness over Volume After a decade of “next big thing” promises, the IoT market is stabilizing around realistic growth curves. The rollout of 5G RedCap (Reduced Capability) in 2025 is finally lowering the cost barrier for industrial sensors.
- The Metric: Current forecasts project cellular IoT connections will reach ~7 billion by 2030 (Ericsson).
- The Infrastructure Manifestation: For the tower owner, IoT is not a play on data volume (a water meter sends very few bytes); it is a play on tenancy stickiness. An industrial park with 50,000 connected sensors creates a high switching cost for the tenant, reducing churn.
Investor Caveat: While the connection numbers are large, the ARPU is tiny. Allocators should view IoT as a high-margin “topping” that improves tower yields, not a standalone thesis that justifies new builds.
2. Fixed Wireless Access (FWA): The “Fiber Alternative” FWA (using 5G signals to power home Wi-Fi) has emerged as a viable broadband alternative in rural and sub-urban markets where laying fiber is cost-prohibitive.
- The Metric: In the Asia-Pacific region alone, FWA subscriptions are projected to grow at a ~13.7% CAGR through 2030 (GlobalData).
- The Infrastructure Manifestation: FWA transforms a mobile tower from a “roaming” asset into a “residential” asset. It drives baseload utilization at night (when mobile usage drops, home streaming rises), effectively monetizing the tower 24/7.
Investor Caveat: We caution against the “Fiber Killer” narrative. In dense urban centers, wireless physics eventually win: spectrum is finite. Once a tower sector is saturated with FWA users, speeds drop. Therefore, FWA is a dominant solution for the suburban fringe, but deep fiber remains the only scalable solution for the urban core.
Section 5: The Supply Stack: Asset-Class Deep Dives
This is the core of the report. Having established the demand (Section 4), we now examine the supply. For the investor, the goal is not merely to inventory the hardware, but to identify where the economic rents accrue.
We organize the stack by asset class, moving from the “Digital Factories” (Data Centers) to the “Digital Arteries” (Fiber/Towers) and finally the “Digital Power Plant.”
5.1 Data Centers: The Digital Factory
Data centers are no longer homogeneous. The market has bifurcated into two distinct business models with vastly different risk/return profiles.
The Two Business Models
- The Hyperscale “Bond” (Wholesale):
- The Model: A developer builds a massive “Power Shell” (50–100 MW+) and leases it to a single tenant (e.g., Microsoft, AWS) on a triple-net basis.
- The Contract: Leases have lengthened significantly. In the current cycle, “AI-vintage” leases are typically 12–15 years, providing long-duration cash flow visibility.
- The Economics: This is a development spread business. Developers target an indicative Yield on Cost (YoC) of 9–11%, seeking to exit or recapitalize at stabilized Cap Rates in the mid-6% range (depending on market core-status). The value creation is in the entitlement and construction, not the operations.
- The Interconnection “Marketplace” (Retail/Colo):
- The Model: An operator (e.g., Equinix, Digital Realty) leases small cages to hundreds of enterprises, banks, and networks in a dense urban facility.
- The Economics: Returns are driven by ecosystem density. Cross-connects (fiber cables between tenants) generate high-margin recurring revenue, driving ROICs into the 12–15% range. The key metric here is the “Attach Rate”—how many cross-connects are sold per cabinet.
The Underwriting Lens: What Are You Buying?
- In Wholesale, you are underwriting Execution Risk: Can the developer secure the power, manage the supply chain, and deliver the shell on time?
- In Retail, you are underwriting Network Effects: Is the ecosystem sticky enough to prevent churn? A bank cannot leave a data center if all its trading partners are physically located there.
The Unit Economics of a Modern Build The inflation of 2022–2024 has reset the baseline. A Tier 1 market build (Northern Virginia or Frankfurt) now costs $12–$15 million per MW, though this varies significantly by land basis and redundancy spec. “AI-Ready” facilities with liquid cooling loops are pushing this toward $18–$20 million per MW.
Geography: The Tier Split We classify markets based on three criteria: Power Availability, Interconnection Depth, and Queue Length.
- Tier 1 (The Constrained Hubs): Northern Virginia, FLAP-D (Frankfurt, London, Amsterdam, Paris, Dublin), Tokyo.
- Status: Vacancy rates are effectively zero (<2% according to CBRE). Pricing power is absolute due to grid constraints.
- Tier 2 (The Power Valves): Columbus (Ohio), Querétaro (Mexico), Milan (Italy), Johor (Malaysia).
- Status: The fastest growing segment for AI training. These markets offer what Tier 1 cannot: available 300MW+ transmission connections.
Market Vignette: The Tale of Two Cities
- Northern Virginia (Tier 1): The world’s largest market. Vacancy is <1%. New supply is constrained by transmission bottlenecks. Rental rates are rising (Mark-to-Market).
- Columbus, Ohio (Tier 2): A rapid-growth market. Vacancy is higher as massive supply comes online to serve AI training clusters. Here, the bet is on absorption—that the power needs of AI will fill these shells as fast as they are built.
5.2 Towers and Small Cells: The Vertical Utility
Towers remain the most “utility-like” asset in the stack: stable, predictable, and protected by physics.
The Tower Model: The Power of “Flow-Through” The core investment thesis for towers is Operating Leverage.
- The Math: Building a tower costs ~$250,000–$300,000. The first tenant typically covers the cost of capital (ROI ~3–5%).
- The Magic: Adding a second tenant (“Colocation”) incurs virtually zero incremental OpEx. Consequently, 80–90%+ of the revenue from the second tenant flows directly to EBITDA. A tower with 2.5 tenants can generate an ROI of 20%+.
Regional Nuances: 2025 Snapshot
- United States: A mature market (Tenancy >2.5x). Growth is driven by Amendments—carriers adding heavier 5G Massive MIMO antennas to handle the “Bitrate Multiplier” described in Section 4.
- Europe: Consolidating. Independent TowerCos (e.g., Cellnex, Vantage) are rolling up carrier-owned portfolios, driving tenancy from historical lows toward 1.5x–1.8x.
- Emerging Markets: A volume play. In markets like Africa and LatAm, tenancy is climbing toward ~2.0x as carriers prioritize coverage expansion over owning physical assets.
Small Cells and “Shadow Demand” While macro towers handle the base coverage, 5G densification is driving a secondary market for Small Cells and Indoor DAS (Distributed Antenna Systems). These assets serve high-traffic zones (stadiums, airports, city centers). While the capex model often sits with carriers, neutral-host infrastructure is emerging to capture the “Video Densification” demand that macro towers cannot reach.
5.3 Fiber and Subsea: The Circulatory System
If data centers are the heart, fiber is the veins. However, not all fiber is created equal. We must distinguish between “Beachfront Real Estate” and “Commodity Routes.”
The Rent Capture Hierarchy
- Metro / Last Mile: Connecting buildings. This possesses quasi-monopolistic traits. Once a building is connected with a lateral, the incumbent has a massive advantage.
- Long-Haul: Connecting cities. Returns depend on Route Scarcity. A unique, low-latency route through difficult terrain commands a premium; a route along a flat highway with five competitors becomes a commodity.
- Subsea: Connecting continents. The market has shifted from “Consortium” to “Hyperscale.”
Subsea: The Hyperscale Takeover Historically, subsea cables were owned by consortiums of dozens of Telecom carriers. Today, the “Hyperscale Four” (Microsoft, Google, Meta, Amazon) account for the majority of used international capacity and are increasingly the sole owners or anchor tenants of new systems.
- The Implication: This de-risks the asset class. New cables are often built with 50%+ of capacity pre-sold to an investment-grade tenant (e.g., Google) before the ship leaves port.
- Case Example: Google’s Umoja (2024/25). This fiber route connects Africa directly to Australia. By anchoring this build, Google bypasses traditional telecom bottlenecks, treating the ocean floor as an internal patch cable for its cloud region redundancy.
5.4 Edge, Regional, and Emerging Formats
This segment is rapidly maturing but remains distinct from “Core” infrastructure.
- The Edge Data Center: Smaller facilities (2–5 MW) located in Tier-3 cities or at tower bases, designed to serve Content Delivery Networks (CDNs) and low-latency AI inference.
- Sovereign Cloud: A rising geopolitical asset class. Nations are demanding data stay within borders, creating a niche for “National Champion” facilities that are physically air-gapped and command premium rents from government tenants.
The “Institutionalization” Test When does “Edge” become “Core”? We apply a three-part test for investability:
- Multi-Tenancy: Is there demand beyond a single anchor?
- Contract Duration: Are leases >7 years?
- Repeatability: Can the unit economics be replicated across 50 sites, or is each build a “snowflake”? Until an edge platform meets all three, it remains a Venture/Growth equity play, not an Infrastructure play.
5.5 Digital Infra–Adjacent Power Assets: The New Frontier
As the “Megawatt Wall” hardens, the definition of “Digital Infra” is expanding down the stack into the power grid.
The “Behind-the-Meter” Opportunity Investors are increasingly capitalizing assets that sit between the grid and the data center. This includes on-site substations, natural gas peakers, and battery storage.
- The Anchor Deal: The 20-year Power Purchase Agreement (PPA) between Microsoft and Constellation Energy to restart the Three Mile Island nuclear reactor (835 MW) serves as the defining case study. It validates the thesis that hyperscalers will pay a premium for baseload, carbon-free power that bypasses the public grid.
Underwriting the Power Shift This shift changes the risk/return profile.
- Old World: The utility takes the risk; the data center pays a tariff.
- New World: The data center developer takes the Power Risk (fuel pricing, generation uptime) but captures the upside of speed-to-market. Returns on these “Power-Plus” projects often exceed traditional data center returns due to the complexity premium.
Section 6: Power, Energy, and Physical Constraints
The “Megawatt Wall”
For twenty years, the location of a data center was dictated by latency: how close could you get to the fiber exchange in Ashburn, Slough, or Tokyo?
Today, the hierarchy of needs has inverted. The scarcity of high-voltage power has erected a “Megawatt Wall” around the digital economy. In 2025, the availability of a grid connection is the single most significant determinant of asset value, time-to-market, and rent growth.
We have entered an era where digital infrastructure projects effectively become power infrastructure projects with a server hall attached.
6.1 Quantifying the Load: The Grid Shock
To understand the scale of the challenge, we must look at the load profile relative to national grids.
Global Context: The Demand Surge While the U.S. leads in absolute volume, the trend is universal. Goldman Sachsprojects that global data center power demand will grow by roughly 160% by 2030 (vs. 2023 levels). This demand shock is colliding with a grid infrastructure that, in most developed nations, has seen minimal investment in new baseload capacity for two decades.
Regional Nuance: Three Distinct Markets
- North America (Scale): The challenge is pure volume. The U.S. market alone is projected to reach >35 GW by 2030. Utilities like Dominion (Virginia) and AEP (Ohio) are seeing load growth accelerate from <1% annually to 5%+, effectively forcing them to rewrite their Integrated Resource Plans (IRPs).
- Europe (Constraint): The challenge is regulatory. FLAP-D markets are constrained not just by physics, but by policy. Strict environmental permitting (e.g., Germany’s Energy Efficiency Act) and land-use restrictions make greenfield development exceptionally difficult, pushing demand to secondary markets like Madrid, Milan, and Oslo.
- Middle East (Strategy): The challenge is opportunity. Markets like the UAE and Saudi Arabia are leveraging their energy abundance to position themselves as “AI Training Hubs.” Here, power is not a constraint but a strategic asset used to lure hyperscalers.
The Investor Implication: In Tier 1 markets, the grid is no longer an infinite resource. It is a capped allocation system. A data center with a secured “Ramp Schedule” (contracted power delivery) serves as a golden ticket, commanding significant valuation premiums over sites that are merely “zoned.”
6.2 The Bottlenecks: It’s Not Just Generation
Investors often assume the problem is a lack of power plants (“Generation”). In reality, the more acute bottleneck is Transmission and Equipment (T&D).
- Interconnection Queues: Even if power is generated, it cannot reach the site. The queue to connect new load to the PJM grid (US Mid-Atlantic) or the EirGrid (Ireland) has lengthened to 4–7 years.
- The “Transformer Crisis”: The supply chain for high-voltage transformers remains broken. Lead times for Large Power Transformers (LPTs) have stretched from historical norms of 30 weeks to 100–120 weeks.
- Permitting & Opposition: “NIMBY” (Not In My Back Yard) opposition to overhead pylons is delaying critical grid upgrades.
The Playbook: Three Bottlenecks, Three Mitigations For the allocator, the key is to identify operators who have solved these problems structurally:
- Solving Queues: Look for Co-location Strategies. Operators building directly adjacent to power plants (behind the meter) bypass the transmission queue entirely.
- Solving Transformers: Look for Supply Chain Indexing. Major platforms (e.g., Blackstone’s QTS, Digital Realty) use their balance sheet to pre-order transformers 24 months in advance, creating a “strategic inventory” that smaller developers cannot match.
- Solving Permitting: Look for Brownfield Reuse. Converting retired coal plants or heavy industrial sites into data centers leverages existing, permitted grid connections, shaving years off the timeline.
6.3 Thermodynamics: The Cooling Transition
The “Megawatt Wall” also exists inside the building. As AI chips push densities toward 40–100 kW per rack, the financial profile of the mechanical systems changes.
The Architecture Shift
- Legacy Air Cooling: Effective up to ~15–20 kW. Low cost, but inefficient at scale.
- Liquid-to-Chip (The Transition): Cold plates sit directly on the chip. Essential for AI training.
- Immersion: Niche, high-density applications.
The Financial Consequences of Cooling For the investor, the shift to liquid cooling is not just an engineering detail; it alters the return profile:
- Higher Upfront Capex: Liquid systems require complex piping and Coolant Distribution Units (CDUs), increasing mechanical capex by 15–20%.
- Lower OpEx (PUE): Liquid is far more efficient than air fans. This lowers the PUE (Power Usage Effectiveness), creating “headroom” to sell more IT power within the same utility feed.
- Premium Rent: Operators can charge higher reservation rates for liquid-ready halls due to scarcity.
- Faster Refresh: Mechanical loops may have shorter useful lives than simple air handlers, potentially accelerating the maintenance capex cycle.
The “Swiss Cheese” Risk The danger for legacy assets is the “Swiss Cheese” effect. If you put 50kW AI racks into a legacy air-cooled data center designed for 5kW, you will exhaust the cooling capacity long before you fill the floor space. You end up with a mostly empty building (full of holes) that is fully energized—a disaster for Return on Invested Capital (ROIC).
6.4 The Convergence: Power Procurement Strategies
Recognizing that the grid cannot keep up, operators are becoming energy developers. We identify four distinct strategies currently deployable:
- Utility PPA + Dedicated Substation (The Standard): The operator funds a dedicated substation ($50M–$100M) to connect to the transmission grid. Risk: Dependent on utility execution and queue position.
- Behind-the-Meter Generation (The Bridge): Installing gas peaker plants or massive Battery Energy Storage Systems (BESS) on-site. Benefit: Guarantees uptime and enables “peak shaving” revenue; bypasses some queue delays.
- Source Co-location (The Rural Play): Building the data center physically next to a wind farm or solar field. Benefit: Access to green electrons; often lower land basis. Constraint: Usually remote locations unsuitable for latency-sensitive workloads.
- Nuclear / SMR Option (The Frontier): Co-locating with existing nuclear plants (e.g., Talen/Amazon, Constellation/Microsoft) or investing in Small Modular Reactors (SMRs). Benefit: Massive, carbon-free baseload. Risk: Regulatory hurdles and long lead times.
6.5 The Key Investor Question: Who Controls the Value?
In this new paradigm, the hierarchy of scarcity has shifted. The New Hierarchy (2025–2035):
- Energized Power (The most scarce)
- Permittable Land
- Fiber (Commoditized / easiest to solve)
The Allocator’s Guide Different capital pools should target different layers of this hierarchy:
- Core Infrastructure Funds: Prioritize platforms with Secured Ramps. The premium paid for a site with a signed interconnection agreement is justified by the removal of binary queue risk.
- Value-Add / Opportunistic: Hunt for Legacy Retrofits. There is alpha in acquiring older industrial sites or “stranded” data centers and upgrading the power/cooling infrastructure to AI standards.
- Credit / Private Debt: Finance the “Hard Assets.” Substations, transformers, and on-site generation plants are long-life, collateral-heavy assets that are increasingly separable from the data center OpCo, offering attractive risk-adjusted yields.
Section 7: Economics, Returns, and Valuation
Converting Physics into Cash Flows
If “Power” is the physical constraint (Section 6), then “Return on Invested Capital” (ROIC) is the financial arbiter.
Digital infrastructure assets are uniquely prized because they combine the defensive characteristics of real estate(long-term contracts, inflation linkage) with the operating leverage of software (zero marginal cost to add a second tenant to a tower). However, broadly applying generic EBITDA multiples leads to pricing errors. To value these assets correctly, investors must dissect the specific unit economics and risk milestones of each vertical.
7.1 The Cash Flow Lifecycle: The “J-Curve”
For development strategies (Greenfield), the return profile follows a classic “J-Curve.” Understanding this timeline is critical for fund allocators matching liability streams.
- The Investment Phase (Years 0–2): Negative cash flow. Capital is deployed into land, permitting, and the “Power Shell.” Risk is highest here (execution risk).
- The Lease-Up / Ramp (Years 2–3): The asset is energized. Tenants begin installing servers. Revenue recognition is often staggered as power is delivered in blocks (e.g., 10 MW per quarter).
- Stabilization (Year 4+): The asset reaches >90% utilization. Cash flows become bond-like.
- The Value Creation Event: For private equity, the alpha is generated by the Development Spread—the difference between the Yield-on-Cost (building it) and the Market Cap Rate (selling it).
Development Spread=YieldDevelopment−Cap RateExit
Rule of Thumb: In the constrained Tier-1/Tier-2 markets of late 2025, a healthy development spread for Hyperscale Data Centers is 250–350 basis points. (e.g., Build to a 10% yield, sell at a 6.5% Cap Rate). Note: This is indicative of current market conditions; if the spread compresses below 150bps, the construction risk typically outweighs the reward.
The Power Milestone: Redefining “Risk” In previous cycles, the primary risk was construction delay. In the “Megawatt Wall” era, the J-Curve is dictated by the Utility Ramp.
- The Valuation Step-Up: The most significant jump in asset value occurs not when the building is finished, but when the substation is energized. An empty shell with live power is liquid; a finished building waiting for a transformer is a liability. Underwriting models must explicitly stress-test the “Energization Date” vs. the “Lease Commencement Date.”
7.2 Unit Economics: The Supply Stack Compared
Not all revenue dollars are equal. Below, we compare the margin profiles, capital intensity, and bottleneck dynamics of the core verticals.
| Metric | Hyperscale DC | Retail Colocation | Macro Towers | Dark Fiber |
| Revenue Model | Triple-Net Lease (Rent + Power Pass-through) | Gross Rent + Interconnection Fees | Master Lease (Space on Tower) | IRU (20-yr Lease) or Monthly Recurring |
| EBITDA Margin | 60–70% (Pass-through structure & utility volatility limits optical margin) | 45–55% (Higher OpEx for staff/services) | 65–85%(Highest; minimal OpEx) | 50–70% (High incremental margin) |
| Capital Intensity | $12–20M per MW (Varies by AI spec) | Similar per MW + Higher Fit-out | ~$0.25–0.30Mper tower | High upfront trenching; Low incremental |
| Incremental Margin | Moderate (Power is passed through) | High (Cross-connect attach) | Very High (Co-tenancy ~95%) | High (Once route is built) |
| Primary Bottleneck | Energized MW | Ecosystem Density | Zoning / Tenancy | Rights-of-Way (ROW) |
| Underwriting Focus | Spread + Ramp Certainty | Churn + Attach Rate | Tenancy Trajectory | Scarcity vs. Overbuild |
7.3 Valuation Methodologies
Public markets (REITs) and Private markets (Infra Funds) speak different dialects.
1. Data Centers: AFFO vs. EBITDA
- The Trap: Using EV/EBITDA for data centers can be misleading. It ignores the massive capital required to maintain the facility (Maintenance Capex).
- The Solution: The gold standard is AFFO (Adjusted Funds From Operations).
AFFO=EBITDA−Interest−Tax−Maintenance Capex- Current Trading Range (Late 2025): High-quality Hyperscale REITs (e.g., Digital Realty, Equinix) typically trade at 20x–25x AFFO.
2. Towers: The Multiplier of Cash Flow
- Because towers have negligible maintenance capex, EBITDA is a remarkably accurate proxy for cash flow.
- Metric: Tower Cash Flow (TCF) multiples.
- Current Trading Range: Mature markets (US/EU) trade at 18x–22x TCF, reflecting the utility-like stability. Emerging markets trade wider (10x–14x) due to FX/Country risk.
3. The “AI Metric”: EV per Megawatt In the AI era, traditional multiples often fail to capture the value of unusedpower capacity. Investors increasingly value data centers on an Enterprise Value per Megawatt (EV/MW) basis.
- Legacy Shells: High-single-digit millions per MW.
- AI-Ready (Liquid + Power Secured): High-teens to Mid-20s ($M) per MW.
- Why: This metric treats the data center as a commodity inventory of power. If you own 100 MW of secured power in Northern Virginia, the replacement cost is effectively infinite due to the queue, setting a high valuation floor.
The Valuation Dialect: The Falsifiable Metric To separate signal from noise, allocators should focus on the specific metric that “breaks” the thesis for each asset:
- Wholesale DC: Yield on Cost. If construction costs rise and rent is flat, the spread vanishes.
- Retail Colo: ROIC per Cabinet. Are you getting paid for the ecosystem (cross-connects), or just the real estate?
- Towers: TCF per Tenant-Add. Does the second tenant actually drop 90% to the bottom line, or are ground lease escalators eating the margin?
- Fiber: EBITDA per Route Mile. High revenue per mile indicates scarcity; low revenue per mile indicates overbuild.
7.4 Valuation Bifurcation: The “Haves” and “Have-Nots”
A structural valuation gap is widening in 2025, driven by the “Megawatt Wall” physics described in Section 6.
- The AI Premium (The “Haves”): Assets with high-density cooling (liquid-ready) and energized substations command aggressive cap rates. This is not hype; it is logic. The Replacement Cost of these assets includes the “Time Value” of a 5-year power queue. Tenants are paying for speed.
- The Legacy Discount (The “Have-Nots”): Older enterprise facilities (low density, air-cooled) are seeing valuations soften. The Retrofit Cost to bring these facilities up to AI standards (reinforcing floors, running water loops) effectively caps their value.
- Investor Note: Investors should assume these assets trade on current yield, with minimal terminal growth unless a retrofit path is clearly economic.
7.5 Stylized Case Studies
To visualize returns, we look at three simplified return trees. (Note: Figures are illustrative of late-2025 underwriting).
Case Study A: The Hyperscale Developer (Value-Add Strategy)
- Strategy: Buy land in Phoenix, secure 50 MW, build shell, lease to Amazon.
- Entry: Land + Power + Build = $12M per MW.
- Lease: Signed at $120/kW/month.
- Stabilized Yield: ~10% Yield on Cost.
- Exit: Sell to a Core Pension Fund at a 6% Cap Rate.
- Result: ~1.6x MOIC and 25% IRR over 3 years.
- Sensitivity: IRR sensitivity is dominated by energization slippage and exit cap-rate drift.
Case Study B: The Tower Aggregator (Core-Plus Strategy)
- Strategy: Buy a portfolio of 1,000 towers in Europe with 1.2x tenancy.
- Entry: Buy at 20x EBITDA.
- Ops: Aggressively market to a second carrier. Increase tenancy to 1.5x.
- Flow-Through: The revenue from new tenants has 90% incremental margin. EBITDA grows 40% organically.
- Exit: Refinance or hold. Even if the multiple compresses to 18x, growth drives value.
- Result: 12–15% IRR with low volatility.
Case Study C: The “Power-Plus” Developer (Opportunistic Strategy)
- Strategy: Acquire a retired industrial site with an existing 300MW grid connection. Install on-site substation and BESS (Battery Energy Storage).
- Entry: High upfront capex for power assets (Strategy 6.4).
- Lease: Pre-leases entire campus to an AI Lab at a 20% premium to market rent due to “Immediate Power Availability.”
- Economics: The “Power Premium” accelerates the J-Curve. Lease-up happens at Year 1.5 (vs. Year 3).
- Result: 30%+ IRR. The alpha comes from solving the utility bottleneck, not the real estate bottleneck.
- Sensitivity: IRR is highly sensitive to the cost of power assets and the durability of the rent premium.
Section 8: Risks, Externalities, and Policy
Where the Thesis Breaks
A serious primer demands a sober examination of the risks. While the demand signals (Section 4) are exponential, the risks facing digital infrastructure in 2025 are no longer just “technological.” They are geopolitical, environmental, and financial.
This chapter is not a boilerplate disclaimer; it is a catalog of the “falsification points” for the thesis. We organize the risk profile into three categories: The Regulatory Vice (License to Operate), The Monopsony Trap (Tenant Concentration), and The Capital Cycle (Overbuild).
8.1 The Regulatory Vice: Shrinking “License to Operate”
The era of the data center as a “quiet neighbor” is over. In 2025, we are witnessing a global backlash against the sector’s resource consumption, creating a “Regulatory Vice” that tightens supply but complicates development.
1. The Zoning & Noise Friction The conflict has moved from “Abstract Carbon” to “Local Nuisance.”
- The Zoning Shift: Loudoun County, Virginia—the world’s largest market—fundamentally altered its landscape with the March 18, 2025 Zoning Ordinance Amendment (ZOAM). This amendment reclassified data centers as a “Special Exception” use in the Industrial Park (IP), General Industry (GI), and Mineral Resource–Heavy Industry (MR-HI) districts. Crucially, “by-right” applications under review as of February 12, 2025 were only grandfathered if located >500 feet from residential areas.
- The Noise Backlash: In Northern Virginia, communities are increasingly litigating over low-frequency noise from cooling fans and backup generators, forcing operators to retrofit costly sound barriers.
- Implication: A site that is “zoned” but lacks community support is a distressed asset in waiting.
2. The “Generator Cap” (Carbon Regulation) Institutional investors often overlook the fourth-order risk: Backup Power Regulation. As data centers expand, they become massive diesel repositories. Regulators are moving toward tighter runtime limits and emissions standards under frameworks like California’s AQMD Rule 1470 and the EU Industrial Emissions Directive. If a facility cannot permit its backup power due to local air quality mandates, its “usable IT load” is effectively capped.
3. Data Sovereignty: The Compliance Wall Governments are viewing data centers as strategic national assets—or vulnerabilities.
- EU Data Act: This legislation introduces strict cloud switching rules and safeguards against non-EU public sector access. While the Act is currently in force, key obligations regarding cloud switching charges and interoperability phase in through January 12, 2027, creating a complex compliance ramp for operators.
- DORA (Digital Operational Resilience Act): Now fully active, DORA mandates rigorous oversight of critical ICT providers. In November 2025, EU regulators officially designated AWS, Google Cloud, and Microsoft as “critical ICT third-party providers,” subjecting them to direct regulatory supervision. This designation is accelerating the migration of European banking workloads toward “Sovereign” infrastructure to ensure legally robust exit plans.
8.2 The Monopsony Trap: Tenant Concentration
The single greatest financial risk to the sector is the concentration of the customer base.
The “Hyperscale Four” Problem While exact global figures vary, broker data indicates that the top hyperscalers (Amazon, Microsoft, Google, Meta) now drive the majority of net absorption in top-tier metros.¹
- The Lease Evolution: We have moved from a seller’s market to a buyer’s market in terms of terms. New leases increasingly feature strict performance and efficiency clauses—such as PUE/WUE caps or mandatory liquid-readiness specs—that push operational risk back onto the landlord.
- The “Company Town” Risk: As AI training moves to rural areas, the data center becomes a “Company Town.” Asset risk is inversely proportional to interconnection density. A metro colocation facility has a deep bench of backup tenants; a rural gigawatt campus has zero.
8.3 The “E” and “S” in ESG: The Water Sleeper
While Carbon (Energy) is priced into models, Water is the unpriced externality that is currently constraining projects.
The Water Conflict AI training is thirsty. A single gigawatt campus can consume water equivalent to a city of 50,000 people.
- The Flashpoint: In 2025, water stress collided with digital growth in Aragon, Spain. Amazon’s expansion faced intense public scrutiny regarding the 755,000+ cubic meters of authorized water use,² leading to protests under the slogan “Your cloud is drying my river.”
- The Policy Response: Governments across the EU are moving from “voluntary reporting” to regional and national mandatory disclosure.
- Risk: This creates a material permitting constraint. Facilities relying on “Evaporative Cooling” in drought-prone regions face the risk of having withdrawal permits curtailed during stress events.
8.4 Technological Obsolescence: The “Stranded Asset”
Infrastructure lasts 30 years. Tech cycles last 4 years. This mismatch creates obsolescence risk.
The Structural Ceiling As detailed in Section 6, the shift to AI densities (>50kW/rack) breaks legacy shells.
- Beyond Cooling: It is not just about piping water. Many legacy facilities hit a Structural Ceiling. They lack the floor loading capacity to support heavy coolant distribution units (CDUs) or the Electrical Busway capacity to deliver amperage to the rack.
- The Trap: An investor buying a “Value-Add” portfolio may find that the retrofit cost exceeds the cost of a greenfield build.
8.5 Financial Risk: The Capital Cycle
Finally, we must address the macro-financial risks where “Overbuild” is real.
The Fiber Consolidation (“The AltNet Winter”) While data centers are supply-constrained, Fiber is demand-constrained.
- The Overbuild: In the UK and Germany, cheap capital (2019–2021) funded dozens of “AltNets” to overbuild the incumbent.
- The Crash: In 2025, with interest rates normalized, the math has broken. We are seeing a wave of insolvency and consolidation (e.g., the FullFibre / Zzoomm merger activity).
- Investment Implication: The equity value of the “third fiber cable” on a street is effectively zero.
The Refinancing Wall Much of the digital infrastructure built between 2019–2021 was financed with cheap debt. As maturities hit in 2026–2027, Legacy Enterprise Data Centers are most at risk. This is especially acute where Yield-on-Cost spreads are thin and density ceilings limit mark-to-market rent growth, potentially causing DSCR breaches that force equity injections.
Summary: The Risk Matrix
| Risk Vector | Probability | Impact | Mitigation Strategy |
| Power Availability | Certain (100%) | Critical | Underwrite Ramp Certainty and T&D procurement. |
| Regulatory Moratorium | High (Tier 1) | Severe | Diversify into Tier 2 “Power Valve” markets. |
| Water Scarcity | Medium/High | High | Mandate closed-loop cooling (Zero Water) designs. |
| Tenant Concentration | High | Moderate | Underwrite Tenant Credit and relocation logic. |
| Fiber Overbuild | High (Europe) | High | Stick to “First-Mover” or “Duopoly” markets only. |
¹ Source: Synergy Research / Major Brokerage Reports (2025). ² Source: Confederación Hidrográfica del Ebro (CHE) / Regional Reporting.
Section 9: 2030–2035 Scenarios & Investor Playbook
Preparing for the Next Decade
We conclude this primer not with a prediction, but with a framework. As of late 2025, the sector is priced closer to Scenario A than the alternatives. However, the prudent allocator must stress-test their portfolio against divergent futures.
Below, we outline three internally coherent scenarios for the 2030–2035 period and the specific asset exposures that capture the marginal rent in each.
9.1 Scenario A: The Power Rationing Regime (“The Hardening”)
- The Narrative: The “Megawatt Wall” hardens into a permanent constraint. Utility transmission upgrades fail to keep pace with AI demand (growing >20% annually). Governments prioritize residential power stability over data centers, enforcing strict moratoriums in Tier 1 markets.
- Market Dynamics:
- Demand: Relentless. AI training models continue to scale exponentially.
- Power: Becomes the ultimate currency. “Energized Capacity” trades at massive premiums.
- Regulation: Adversarial. Permitting for new greenfield sites effectively stops in the US and EU.
- The Marginal Winner:The Incumbent Power-Holder.
- Why: If you cannot build new supply, existing supply enjoys infinite pricing power. Rent growth explodes for those with live substations.
- Key Metric: EV/MW and Renewal Spreads.
- The Marginal Loser:The Speculative Developer.
- Why: Developers holding land without power see their basis wiped out as zoning windows close.
9.2 Scenario B: The Policy-Fragmented World (“The Sovereign Landing”)
- The Narrative: The “Splinternet” accelerates. Geopolitical tensions drive the US, EU, and China to fully decouple their technology stacks. Data Sovereignty laws (like the EU Data Act) force multinationals to host data locally in every major jurisdiction.
- Market Dynamics:
- Demand: Re-routed, not destroyed. Efficiency is lost as workloads must be duplicated across borders (“N+1” becomes “N+Country”).
- Power: Less of a constraint than latency and compliance.
- Regulation: Protectionist. Governments subsidize “National Champion” data centers while blocking foreign ownership.
- The Marginal Winner:The Local Platform & Sovereign Cloud.
- Why: Assets that meet “Sovereign” criteria (e.g., staffed by locals, locally owned) capture 100% of government and banking flows.
- Key Metric: ROIC per Cabinet in sovereign-qualified assets.
- The Marginal Loser:The Global Efficiency Play.
- Why: The massive, centralized “Global Cloud” hub loses value as clients are forced to migrate to smaller, distributed regional nodes.
9.3 Scenario C: The Hyper-Efficient AI Plateau (“The Soft Landing”)
- The Narrative: The “AI Bubble” deflates or transforms. By 2028, chip efficiency (e.g., optical computing) outpaces model growth. “Small Language Models” (SLMs) running on edge devices replace massive cloud-based LLMs.
- Market Dynamics:
- Demand: Decelerates to a steady 5–8% utility-like growth.
- Power: The grid finally catches up. Interconnection queues shrink.
- Regulation: Eases as the energy crisis abates.
- The Marginal Winner:The Connectivity Ecosystem (Retail/Tower/Fiber).
- Why: If raw compute becomes a commodity again, value shifts back to the network—the dense ecosystems where users connect (Retail Colo) and the towers connecting the edge devices.
- Key Metric: Utilization and Ecosystem Density.
- The Marginal Loser:The Remote Hyperscale Campus.
- Why: If demand slows, the massive rural campuses built for 2030 capacity face a “Vacancy Shock,” creating a spread blow-out for developers.
9.4 The Investor Playbook: Allocation Strategy
How do you position a portfolio today to survive all three scenarios? We recommend a “Base + Tilt” construction: anchor the portfolio in core assets, then size your “scenario tilt” based on your house view.
For the Defensive Allocator (Pension Funds / Insurers)
- Goal: Liability matching; inflation protection.
- The Trade:Stabilized Core in Tier 1 Markets.
- Asset: Fully leased hyperscale assets in Northern Virginia, London, or Tokyo.
- Logic: Even in the “Plateau” scenario, Tier 1 vacancy will remain low due to ecosystem stickiness. In the “Rationing” scenario, you get rent growth.
- Avoid: Speculative development risk.
For the Growth Allocator (Private Equity / Value-Add)
- Goal: 20%+ IRR; Alpha generation.
- The Trade:The “Power-Plus” Retrofit.
- Asset: Acquisition of legacy industrial sites (paper mills, chemical plants) with >100MW energized substations. Convert to AI data centers.
- Logic: You are buying the power queue position, not the building. This is the most robust alpha strategyin the “Rationing” scenario.
For the Yield Allocator (Infrastructure Funds / REIT Investors)
- Goal: Cash yield; downside protection.
- The Trade:Towers & Fiber Duopolies.
- Asset: Tower portfolios in consolidated markets (US/Europe) and “First-Mover” fiber routes.
- Logic: These assets are “AI-Neutral.” Whether the AI model runs in the cloud (Scenario A) or on the phone (Scenario C), the data must travel over the airwaves and through the glass. It is a royalty on traffic, not compute.
9.5 Where to Look Next: The Watchlist
To judge which scenario is playing out, track these leading indicators:
1. The “CapEx-to-Revenue” Divergence
- Metric: Hyperscale Cloud Capex divided by Cloud Revenue (AWS/Azure/Google Cloud only).
- Signal: If Capex intensity remains >25% while Cloud Revenue growth slows to <15% for two consecutive quarters, Scenario C (Overbuild) is approaching.
2. The “Interconnection Queue” Delta
- Metric: Effective Queue Time for large-load (>100MW) projects after queue reforms.
- Signal: If timelines lengthen from 4 years to 6+ years, Scenario A (Rationing) is locked in. If queues suddenly drop (net of reform-driven reshuffles), demand is softening.
3. The “Training vs. Inference” Mix
- Metric: The shipment ratio of Training-Optimized vs. Inference-Optimized accelerators.
- Signal: A shift toward Inference suggests the market is maturing. Capital should rotate from rural campuses to Metro/Edge locations.
4. Pricing Power (Renewal Spreads)
- Metric: The “Mark-to-Market” on lease renewals (adjusted for retrofit capex).
- Signal: If a 10-year-old data center renews at a +30% higher rent net of capex, scarcity is real. If the rent bump merely covers the cost of a liquid cooling upgrade, pricing power is illusory.
Final Word: The Bridge to the Future
Digital infrastructure is no longer a niche. It is the sine qua non of the modern economy.
For the last decade, the wind was at our backs: cheap capital, cheap power, and boundless growth. The next decade will be harder. It will be defined by scarcity—of power, of land, and of social license.
But for the infrastructure investor, scarcity is a feature, not a bug. It creates moats. It supports pricing power. And it separates the tourists from the industrialists. The opportunity is no longer just to “buy the cloud,” but to secure the power stack that keeps it alive.