Is the Yield Curve Still the Market’s Best Recession Predictor?
For decades, Wall Street traders have watched one indicator above all others to predict economic downturns: the inverted yield curve. When short-term Treasury rates climb above long-term rates, investors brace for recession. But after the longest inversion in recent history failed to produce the recession it promised, a critical question emerges: has this legendary signal lost its prophetic power?
The Oracle’s Perfect Record
The yield curve’s reputation was earned through an impressive track record. Since World War II, an inverted yield curve preceded every single U.S. recession—a forecasting achievement unmatched by virtually any other economic indicator. The 10-year/3-month spread inverted before all nine NBER-dated recessions since 1955, with only one false positive in 1966.
The predictive mechanism wasn’t just correlation—it was grounded in solid economic theory. When the curve inverted, banks faced compressed profit margins on lending, causing them to tighten credit standards and choke off economic activity. Meanwhile, the inversion reflected market expectations that the Federal Reserve would soon need to slash rates in response to an impending downturn.
Quantitative models reinforced this confidence. Research from the New York Fed showed that a 10-year/3-month spread of -0.82 percentage points corresponded to a 50% probability of recession within 12 months. That probability soared to 90% if the inversion deepened to -2.40 percentage points.
What Changed: The Post-Crisis Revolution
The financial landscape that birthed the yield curve’s reliability no longer exists. Three seismic shifts have fundamentally altered how Treasury markets function—and what their signals mean.
Central Banks Rewrote the Playbook
Quantitative easing (QE) programs implemented after the 2008 financial crisis artificially compressed the term premium—the extra yield investors demand for holding long-term bonds. Federal Reserve asset purchases reduced the 10-year Treasury term premium by approximately 100 basis points at their peak. The European Central Bank’s programs produced similar effects, lowering sovereign term premia by about 95 basis points.
This intervention created an “insurance effect” where markets now expect central bank support during downturns, further depressing long-term yields by as much as 75 basis points. The result? Long-term rates are artificially suppressed regardless of economic fundamentals.
The Global Hunt for Safety
U.S. Treasury securities serve as the world’s ultimate safe-haven asset, creating enormous structural demand that’s largely insensitive to yield levels. Foreign central banks accumulated massive Treasury holdings as part of their foreign exchange reserves—a phenomenon Ben Bernanke termed the “Global Savings Glut”. One Federal Reserve study estimated this accumulation reduced the U.S. neutral interest rate by 50 to 65 basis points.
Domestic regulations amplified this demand. Basel III’s Liquidity Coverage Ratio forced banks to dramatically increase holdings of High-Quality Liquid Assets, with U.S. Treasuries as the primary qualifying asset. This regulatory mandate created large-scale, price-insensitive demand completely divorced from economic fundamentals.
The Neutral Rate’s Stunning Decline
Perhaps most importantly, the neutral real interest rate (r-star) has plummeted over recent decades. Estimates show the real neutral rate in the U.S. has fallen approximately 3.4 percentage points since the 1970s, settling around 0.5% to 0.6% by 2023. This demographic and productivity-driven decline means the entire yield structure operates at much lower levels.
The implication is profound: it’s now far easier for the Fed’s policy rate to rise above long-term yields and trigger an inversion, even with only mildly restrictive monetary policy. An inversion today may signal routine policy tightening rather than the severe tightening historically required to trigger deep recessions.
When the Oracle Failed: 2022-2024
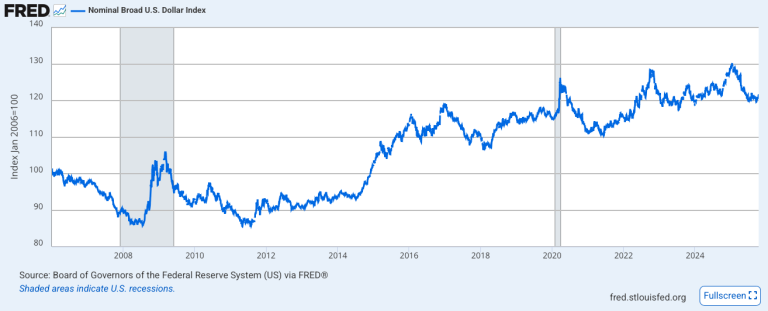
The period from 2022 to 2024 exposed these structural distortions. The 10-year/2-year and 10-year/3-month spreads plunged into deep, prolonged inversion—the longest in recent history. Traditional models assigned recession probabilities approaching 65%
Yet the predicted recession never arrived. Instead, the U.S. economy demonstrated remarkable resilience. Unemployment remained near multi-decade lows, corporate credit spreads stayed historically tight, and the Sahm Rule—a real-time recession indicator with a perfect track record—never triggered.
The divergence revealed the traditional yield curve was sending a false signal while other indicators correctly read the economy’s strength.
A Better Signal: The Near-Term Forward Spread
Federal Reserve economists identified a superior alternative: the near-term forward spread (NTFS), defined as the difference between the expected (future) three-month Treasury yield 18 months from now and the current three-month rate.
The NTFS offers a cleaner signal by focusing on the front end of the curve where monetary policy expectations dominate, effectively filtering out the structural distortions plaguing long-term rates. Research by Fed economists Eric Engstrom and Steven Sharpe demonstrated that the NTFS statistically outperforms traditional spreads in forecasting both recessions and GDP growth.
During the 2022-2024 episode, while traditional spreads screamed recession, the NTFS remained positive and even steep at times. This divergence signaled that markets expected eventual policy normalization rather than panic-driven rate cuts—consistent with a soft landing scenario that ultimately materialized.
Federal Reserve Chair Jerome Powell endorsed this view, stating that “the first 18 months of the yield curve is really what has 100% of the explanatory power“.
Investment Implications: A New Framework
For investors navigating this new reality, relying on the traditional yield curve as a standalone indicator is no longer prudent. Instead, a robust framework requires three components:
- Focus on the NTFS: Monitor the near-term forward spread as the primary yield curve indicator. An inverted NTFS represents a far more credible recession warning than traditional spreads.
- Cross-validate with credit markets: Corporate credit spreads remain a market-based gauge of default risk. Throughout 2022-2024, high-yield spreads stayed below 300 basis points and investment-grade spreads near 20-year lows—clear signals that credit markets weren’t pricing recession risk despite the inverted yield curve.
- Monitor real-time labor data: Employment indicators like jobless claims and the Sahm Rule provide direct measures of economic health. A true recession requires coherent warnings across the dashboard—inverted NTFS, widening credit spreads, and deteriorating labor markets.
The Reflexivity Problem
The yield curve’s fame has introduced a reflexivity that further complicates interpretation. When inversions trigger recession fears, businesses may delay investment and consumers may curtail spending, potentially creating a self-fulfilling prophecy. Nobel laureate Robert Shiller warned that “this talk itself can be a self-fulfilling prophecy”.
Conversely, central banks acutely aware of the indicator may preemptively ease policy to avert downturns, invalidating the signal. The 1998 episode demonstrated this dynamic when aggressive Fed rate cuts prevented recession despite an inverted curve.
The Bottom Line
The U.S. Treasury yield curve hasn’t become useless—but it has evolved from an oracle delivering unambiguous prophecies into a complex policy artifact requiring careful interpretation. Its message now speaks more to monetary policy stance relative to a historically low neutral rate than to the imminent fate of the business cycle.
Wall Street’s consensus has shifted accordingly. J.P. Morgan noted that “despite the longest inversion in recent history, a recession has yet to materialize,” concluding that “no single economic metric is infallible”. Goldman Sachs progressively lowered its recession probability throughout 2023-2024, citing labor market strength as reason to disregard the yield curve’s warning.
The structural forces suppressing long-term rates—central bank balance sheets, global safe-haven demand, regulatory mandates, and a depressed neutral rate—show no signs of reverting to pre-2008 conditions. Investors must adapt by deconstructing the curve into its components, contextualizing the term premium as a structural feature rather than a risk signal, and cross-validating any curve-based warnings against a comprehensive dashboard of indicators.
In today’s markets, listening to the bond market means eavesdropping on a complex, reflexive conversation about policy and risk—not hearing a clear forecast of economic destiny.