A Primer on the Health Care Equipment & Supplies Industry (GICS 351010)
This primer provides a comprehensive overview of the Health Care Equipment & Supplies industry (GICS 351010), a critical subsector within the broader Health Care landscape. Designed for junior financial analysts, this document dissects the industry’s structure, economic drivers, regulatory framework, and competitive dynamics. The GICS 351010 sector, often termed MedTech, encompasses a diverse array of products, from low-margin consumables and durable medical equipment (DME) to high-value implantable devices and sophisticated surgical robotics. Understanding this sector is vital due to its unique “defensive-growth” profile; it benefits from the inelastic demand inherent in healthcare spending while simultaneously capitalizing on high-beta technological innovation. This analysis explores the complex value chain involving OEMs, distributors, Group Purchasing Organizations (GPOs), and payers, highlighting how regulatory pathways (e.g., FDA 510(k) vs. PMA) create significant barriers to entry. Furthermore, we examine key trends such as the shift to minimally invasive procedures, digital integration, and ongoing M&A activity, concluding with essential valuation frameworks necessary for rigorous investment analysis in the MedTech space.
1.0 INTRODUCTION AND TAXONOMY
The Health Care Equipment & Supplies industry, classified under the Global Industry Classification Standard (GICS) code 351010, represents the engineering and infrastructure backbone of modern medicine. This subsector encompasses companies that manufacture and distribute capital equipment, consumables, and supplies used in the diagnosis, treatment, and monitoring of patients. Products within this taxonomy are highly heterogeneous, ranging from basic consumables such as syringes and bandages, to sophisticated durable medical equipment (DME), and extending to high-technology products including surgical instruments, diagnostic apparatus, implantable devices (e.g., pacemakers, artificial joints), and robotic surgical systems [S&P/MSCI, GICS Methodology, 2023]. The defining characteristic of this group is the physical and engineered nature of its products, differentiating it from the chemical or biological focus of Pharmaceuticals and Biotechnology (GICS 3520) ().
Within the GICS hierarchy, 351010 sits under the Industry Group “Health Care Equipment & Services” (GICS 3510), which itself falls under the Sector “Health Care” (GICS 35).2 It is crucial to distinguish the Industry “Health Care Equipment & Supplies” (351010) from its sister industries: “Health Care Providers & Services” (351020), which includes the hospitals and clinics that are the primary customers for MedTech products; and “Health Care Technology” (351030), which focuses primarily on software and IT services. In practice, the boundaries between these classifications are becoming increasingly blurred as equipment manufacturers integrate sophisticated software, data analytics, and service contracts into their offerings. Nevertheless, the GICS taxonomy provides a necessary framework for peer group analysis and sector rotation strategies.3
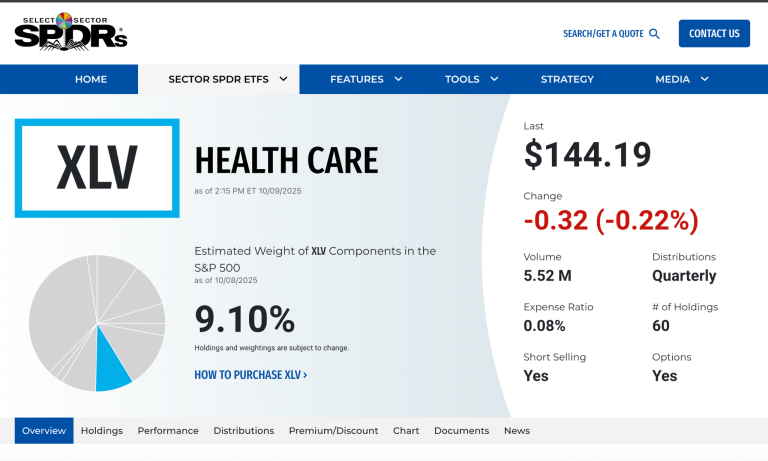
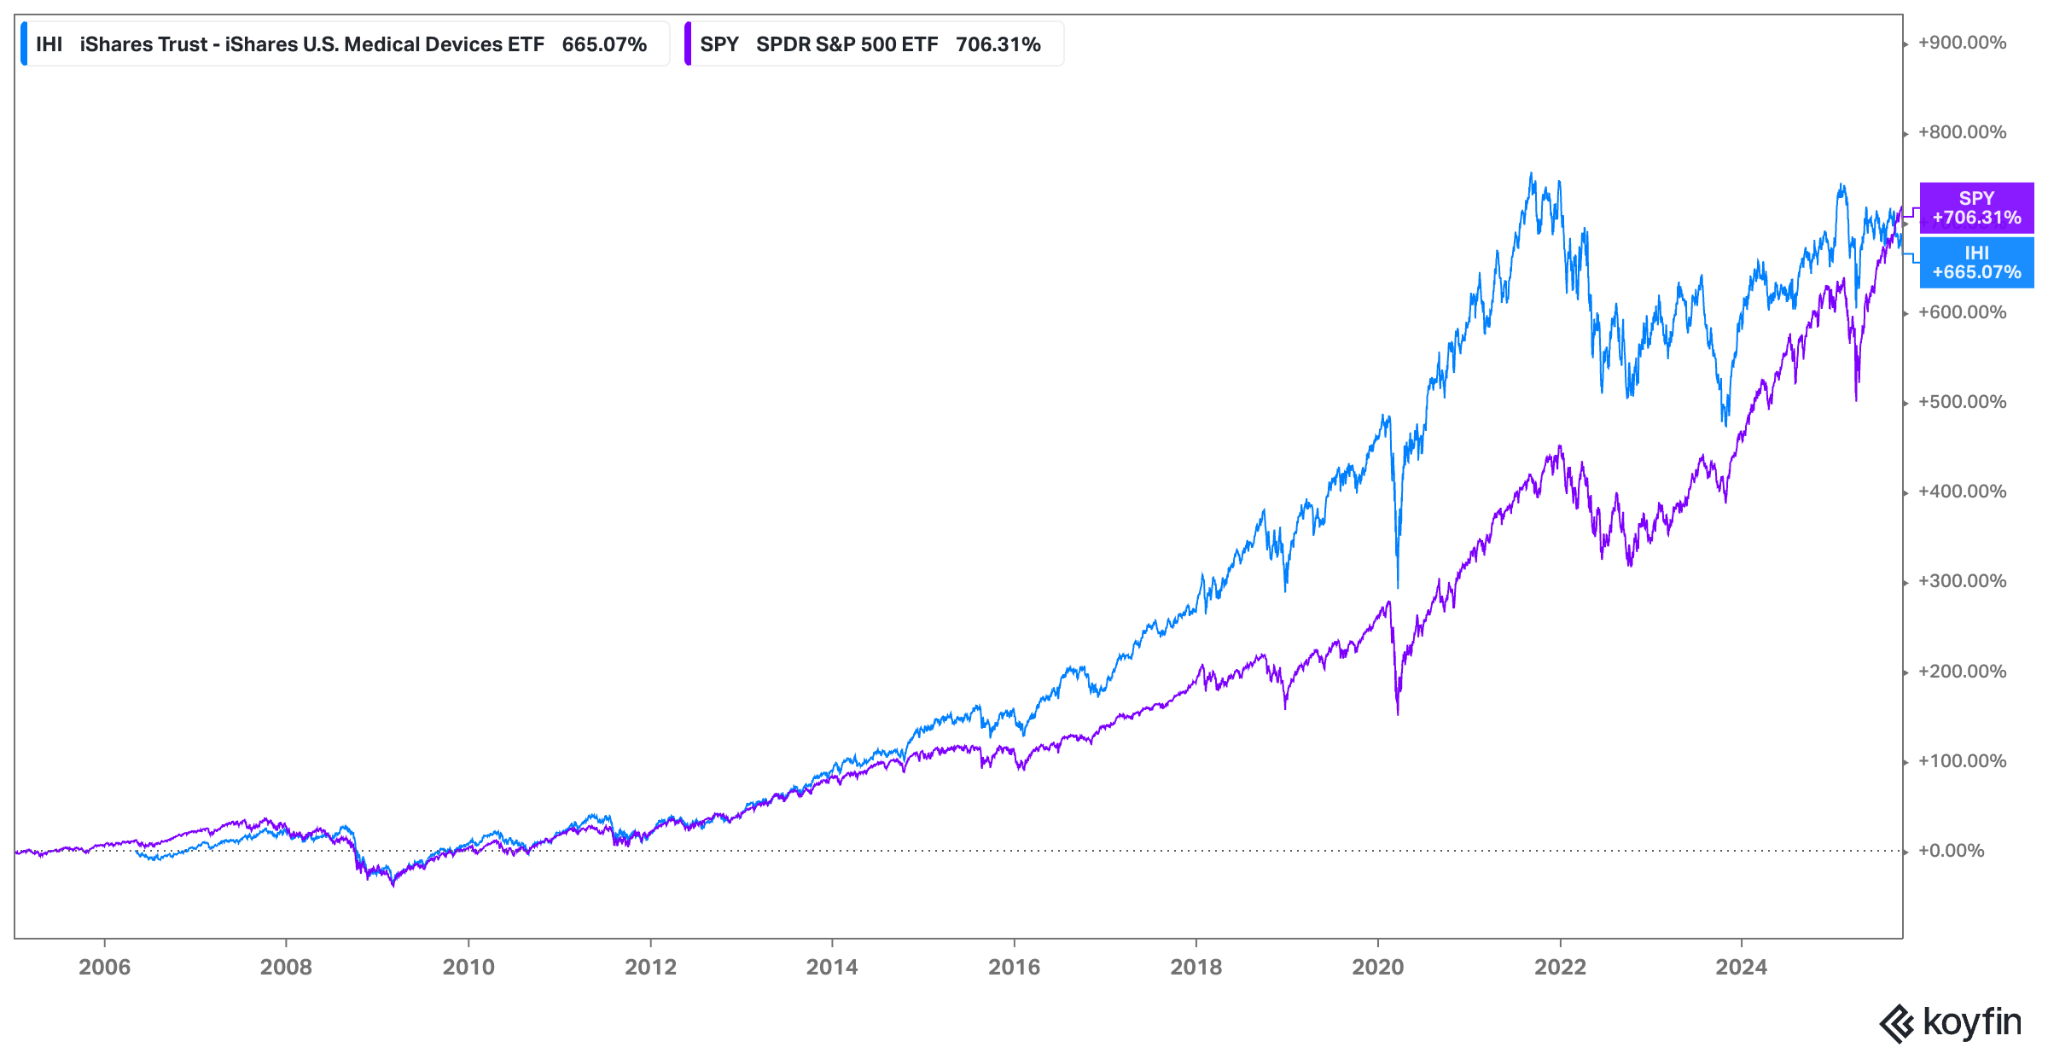
The investment profile of Health Care Equipment & Supplies is often characterized as “defensive growth.” The defensive nature stems from the non-discretionary demand for many medical procedures; patients require treatment regardless of the macroeconomic climate, providing a stable revenue floor. However, the growth component is driven by continuous technological innovation, expansion into emerging markets, and favorable secular trends. This dual nature has historically allowed the sector, often tracked via ETFs such as the iShares U.S. Medical Devices ETF (IHI), to offer compelling risk-adjusted returns, though performance relative to the broader market (S&P 500) and the overall health care sector (XLV) varies depending on interest rate environments, regulatory changes, and innovation cycles.

The IHI ETF demonstrates the long-term outperformance potential of the medical device sector through the majority of the period. Recently, the trend has reversed and SPY outperforms IGU.
Several powerful structural drivers underpin the long-term growth trajectory of the GICS 351010 sector. Foremost among these are demographic shifts, specifically the aging populations in developed economies (U.S., Europe, Japan). Older individuals consume significantly more healthcare resources and are more likely to require surgical interventions and implantable devices [OECD, Health Statistics, 2024]. Concurrently, the rising prevalence of chronic diseases globally—such as diabetes, cardiovascular disease, and obesity—increases the demand for diagnostic tools, monitoring equipment, and therapeutic devices. Finally, technological advancement remains the lifeblood of the industry, with innovations in materials science, robotics, and digital integration constantly expanding the addressable market and improving patient outcomes.
2.0 INDUSTRY STRUCTURE AND VALUE CHAIN
The value chain for Health Care Equipment & Supplies is complex, characterized by specialized manufacturing, stringent regulatory oversight, and consolidated procurement channels. Value creation begins with research and development (R&D), where intellectual property (IP) is generated. This flows to component suppliers and specialized contract manufacturing organizations (CMOs) that provide raw materials, electronic components, and specialized plastics or metals. Original Equipment Manufacturers (OEMs)—the branded MedTech companies—then design, assemble, sterilize, and package the final products.9 This manufacturing phase requires significant investment in quality control and adherence to regulatory standards such as the FDA’s Quality System Regulation (QSR) [FDA, 21 CFR Part 820].
Once manufactured, products move through distinct distribution channels to reach the end-users, primarily hospitals and increasingly, Ambulatory Surgery Centers (ASCs). Large OEMs often utilize a hybrid distribution model. They may sell directly to large hospital systems, leveraging specialized sales forces that provide clinical support and training, which is particularly crucial for complex devices like cardiovascular implants or surgical robots. Alternatively, they may rely on large national distributors (e.g., McKesson, Cardinal Health) for high-volume, lower-margin consumables. These distributors aggregate demand and provide logistical efficiency, but they also exert pricing pressure on OEMs.13 The final stage involves payers—government programs (e.g., CMS in the U.S.) and private insurers—who ultimately finance the purchase or use of these products through reimbursement mechanisms.
The economics vary significantly across different product categories within GICS 351010. High-technology implantable devices (e.g., heart valves, neurostimulators) and sophisticated capital equipment (e.g., MRI machines, robotic surgery platforms) are characterized by high gross margins (often >70% USD, GAAP). These segments benefit from strong IP protection, significant R&D investment, and high barriers to entry. Many successful models in this space employ a “razor-and-blade” strategy, where the capital equipment (the razor) is placed to lock in a long-term, high-margin recurring revenue stream from proprietary consumables, instruments, and service contracts (the blades). By contrast, the consumables and supplies segment (e.g., wound care, syringes) is often commoditized, characterized by lower gross margins (~40% USD, GAAP), high volumes, and intense price competition.
The procurement landscape is a critical determinant of OEM profitability, dominated by organizations designed to consolidate hospital bargaining power. Group Purchasing Organizations (GPOs) negotiate contracts with OEMs on behalf of member hospitals, leveraging aggregated volume to secure discounts. While GPOs streamline the contracting process, they significantly intensify pricing pressure, particularly for commoditized products [GAO, Group Purchasing Organizations Report, 2022]. Furthermore, the rise of Integrated Delivery Networks (IDNs)—large hospital systems that have consolidated regionally—allows these entities to bypass GPOs and negotiate directly with OEMs, demanding not only competitive pricing but also evidence of clinical efficacy and economic value. This shift forces OEMs to compete on value rather than just features, complicating the commercialization process.
Recap: Value Chain Dynamics
- R&D and IP: Primary source of value creation and competitive advantage, particularly for high-tech implants and capital equipment.
- Manufacturing: High fixed costs (including regulatory compliance) and stringent quality control requirements create barriers to scale.15
- Distribution: Hybrid models balance direct sales (for complex devices requiring clinical support) and third-party distributors (for consumables).
- Procurement (GPOs/IDNs): Consolidated buyers exert significant pricing pressure, forcing a shift towards value-based contracting.
- Payers: Reimbursement policies dictate market access, pricing power, and adoption rates for new technologies.
3.0 ECONOMIC CHARACTERISTICS
The Health Care Equipment & Supplies industry exhibits several distinct economic characteristics that shape its performance and investment profile. A primary feature is the relative inelasticity of demand. A significant portion of medical procedures are non-discretionary, meaning they must be performed regardless of the economic environment. This provides a stable demand floor, making the sector less sensitive to macroeconomic downturns compared to consumer discretionary or industrial sectors. However, it is not entirely immune; elective procedures (e.g., orthopedic replacements, certain aesthetic treatments) can be deferred during periods of economic uncertainty or when consumer confidence and employment levels (which affect insurance coverage in the U.S.) decline.
Barriers to entry in the MedTech sector are substantial, contributing to the high margins and market concentration observed in many segments. These barriers are multifaceted. The regulatory environment (detailed in Section 4.0) imposes significant costs and time delays on new entrants. Intellectual property protection, including patents on device design and manufacturing processes, safeguards innovation. Furthermore, established OEMs benefit from strong relationships with physicians and hospitals, reinforced by training requirements and switching costs associated with complex equipment. The need for specialized sales forces and established distribution networks also presents a formidable hurdle for new competitors.
The industry is characterized by high operating leverage and varying degrees of capital intensity. Manufacturing specialized medical devices often involves high fixed costs related to specialized facilities, quality systems, and R&D investments. Consequently, incremental volume growth can lead to significant margin expansion, as fixed costs are spread over a larger revenue base. Capital intensity varies by sub-segment; manufacturers of large diagnostic imaging equipment face high Capex requirements, whereas manufacturers of single-use disposables may have lower fixed asset intensity but higher working capital needs. Across the sector, R&D spending is a significant investment, often representing 10-15% of revenue (Non-GAAP) for innovation-driven companies [AdvaMed, The MedTech Industry in the U.S., 2024].
Revenue drivers in this sector are closely tied to utilization trends, procedure volumes, and hospital financial health. The primary driver for consumables and implantables is the volume of medical procedures performed. This is influenced by secular trends (aging, chronic disease) and cyclical factors (elective procedure deferrals). For capital equipment, the drivers are more complex, depending heavily on hospital capital expenditure (Capex) cycles. Hospitals make large investments in new equipment based on their operating margins, access to financing (influenced by interest rates), and the replacement cycle of existing equipment. Therefore, understanding hospital admission rates, surgical volumes, and Capex budgets is crucial for forecasting OEM revenue streams.
4.0 REGULATORY ENVIRONMENT
The regulatory landscape is perhaps the single most significant factor shaping the competitive dynamics, innovation speed, and cost structure of the Health Care Equipment & Supplies industry. Devices are strictly regulated globally to ensure patient safety and efficacy.18 The U.S. Food and Drug Administration (FDA) and the European Union’s regulatory framework are the most influential, often setting the standard for other regions. The regulatory burden creates substantial barriers to entry, requiring significant investment in clinical trials, regulatory affairs expertise, and quality management systems.
In the United States, the FDA classifies medical devices into three categories based on risk [FDA, 21 CFR 860].1 Class I devices are low-risk (e.g., bandages, surgical tools) and are generally exempt from premarket review, subject only to general controls. Class II devices pose moderate risk (e.g., infusion pumps, powered wheelchairs) and typically require a 510(k) premarket notification. The 510(k) pathway is the most common route to market; it requires the manufacturer to demonstrate “substantial equivalence” to a legally marketed predicate device, often without requiring new clinical trials. This pathway is faster and less costly. Class III devices are high-risk, life-sustaining, or novel (e.g., pacemakers, heart valves) and require Pre-Market Approval (PMA). The PMA pathway is rigorous, demanding extensive clinical trial data to establish safety and effectiveness, significantly increasing the time and cost to market.2
The European Union recently underwent a significant regulatory overhaul, transitioning from the Medical Device Directive (MDD) to the Medical Device Regulation (MDR).24 The EU MDR, fully implemented after several delays (TBD – verify final implementation date via MedTech Europe), imposes stricter requirements for clinical evidence, post-market surveillance, and supply chain traceability. This transition has proven challenging for the industry, leading to increased costs, longer approval times, and the rationalization of product portfolios, as some legacy products could not economically justify the cost of MDR compliance. While aiming to improve patient safety, the MDR has simultaneously increased the regulatory burden on OEMs operating in Europe.
Post-market surveillance and the economics of recalls are also critical aspects of the regulatory environment. OEMs are required to monitor the performance of their devices after market launch and report adverse events. If a safety issue is identified, the FDA or other regulatory bodies may mandate a product recall. Recalls can have severe financial implications, including the costs of remediation, litigation, lost revenue, and significant reputational damage.26 High-profile recalls underscore the importance of robust quality systems and the potential tail risk associated with regulatory compliance failures.
Recap: How Regulation Shapes Competitive Moats
- Barriers to Entry: High costs and long timelines associated with regulatory approval (especially PMA) protect incumbents.
- Innovation Strategy: The 510(k) pathway encourages iterative innovation based on predicate devices, fostering rapid improvement cycles.
- Cost Structure: Regulatory compliance (QSR, MDR) adds significant overhead to manufacturing and SG&A.28
- Market Access: Reimbursement is often contingent upon regulatory approval, linking FDA/EMA decisions directly to revenue potential.
- Geographic Strategy: Navigating the complexities of the EU MDR and other international regulations (e.g., China’s NMPA) requires dedicated resources.
5.0 COMPETITIVE DYNAMICS
The competitive landscape of the GICS 351010 sector is characterized by high concentration in specific end-markets, significant switching costs, and persistent pricing pressure from consolidated buyers. While the overall MedTech market appears fragmented, many specific segments exhibit oligopolistic structures. For instance, the orthopedic reconstruction market (hips and knees) is dominated by a handful of players (Zimmer Biomet, Stryker, J&J, Smith & Nephew), and the cardiovascular device market similarly features high concentration. Globally, the top 10 OEMs account for over 50% of the total market revenue (TBD – verify exact percentage via EvaluateMedTech, 2025), reflecting the benefits of scale in manufacturing, distribution, and R&D.
Switching costs play a crucial role in maintaining market share and creating competitive moats. For complex surgical devices and implantables, physicians develop expertise and familiarity through extensive training and repeated use. This “physician preference” makes them reluctant to switch to a competitor’s product, even if it offers marginal improvements or lower cost, due to the learning curve and potential impact on patient outcomes. For capital equipment, switching costs are even higher. Hospitals invest heavily in integrating equipment into their workflows and IT systems.29 Moreover, long-term service contracts associated with capital purchases create a steady revenue stream for the OEM and further lock in the customer, making replacement decisions infrequent and highly scrutinized.
Despite these moats, the industry faces persistent and intensifying pricing pressure. The primary driver of this pressure is the consolidation of the customer base. As hospitals merge into larger IDNs and GPOs aggregate purchasing volume, their bargaining power increases significantly. These entities demand price concessions, rebates, and risk-sharing arrangements. In many European and Asian markets, centralized tender systems further intensify price competition, as OEMs bid aggressively to win large, multi-year contracts. This environment forces OEMs to constantly innovate to justify premium pricing or relentlessly pursue operational efficiencies to compete on cost.
Insert Chart: Top 10 MedTech Companies’ Global Market Share
Source: Koyfin / EvaluateMedTech (TBD – Verify via EvaluateMedTech)
Caption: The global MedTech industry is top-heavy, with the largest diversified players leveraging scale and broad portfolios to maintain significant market share.
The competitive dynamics also differ significantly between capital and consumable business models. Capital models (e.g., imaging systems, surgical robots) rely on large, upfront sales followed by a long replacement cycle. Competition in these segments focuses on technological features, clinical outcomes, and the total cost of ownership (including service and upgrades). Consumable models (e.g., wound care, single-use instruments) rely on high-volume, recurring revenue tied to procedure volumes. Competition here is often driven by price, manufacturing efficiency, and distribution scale. As noted previously, the most attractive models often blend these approaches, using capital placements (razor) to drive the adoption of high-margin proprietary consumables (blades).
6.0 COST STRUCTURE & PROFITABILITY
Understanding the cost structure of Health Care Equipment & Supplies companies is essential for analyzing profitability drivers and sensitivity to external factors. The typical income statement can be broken down into Cost of Goods Sold (COGS), Selling, General, and Administrative (SG&A) expenses, and Research and Development (R&D) investment. COGS includes direct materials, manufacturing labor, overhead, sterilization, and logistics. The composition of COGS varies; for instance, electronic components and specialized metals dominate the input costs for implantable devices, while resins and textiles are key inputs for consumables.
Gross margins in the sector vary widely, primarily driven by the product mix and the level of innovation. High-value, IP-protected implantable devices (e.g., cardiovascular, neurostimulation) typically command gross margins exceeding 70% (USD, GAAP). These high margins reflect the significant R&D investment required to bring these devices to market and their ability to command premium pricing due to clinical differentiation. By contrast, commoditized disposables and supplies often have gross margins closer to 40% (USD, GAAP), reflecting intense price competition and lower barriers to entry. The overall gross margin for a diversified OEM is therefore highly sensitive to shifts in the product mix towards higher-value segments.
SG&A expenses represent a substantial portion of the cost structure, often exceeding 30% of revenue. This is driven primarily by the industry’s unique sales model. For complex devices, OEMs employ specialized sales forces composed of highly trained clinical specialists who often provide support directly in the operating room. This high-touch sales model is expensive but crucial for driving adoption and maintaining physician relationships. Marketing expenses, regulatory compliance costs, and general administrative overhead also contribute to SG&A. Consequently, achieving operating leverage through SG&A efficiency is a key focus for management teams, particularly as companies scale or integrate acquisitions.
External factors can significantly impact the cost structure and profitability. Given the global nature of manufacturing and sales, OEMs are exposed to foreign exchange (FX) volatility.30 A strong USD can negatively impact reported revenues from international markets (requiring analysis in constant currency terms for underlying performance) and affect the competitiveness of U.S.-manufactured goods.31 Furthermore, volatility in commodity inputs (e.g., oil-derived resins, precious metals, semiconductors) can pressure COGS. While OEMs attempt to mitigate these risks through hedging programs and contractual pass-throughs, sustained input cost inflation can erode gross margins, particularly if the competitive environment limits the ability to raise prices correspondingly.
7.0 MACRO & POLICY SENSITIVITY
While the Health Care Equipment & Supplies sector is often considered defensive, it is not impervious to macroeconomic forces and policy changes. The interplay between interest rates, employment levels, and healthcare utilization significantly influences the sector’s performance. Interest rates play a dual role. Higher rates increase the cost of capital for OEMs, potentially impacting M&A activity and internal investment decisions. More significantly, higher rates affect the financial health of hospitals, increasing the cost of financing large capital equipment purchases and potentially leading to delays in Capex cycles.
Employment levels are a critical macroeconomic driver, particularly in the U.S. market where health insurance coverage is often tied to employment.32 High employment levels and wage growth generally correlate with higher rates of insurance coverage, which in turn supports demand for elective medical procedures. Conversely, during economic downturns characterized by rising unemployment, the loss of insurance coverage and increased consumer uncertainty can lead to the deferral of elective procedures, negatively impacting volumes for orthopedic implants, aesthetic devices, and other elective categories. The post-pandemic period highlighted this sensitivity, as procedure volumes rebounded strongly with economic recovery and improved staffing levels at healthcare facilities.
Policy and payer reforms represent significant exogenous risks and opportunities for the sector. Reimbursement frameworks are constantly evolving. In the U.S., the Centers for Medicare & Medicaid Services (CMS) utilizes Diagnosis-Related Groups (DRGs) to reimburse hospitals a fixed amount for a given procedure, regardless of the actual costs incurred.34 This system incentivizes hospitals to control costs, including the prices paid for medical devices.35 The ongoing shift from traditional Fee-for-Service (FFS) models to Value-Based Care (VBC) models further emphasizes cost-effectiveness and patient outcomes. VBC models tie reimbursement to quality metrics, forcing OEMs to demonstrate the economic value of their products beyond clinical efficacy.
Capital budget cycles in the hospital sector are also sensitive to policy changes and the overall operating environment.36 Hospitals operate on relatively thin margins, and their ability to invest in new equipment depends on their profitability and cash flow.37 Changes in reimbursement rates, regulatory burdens (e.g., staffing requirements), and the mix of payers (government vs. private insurance) can significantly impact hospital financial health and, consequently, their Capex spending.38 Therefore, analysts must closely monitor hospital operating metrics and CMS policy updates to forecast demand for capital-intensive medical equipment.
Recap: Cyclical vs. Secular Forces Shaping Revenue Visibility
- Secular Tailwinds: Aging demographics, chronic disease prevalence, and technological innovation provide long-term growth support.39
- Cyclical Sensitivity (Elective Procedures): Demand is sensitive to employment levels, consumer confidence, and insurance coverage.
- Cyclical Sensitivity (Capex): Hospital capital spending is influenced by interest rates, access to financing, and hospital profitability.
- Policy Risk: Changes in reimbursement models (DRGs, VBC) exert continuous pressure on pricing and utilization.
- Revenue Visibility: Recurring revenue from consumables and service contracts provides stability, while capital sales introduce volatility.
8.0 INNOVATION AND TECHNOLOGY TRENDS
Innovation is the engine of growth in the Health Care Equipment & Supplies industry. The constant pursuit of improved clinical outcomes, enhanced efficiency, and expanded treatment options drives R&D investment and shapes the competitive landscape. Several key technology trends are currently transforming the sector, creating significant opportunities for growth and disruption. These trends are converging to create a new paradigm of data-driven, personalized, and minimally invasive care.
Minimally Invasive Surgery (MIS) & Robotics
The shift from traditional open surgery to minimally invasive surgery (MIS) has been a multi-decade trend, driven by clinical benefits such as reduced trauma, shorter hospital stays, and faster recovery times.41 The evolution of MIS is now increasingly driven by robotic-assisted surgery.42 Companies like Intuitive Surgical (ISRG) pioneered this field, offering platforms that provide enhanced precision, dexterity, and visualization.43 The adoption of robotics is expanding beyond early strongholds (urology, gynecology) into general surgery, orthopedics, and other specialties. Competition in the robotics space is intensifying as large diversified OEMs enter the market, aiming to capture a share of this high-growth segment. The economics of robotics are attractive, utilizing the razor-and-blade model with significant recurring revenue from instruments and service contracts.
Digital Health Integration and AI-driven Diagnostics
The integration of digital technologies—software, data analytics, and connectivity—is profoundly impacting the MedTech sector. Devices are increasingly connected, generating vast amounts of data (the Internet of Medical Things, IoMT). This data, when analyzed using artificial intelligence (AI) and machine learning (ML) algorithms, can provide valuable insights for clinical decision support, treatment planning, and predictive maintenance of equipment. AI is particularly transformative in diagnostics, enhancing the accuracy and efficiency of image analysis in radiology and pathology.44 OEMs are increasingly developing integrated solutions that combine hardware with software platforms, shifting their business models towards subscription-based revenue streams and deeper integration into the healthcare ecosystem.
Wearables & Remote Patient Monitoring (RPM)
The convergence of miniaturized sensors, wireless connectivity, and consumer electronics has fueled the growth of wearable medical devices and remote patient monitoring (RPM) solutions. This trend is driven by the need to manage chronic diseases more effectively and the desire to shift care from high-cost hospital settings to the home. Continuous Glucose Monitors (CGMs) for diabetes management are a prime example of this trend, demonstrating rapid adoption and significant market growth. Other applications include wearable cardiac monitors and sensors for tracking vital signs. RPM technologies enable healthcare providers to monitor patients remotely, improving outcomes and reducing the need for hospitalizations, blurring the lines between traditional medical devices and consumer health technology.
Additive Manufacturing and Supply-chain Localization
Advancements in manufacturing technologies, particularly additive manufacturing (3D printing), are enabling new possibilities in device design and production. 3D printing is increasingly used to produce customized implants, surgical guides, and anatomical models, particularly in orthopedics and dental applications. This technology allows for complex geometries that enhance osseointegration and improve patient fit. Furthermore, recent geopolitical volatility and the pandemic highlighted the vulnerabilities of global supply chains. In response, there is a growing trend towards supply chain localization and resiliency. OEMs are investing in localized manufacturing capabilities and diversifying their supplier base to mitigate risks and ensure continuity of supply.
9.0 CAPITAL MARKETS & M&A
The Health Care Equipment & Supplies sector is a dynamic arena for capital market activity, characterized by active M&A, distinct valuation profiles, and evolving corporate structures.56 Valuation dispersion within the sector is significant. Large-cap, diversified OEMs (e.g., Medtronic, Stryker) often trade as “compounders,” characterized by stable growth, strong cash flow generation, and moderate valuation multiples (EV/EBITDA). These companies typically return capital to shareholders through dividends and share repurchases. By contrast, small- and mid-cap (SMID-cap) companies focused on high-growth niches (e.g., structural heart, electrophysiology) often exhibit higher revenue growth rates but may be pre-profitability or in the early stages of commercialization. These companies trade at higher multiples, often valued on EV/Sales due to the expectation of future earnings growth.
Mergers and acquisitions (M&A) are a critical strategic lever for MedTech companies. The industry consistently sees high levels of deal activity, driven by two primary themes: scale vs. innovation. Large-cap OEMs face the challenge of maintaining growth as their core markets mature. Consequently, they frequently acquire innovative SMID-cap companies (“tuck-in” acquisitions) to access new technologies, expand into adjacent high-growth markets, and replenish their R&D pipelines. These acquisitions often function as external R&D, preferred over internal development due to the faster time to market and reduced execution risk. Scale acquisitions, although less frequent, aim to broaden product portfolios, increase negotiating leverage with hospitals, and realize cost synergies through operational efficiencies.
In recent years, there has been a notable trend of corporate spin-offs and divestitures. Conglomerates are increasingly slimming down their portfolios to focus on higher-growth, higher-margin segments where they have a competitive advantage. The spin-off of GE HealthCare from General Electric is a prominent example, creating a pure-play imaging and diagnostics company.57 Similarly, established MedTech companies are divesting lower-growth or commoditized businesses (e.g., Zimmer Biomet spinning off its dental and spine divisions; Medtronic exploring divestitures of certain monitoring businesses) to improve their growth profile and valuation multiples.58 These actions reflect a strategic shift towards focus and specialization, aiming to unlock shareholder value.
Recap: How Capital Cycles Amplify Innovation and Consolidation
- M&A as External R&D: Tuck-in acquisitions are crucial for large OEMs to rapidly access innovation and sustain growth.
- Valuation Sensitivity: High-growth SMID-caps are sensitive to risk sentiment and interest rates, impacting acquisition premiums.59
- Scale Benefits: Consolidation driven by the desire for broader portfolios, increased bargaining power, and cost synergies.
- Focus and Specialization: Trend towards spin-offs and divestitures to optimize portfolios and improve valuation multiples.
- Financing Environment: M&A activity volume is sensitive to interest rates and the availability of debt financing.
10.0 VALUATION FRAMEWORKS
Valuing companies in the Health Care Equipment & Supplies sector requires a nuanced approach that considers their diverse growth profiles, profitability metrics, and innovation pipelines.60 Analysts typically employ a combination of intrinsic valuation methods (Discounted Cash Flow analysis) and relative valuation methods (comparable company analysis) to triangulate a fair value. The choice of methodology depends on the maturity of the company and the stability of its cash flows.
Comparable company analysis is widely used, relying on key trading multiples to assess valuation relative to peers.61 For established, profitable companies, Enterprise Value to Earnings Before Interest, Taxes, Depreciation, and Amortization (EV/EBITDA) is the most common metric. EV/EBITDA is preferred over Price-to-Earnings (P/E) because it is independent of capital structure and accounting policies regarding depreciation. When using EV/EBITDA, it is crucial to select an appropriate peer group with similar growth prospects, margin profiles (GAAP or Non-GAAP, consistently applied), and end-market exposures. For high-growth, unprofitable SMID-cap companies, EV/Sales is often used, as EBITDA may be negative or not meaningful. This metric focuses on the company’s revenue growth trajectory and market opportunity.
Discounted Cash Flow (DCF) analysis is the cornerstone of intrinsic valuation, providing a rigorous framework for assessing the present value of a company’s future free cash flows.62 The DCF methodology requires explicit assumptions about revenue growth, profitability, capital expenditures, and the discount rate (Weighted Average Cost of Capital, WACC).63 Key drivers in a MedTech DCF include assumptions about procedure volume growth, market share gains (driven by new product launches), pricing trends (often slightly negative in constant currency), and operating margin expansion (driven by operating leverage and mix shift). Given the long product life cycles and high barriers to entry in the sector, a long explicit forecast period (often 10 years or more) is appropriate.
Analyzing the spread between Return on Invested Capital (ROIC) and WACC is a powerful tool for assessing value creation and the strength of a company’s competitive advantage (moat).64 Companies that consistently generate ROIC above their WACC are creating shareholder value. In the MedTech sector, high ROIC is often driven by strong IP protection, high switching costs, and specialized manufacturing capabilities. Tracking the trajectory of the ROIC-WACC spread over time can provide insights into the sustainability of a company’s competitive position and the effectiveness of its capital allocation strategy, particularly regarding M&A and R&D investments.
11.0 CASE STUDIES
To illustrate the diverse strategies and business models within the GICS 351010 sector, we examine concise profiles of representative firms, highlighting their market positioning, key performance indicators (KPIs), and strategic focus.
Medtronic (MDT)
Medtronic is the largest diversified medical device company globally, operating across Cardiovascular, Medical Surgical, Neuroscience, and Diabetes segments.65 Its strategy centers on leveraging its scale, broad product portfolio, and extensive distribution network. Medtronic has historically relied on M&A (notably Covidien) to drive growth but has recently focused on internal reorganization and portfolio optimization, including potential divestitures.66 The company aims to accelerate organic growth through innovation in key areas like surgical robotics and renal denervation.67 Key KPIs to monitor include organic revenue growth (aiming for mid-single digits, constant currency), operating margin expansion (Non-GAAP), and R&D pipeline execution. MDT is positioned as a diversified market leader undergoing a strategic transformation to improve execution and growth.68
Boston Scientific (BSX)
Boston Scientific is a leading player in interventional medicine, focused on less invasive technologies across cardiovascular, endoscopy, urology, and neuromodulation.69 The company has established a strong track record of consistent above-market growth, driven by a focus on innovation, strong commercial execution, and successful integration of targeted M&A. BSX emphasizes high-growth niches, such as electrophysiology and structural heart, and invests heavily in R&D to maintain a robust pipeline. Key KPIs include organic revenue growth (often high-single digits, constant currency), gross margin expansion (driven by mix shift), and Free Cash Flow (FCF) margin. Boston Scientific is positioned as a growth leader in the large-cap MedTech space, benefiting from its focus on high-acuity, minimally invasive procedures.
Intuitive Surgical (ISRG)
Intuitive Surgical is the pioneer and dominant leader in soft-tissue robotic-assisted surgery with its da Vinci system.70 The company employs a classic razor-and-blade business model: hardware (systems) + consumables (instruments and accessories) + services. ISRG benefits from significant competitive moats, including extensive IP, very high switching costs, and a massive global installed base.71 Its growth strategy focuses on expanding adoption into new geographies and procedure types, particularly general surgery. Key KPIs include system placements, procedure growth rate (the primary revenue driver), and utilization per system. ISRG is positioned as a high-growth, high-margin technology leader, though it faces increasing competition from new entrants in the robotics market.72
Stryker (SYK)
Stryker is a diversified MedTech company with leading positions in Orthopaedics, Medical and Surgical (MedSurg) equipment, and Neurotechnology and Spine.73 The company operates a decentralized organizational structure that fosters accountability and strong sales execution. Stryker’s growth strategy combines organic innovation with strategic acquisitions to broaden its portfolio.74 A key driver in orthopedics has been the adoption of its Mako robotic system for joint replacement, which pulls through implant sales. Key KPIs include organic sales growth (consistently above market), Mako adoption rates, and SG&A leverage (Non-GAAP). Stryker is positioned as a consistent compounder with a balanced portfolio and strong commercial capabilities.
Zimmer Biomet (ZBH)
Zimmer Biomet is a pure-play leader in the orthopedic reconstruction market (hips and knees), operating in a mature, highly concentrated market.75 Following the merger of Zimmer and Biomet, the company faced integration challenges and market share losses. ZBH has been undergoing a multi-year turnaround focused on improving operational efficiency, revitalizing its portfolio, and stabilizing market share. A key element of its strategy is the rollout of its ROSA robotics platform and the integration of digital technologies (smart implants) to compete with Stryker’s Mako. Key KPIs include market share stabilization (particularly in hips and knees), operating margin improvement (GAAP and Non-GAAP), and ROSA adoption. ZBH is positioned as a turnaround story in a stable end-market.76
12.0 SECULAR OUTLOOK
The next decade (2025–2035) for the Health Care Equipment & Supplies industry will be shaped by the confluence of demographic shifts, technological advancements, and evolving healthcare policies. The secular tailwinds of aging populations and the rising burden of chronic diseases will continue to drive underlying demand for medical interventions. However, the way this demand is met will undergo significant transformation, driven by innovation and the imperative to improve the efficiency and effectiveness of healthcare delivery. The global MedTech market is projected to grow at a mid-single-digit CAGR (constant currency) over this period, but growth will be unevenly distributed.
A major trend shaping the outlook is the continued shift of procedures from traditional inpatient hospital settings to outpatient settings, particularly Ambulatory Surgery Centers (ASCs) and the home. This shift is driven by advances in minimally invasive techniques and payer incentives to reduce the cost of care. This trend requires OEMs to adapt their product portfolios; equipment designed for ASCs must be cost-effective, have a smaller footprint, and be optimized for faster throughput. The growth of home care will further fuel demand for remote monitoring devices and telehealth solutions.77
Technological penetration will remain a key growth driver. The adoption of robotic surgery is expected to accelerate as new platforms enter the market, competition increases, and clinical evidence expands. The integration of AI and digital technologies will transform diagnostics, treatment planning, and personalized medicine.78 We anticipate a shift towards integrated platforms that combine hardware, software, and data analytics to deliver comprehensive solutions. This digitalization will create new revenue streams (e.g., subscription models) but also increase the complexity of the regulatory environment and raise concerns about data privacy and cybersecurity.
Pricing pressure and the transition to value-based pricing models will continue to challenge the industry. Healthcare systems globally are grappling with rising costs, forcing them to scrutinize the value proposition of medical technologies. OEMs will need to generate robust clinical and economic evidence to justify premium pricing and secure favorable reimbursement. Value-based contracting, including risk-sharing agreements, will become more prevalent, tying the financial performance of devices to patient outcomes. This environment favors companies that can demonstrate a positive impact on the total cost of care.

Finally, sustainability (ESG) pressures will increasingly influence the sector. Concerns about the environmental impact of single-use plastics, sterilization methods (e.g., ethylene oxide emissions), and manufacturing processes are growing. The strategic winners in the coming decade will likely be integrated platforms that leverage technology to deliver superior clinical and economic value. Strategic risks include sustained pricing pressure eroding margins, regulatory drag slowing the pace of innovation, and ongoing supply chain vulnerabilities in a volatile geopolitical environment.
13.0 TOOLKIT
For junior analysts covering the Health Care Equipment & Supplies sector, a structured diligence process is essential. The following checkpoints provide a framework for analyzing individual companies and the broader industry:
Revenue Visibility Drivers
- Procedure Mix: Analyze the exposure to elective vs. non-discretionary procedures. How sensitive is the revenue stream to macroeconomic cycles?
- Capital vs. Consumables: What percentage of revenue is recurring (consumables and services) vs. one-time (capital equipment sales)?
- Hospital Capital Budgets: Monitor hospital financial health, admission rates, and capital spending plans to forecast demand for capital equipment.
- Pricing Trends: Assess the impact of GPOs, IDN consolidation, and reimbursement changes. Analyze organic growth decomposition (volume vs. price, constant currency).
Margin Sensitivity
- Product Mix: How does the shift in product mix (towards higher/lower margin segments) impact the overall gross margin (GAAP and Non-GAAP)?
- FX Exposure: Quantify the sensitivity of revenues and earnings to foreign exchange fluctuations. Analyze hedging strategies.
- Input Costs: Assess the exposure to commodity price volatility (resins, metals, semiconductors) and the ability to pass through cost increases.
- Operating Leverage: Analyze the fixed vs. variable cost structure. How effectively is the company leveraging SG&A and R&D investments as it scales?
Pipeline Evaluation Metrics
- Regulatory Class and Pathway: Is the device Class I, II (510(k)), or III (PMA)? What is the expected timeline and cost of approval?
- TAM (Total Addressable Market): What is the size of the market opportunity? How penetrated is the market currently?
- Clinical Efficacy and Economic Value: Does the device offer superior clinical outcomes or economic benefits compared to the standard of care?
- Payback Period: For capital equipment, what is the expected payback period for the hospital customer?
Comparative Multiples
- EV/EBITDA: Analyze relative to appropriate peer groups and historical ranges for profitable companies.
- EV/Sales: Used for high-growth, pre-profitability companies.
- FCF Yield: Assess the cash generation capacity of mature companies.
- ROIC vs. WACC: Assess the company’s track record of value creation and the sustainability of its competitive advantage.
Key Filings and Data Feeds
- SEC Filings (10-K/10-Q): Essential for financial data, risk factors, and management discussion and analysis.
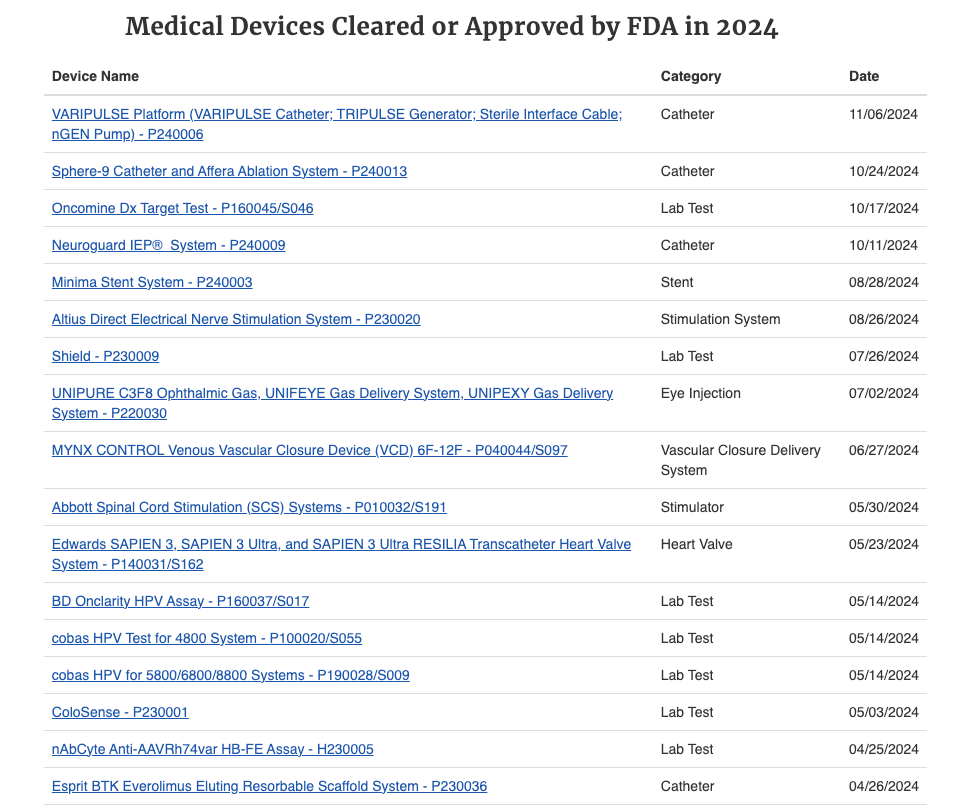
- FDA Databases: Monitor device approvals (510(k), PMA), recalls, and adverse event reports (MAUDE database).79
- CMS Data: Track reimbursement policies, DRG updates, and healthcare utilization trends.
- Industry Associations (AdvaMed, MedTech Europe): Provide industry statistics, policy updates, and market trends.80
- Financial Data Providers (Koyfin, Bloomberg): Monitor ETF performance (IHI, XLV), trading multiples, and peer group analysis.
14.0 CONCLUSION
The Health Care Equipment & Supplies industry (GICS 351010) occupies a unique and compelling position within the investment landscape. It sits at the nexus of stable, inelastic healthcare demand and rapid technological innovation, offering a “defensive-growth” profile that is attractive across market cycles. The structural drivers of aging demographics, the rising prevalence of chronic diseases, and the expansion of healthcare access globally provide a robust foundation for long-term growth. Furthermore, the high barriers to entry created by regulation, intellectual property, and established commercial channels contribute to the sector’s high margins and concentrated market structures.
However, the sector is not without its challenges. Persistent pricing pressure from consolidated buyers and evolving reimbursement models demand that companies continuously innovate and demonstrate economic value. The macroeconomic sensitivity of elective procedures and hospital capital budgets introduces cyclical volatility. Navigating the complex and evolving regulatory landscape requires significant investment and expertise. Ultimately, success in the MedTech sector depends on the ability to develop and commercialize innovative technologies that improve patient outcomes while enhancing the efficiency of healthcare delivery. For the diligent analyst, understanding the intricate interplay of these forces is the foundation for rigorous analysis and informed investment decisions in this dynamic industry.
APPENDICES
A) Glossary of Device Regulatory Terms
- 510(k): FDA premarket notification pathway (Class II devices), requiring demonstration of “substantial equivalence” to a predicate device.81
- ASC (Ambulatory Surgery Center): Outpatient facilities for procedures not requiring an overnight hospital stay.82
- CMS (Centers for Medicare & Medicaid Services): U.S. federal agency administering Medicare and Medicaid; the largest payer in the U.S.
- DME (Durable Medical Equipment): Reusable medical equipment used in the home (e.g., wheelchairs, oxygen equipment).
- DRG (Diagnosis-Related Group): A system used by payers to classify hospital cases for reimbursement (fixed payment for a given procedure).
- GPO (Group Purchasing Organization): An entity that negotiates contracts with manufacturers on behalf of member hospitals to leverage aggregated purchasing volume.84
- IDN (Integrated Delivery Network): A network of healthcare facilities and providers under a parent holding company (e.g., regional hospital systems).
- MDR (Medical Device Regulation): The regulatory framework in the European Union, replacing the MDD, imposing stricter requirements.85
- OEM (Original Equipment Manufacturer): Branded companies that design, manufacture, and market medical devices.86
- PMA (Pre-Market Approval): The most stringent FDA regulatory pathway (Class III devices), requiring extensive clinical trial data.87
B) Data Sources & Retrieval Dates
- AdvaMed, “The MedTech Industry in the U.S.,” 2024.
- FDA, Code of Federal Regulations (CFR) Title 21, Part 820 and Part 860.
- FDA.gov, Center for Devices and Radiological Health (CDRH) data.
- GAO (U.S. Government Accountability Office), Reports on Group Purchasing Organizations, 2022.
- OECD, Health Statistics, 2024.
- S&P/MSCI, “Global Industry Classification Standard (GICS) Methodology,” 2023.
- Company Filings (10-K/10-Q) for representative firms (MDT, BSX, ISRG, SYK, ZBH).
- Note: Data from Koyfin, Bloomberg, EvaluateMedTech, MedTech Europe, FRED, and AHA are indicated as placeholders, requiring verification as of October 2025.
C) Disclaimer
This document is intended for educational and informational purposes only and should not be construed as investment advice, a recommendation, or an offer to buy or sell any securities. The information contained herein is based on sources believed to be reliable, but its accuracy and completeness cannot be guaranteed. The views expressed are those of the author as of the publication date (October 11, 2025) and are subject to change without notice. Investment in the financial markets involves risks, including the potential loss of principal.88 Readers should conduct their own independent research and consult with a qualified financial advisor before making any investment decisions.