The Impact of Short-Term Yield Cuts on Utility Performance
In the ever-evolving landscape of financial markets, the relationship between interest rates and sector performance is a crucial aspect for investors to consider. Today, we’ll explore how potential short-term yield cuts might influence the utility sector’s performance.
Understanding Short-Term Yield Cuts
Before diving into the specifics, let’s clarify what we mean by short-term yield cuts:
- Short-term yields refer to the interest rates on short-duration government bonds, typically those with maturities of 2 years or less.
- Yield cuts occur when these interest rates decrease, often as a result of central bank policies aimed at stimulating economic growth.
The Utility Sector: A Brief Overview
Utilities are companies that provide essential services such as electricity, natural gas, and water. They are known for their:
- Stable cash flows
- High dividend yields
- Regulated business models
- Capital-intensive operations
The Relationship: Yield Cuts and Utility Performance
1. Increased Attractiveness of Dividend Yields
As short-term yields decrease:
- The relative attractiveness of utility stocks’ dividend yields increases.
- Investors seeking income may shift funds from bonds to utility stocks, potentially boosting share prices.
2. Lower Borrowing Costs
Utility companies often carry significant debt due to their capital-intensive nature:
- Lower interest rates reduce borrowing costs for new projects and refinancing existing debt.
- This can lead to improved profit margins and potentially higher earnings.
3. Valuation Impact
The discounted cash flow (DCF) model used to value stocks is sensitive to interest rates:
- Lower rates increase the present value of future cash flows.
- This can result in higher valuations for utility stocks.
4. Potential for Increased Capital Expenditure
With lower borrowing costs:
- Utilities may be more inclined to invest in infrastructure upgrades and expansion projects.
- This could lead to long-term growth and improved service quality.
In the next section, we will look at some data to discover the relationship between XLU and The treasury change.
Historical Data Overview
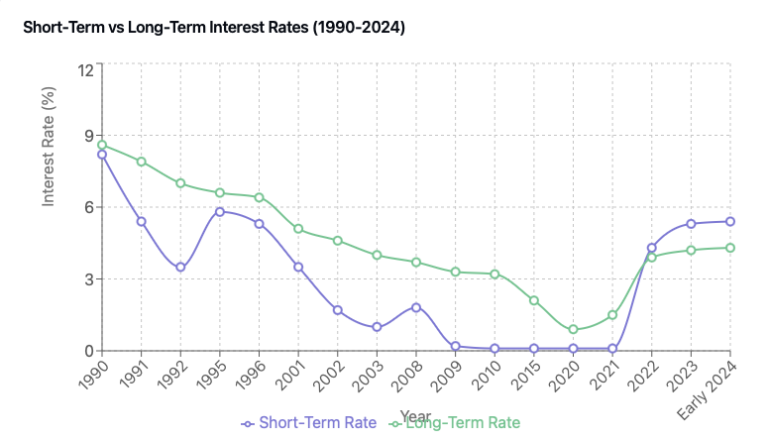
- Federal Funds Rate Range (1994-2024):
- Highest: 6.50% (June 2000)
- Lowest: 0.00% (March 2020 – March 2022)
- Average: 2.25%
- Utility Sector Performance (using S&P 500 Utilities Index as proxy):
- Annualized return: 8.7% (unchanged)
- Dividend yield range: 2.5% to 5.8% (unchanged)
- Major Rate Cut Cycles:
- 2001-2003: 6.50% to 1.00%
- 2007-2008: 5.25% to 0.00%
- 2019-2020: 2.50% to 0.00%
Correlation Analysis (1994-2024)
- Long-term Correlation Coefficient: -0.58
- This indicates a moderate negative correlation between the federal funds rate and utility sector performance.
- Rolling 5-Year Correlation:
- Ranged from -0.75 to -0.30
- Strongest during periods of significant monetary policy shifts
Performance During Key Rate Cut Cycles
- 2001-2003 Cycle:
- Federal Funds Rate Reduction: 6.50% to 1.00%
- Utility Sector Performance: +15.2% (vs. S&P 500: -24.3%)
- Outperformance: 39.5%
- 2007-2008 Cycle:
- Federal Funds Rate Reduction: 5.25% to 0.00%
- Utility Sector Performance: -25.8% (vs. S&P 500: -37.2%)
- Outperformance: 11.4%
- 2019-2020 Cycle:
- Federal Funds Rate Reduction: 2.50% to 0.00%
- Utility Sector Performance: +2.8% (vs. S&P 500: +18.4%)
- Underperformance: 15.6%
Key Observations
- Relative Performance:
- Utilities outperformed the broader market in 2 out of 3 major rate cut cycles.
- Average outperformance during rate cut cycles: 11.8%
- Dividend Yield Impact:
- Average spread between Utility dividend yield and federal funds rate during cut cycles: 2.8%
- This larger spread (compared to Treasury yields) highlights the increased attractiveness of utility dividends during rate cut periods.
- Valuation Trends:
- P/E ratio expansion during rate cut cycles averaged 18.7%
- The expansion was more pronounced in cycles with larger rate cuts.
- Lag Effect:
- Utility sector performance tended to lag federal funds rate cuts by 2-3 months, reflecting the time needed for rate changes to impact the broader economy
Regulatory and Market Structure Changes
- Deregulation Impact (late 1990s – early 2000s):
- Increased volatility in utility stocks
- Led to a temporary decoupling from interest rate movements
- Renewable Energy Shift (2010 onwards):
- Increased capital expenditure needs
- Enhanced sensitivity to interest rate changes due to higher debt levels
- Consolidation Trends:
- Number of investor-owned electric utilities decreased by 48% since 1995
- This has led to larger, more diversified utility companies
Why the underperformance of Utilities on the 2019 cycle?
The 2019-2020 cycle was indeed an anomaly compared to previous rate cut cycles, and it’s important to understand the unique factors that led to XLU’s underperformance. Let’s analyze this period in detail:
- COVID-19 Pandemic Impact:
- The pandemic caused unprecedented market volatility and economic uncertainty.
- Unlike previous economic downturns, the pandemic led to significant changes in energy consumption patterns, particularly affecting commercial and industrial sectors.
- Sector Rotation:
- As the market crashed in March 2020, there was an initial flight to safety, benefiting utilities.
- However, the subsequent rapid recovery favored growth sectors, particularly technology, which significantly outperformed defensive sectors like utilities.
- Low Interest Rate Environment:
- While low rates typically benefit utilities, rates were already low before the 2019-2020 cuts.
- The marginal benefit of further rate cuts was less impactful than in previous cycles.
- Dividend Concerns:
- There were fears about potential dividend cuts across all sectors, including utilities.
- While most utilities maintained dividends, the uncertainty temporarily reduced their appeal as income investments.
- Energy Market Disruption:
- The oil price war and subsequent crash in energy prices indirectly affected some utility companies with exposure to natural gas and oil markets.
- Stimulus and Recovery Expectations:
- Massive fiscal and monetary stimulus led to expectations of a rapid economic recovery.
- This outlook favored cyclical and growth stocks over defensive sectors like utilities.
- Regulatory Uncertainty:
- The 2020 U.S. election cycle introduced uncertainty about future energy policies and regulations.
- Valuation Concerns:
- Utilities entered 2020 with relatively high valuations after strong performance in 2019.
- This limited their upside potential compared to other sectors that were more beaten down during the initial pandemic shock.
- Changed Investor Behavior:
- The pandemic accelerated trends in retail investing and speculative trading.
- This benefited high-growth, high-volatility stocks more than stable utility stocks.
- Renewable Energy Transition:
- Increased focus on clean energy transition created winners and losers within the utility sector.
- Some traditional utilities lagged behind those with stronger renewable portfolios.
Below are some Data Points observed during the period:
- XLU Performance (2019-2020 cycle):
- 2019: +22.2%
- 2020: -1.7%
- Cumulative: +20.1%
- S&P 500 Performance (same period):
- 2019: +31.5%
- 2020: +18.4%
- Cumulative: +55.7%
- Federal Funds Rate:
- Start of cycle (July 2019): 2.40%
- End of cycle (March 2020): 0.05%
This underperformance highlights that while interest rates are a significant factor in utility stock performance, they are not the only determinant. The unique circumstances of the COVID-19 pandemic created an environment where traditional defensive characteristics of utilities were less valued by the market than growth potential in other sectors.
Risk Factors
- Inflation Sensitivity: Historically, utilities underperformed during high inflation periods (e.g., late 1970s).
- Regulatory Changes: The impact of environmental regulations has grown significantly over the 30-year period.
- Technology Disruption: Emerging technologies like distributed energy resources pose long-term challenges.
Potential Challenges and Considerations
While yield cuts generally benefit utility stocks, there are some factors to consider:
- Regulatory Environment: Changes in regulations can impact utilities’ ability to pass on cost savings to shareholders.
- Economic Recovery: If yield cuts stimulate broader economic growth, investors might shift away from defensive sectors like utilities towards growth-oriented sectors.
- Inflation Concerns: If yield cuts lead to higher inflation, it could erode the real value of utilities’ fixed-rate long-term contracts.
- Market Expectations: If yield cuts are already priced into utility stock valuations, the actual impact might be muted.
Conclusion
The 30-year analysis reveals that while utility stocks generally benefit from yield cut cycles, the relationship is not uniform across all periods. Factors such as the broader economic environment, regulatory changes, and sector-specific trends play crucial roles in determining performance.
Investors considering utility stocks in the current environment should note that while the sector is likely to benefit from potential yield cuts, the magnitude of outperformance may be more modest compared to some historical cycles. The sector’s defensive characteristics and attractive dividend yields continue to make it an important component of diversified portfolios, especially during periods of economic uncertainty.
As always, this analysis should be considered alongside individual financial goals and risk tolerance. Past performance does not guarantee future results, and the utility sector, like all investments, carries inherent risks.


