1. Technical indicators with Python – Moving Averages
In our series on Python for finance, we’ve covered portfolio construction , risk management , backtesting , and optimization . Now, we’ll explore how to use Python to implement technical indicators, starting with moving averages.
Disclaimer: This article was drafted with the assistance of artificial intelligence and reviewed by the editor prior to publication to ensure accuracy and clarity.
Understanding Technical Indicators
Technical indicators are calculations based on historical price and volume data that aim to forecast future price movements. They are widely used by traders to identify potential entry and exit points, trends, and reversals.
- Moving Averages: Moving averages smooth out price data to help identify the underlying trend.
- A simple moving average (SMA) calculates the average price of a security over a specific number of periods.
- An exponential moving average (EMA) gives more weight to recent prices, making it more responsive to new information.
Moving averages with Python
We’ll use Python and the yfinance library to fetch stock data and calculate moving averages. For this example, let’s consider Apple (AAPL) stock.
Step 1: Import Libraries and Fetch Data
import yfinance as yf
import pandas as pd
import matplotlib.pyplot as plt

# Define the stock and time period
ticker = 'AAPL'
start_date = '2023-01-01'
end_date = '2024-01-01'

# Download adjusted closing prices
data = yf.download(ticker, start=start_date, end=end_date)['Close']
This code fetches the adjusted closing prices for Apple (AAPL) within the specified date range.
Step 2: Calculate Simple Moving Average (SMA)
# Calculate 20-day SMA
sma_20 = data.rolling(window=20).mean()

# Plot the closing prices with SMA
plt.figure(figsize=(14, 7))
plt.plot(data, label='AAPL Close Price')
plt.plot(sma_20, label='20-day SMA')
plt.title('AAPL Close Price with 20-day SMA')
plt.xlabel('Date')
plt.ylabel('Price')
plt.legend()
plt.grid(True)
plt.show()
This code calculates the 20-day SMA and plots it along with the closing prices. The rolling() function calculates the moving average over a rolling window of 20 days.
Below is the outcome of the Python code showing the closing price of Apple (AAPL) in blue and its 20-day Simple Moving Average (SMA) in orange from January 2023 to January 2024.
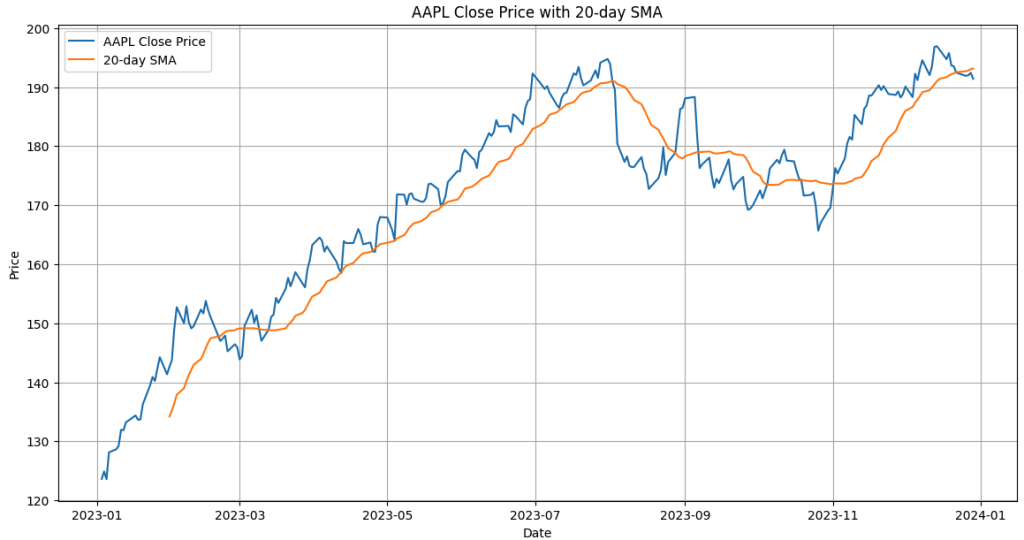
When the blue line (close price) is above the orange line (SMA), it generally indicates an upward trend or bullish momentum in the short term. Conversely, when the blue line is below the orange line, it suggests a downward trend or bearish momentum. Crossovers between the two lines may be used by traders as potential buy or sell signals.
Step 3: Calculate Exponential Moving Average (EMA)
# Calculate 20-day EMA
ema_20 = data.ewm(span=20, adjust=False).mean()

# Plot the closing prices with EMA
plt.figure(figsize=(14, 7))
plt.plot(data, label='AAPL Close Price')
plt.plot(ema_20, label='20-day EMA')
plt.title('AAPL Close Price with 20-day EMA')
plt.xlabel('Date')
plt.ylabel('Price')
plt.legend()
plt.grid(True)
plt.show()
This code calculates the 20-day EMA using the ewm() function. The span parameter specifies the number of periods used for the EMA calculation:
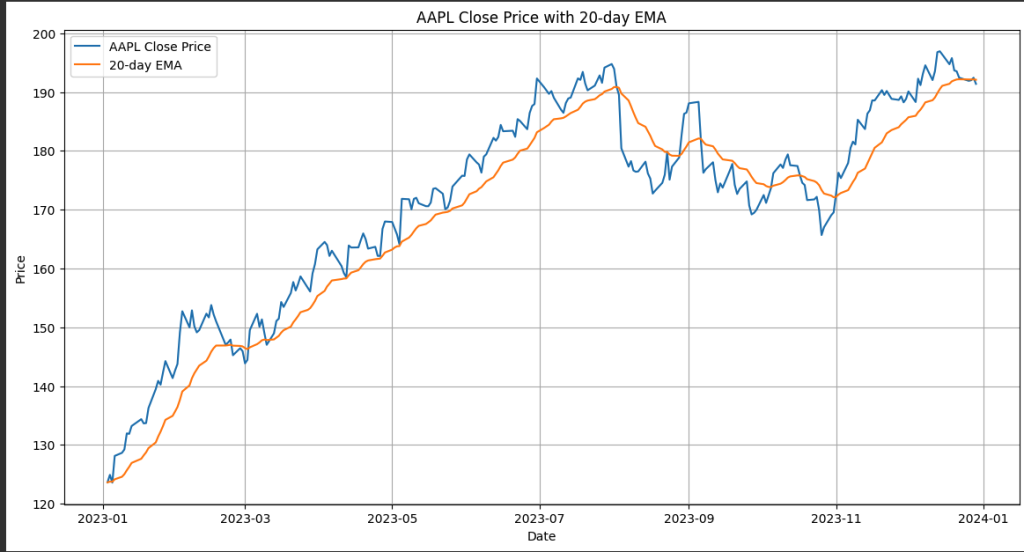
As stated above, the Exponential Moving Average gives more weight to the most recent closing prices. This makes it more sensitive and responsive to new price data compared to the SMA. We can see that the orange EMA line generally follows the blue closing price line more closely than the SMA does in the first image. It reacts more quickly to upward and downward price swings.
Step 4: Combining SMA and EMA
It’s common to use both SMA and EMA in conjunction to get a more comprehensive view.
# Plot closing prices with SMA and EMA
plt.figure(figsize=(14, 7))
plt.plot(data, label='AAPL Close Price')
plt.plot(sma_20, label='20-day SMA')
plt.plot(ema_20, label='20-day EMA')
plt.title('AAPL Close Price with 20-day SMA and EMA')
plt.xlabel('Date')
plt.ylabel('Price')
plt.legend()
plt.grid(True)
plt.show()
This code plots the closing prices, SMA, and EMA on the same chart, allowing for easy comparison.
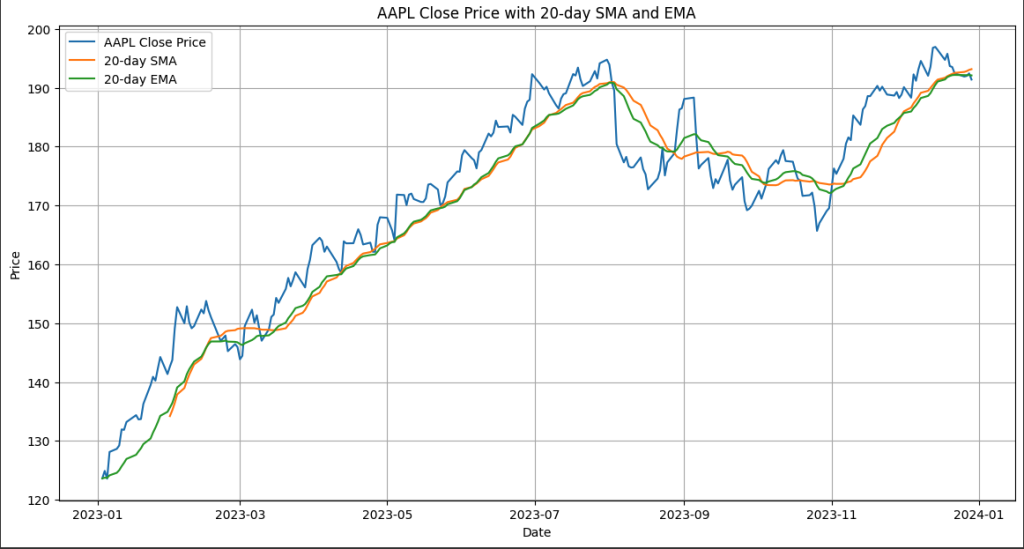
Traders often use crossovers between the price, SMA, and EMA to generate buy or sell signals.
- For example, if the price crosses above both the SMA and EMA, it could be seen as a bullish signal.
- Conversely, if the price crosses below both, it could be a bearish signal.
Please do not follow this strategy since it is a very naive one and also do not use technical indicators alone to make investment decisions.
Expanding Your Analysis
Moving averages are just one type of technical indicator. Here are a few more that you can explore:
- Relative Strength Index (RSI): Measures the magnitude of recent price changes to evaluate overbought or oversold conditions.
- Moving Average Convergence Divergence (MACD): A trend-following momentum indicator that shows the relationship between two moving averages of a security’s price.
- Bollinger Bands: Envelopes plotted at a standard deviation above and below a moving average, indicating areas of potential support or resistance.
Conclusion
Technical indicators like moving averages can be valuable tools for analyzing price trends and making informed trading decisions. By implementing these indicators in Python, you can automate your analysis and gain deeper insights into market movements.
Disclaimer: This analysis is for educational purposes only and not financial advice. Technical indicators are based on historical data and do not guarantee future results. Investing involves risks, including the potential loss of principal. Consult a qualified financial advisor before making investment decisions.

