Sector Overview: S&P 500 Systems Software
Section 1: Introduction and Industry Definition
The Systems Software sub-industry represents the foundational infrastructure layer of the global digital economy. Within the Global Industry Classification Standard (GICS) framework, this sector is distinct from Application Software; whereas application vendors provide tools for end-user productivity (e.g., creating a spreadsheet or managing a sales pipeline), Systems Software companies provide the operating systems, database management architectures, cybersecurity protocols, and IT service management (ITSM) layers that enable those applications to function.
Investors should view this sector not merely as a collection of legacy tech incumbents, but as the critical infrastructure layer required to support the massive compute demands of the generative AI era. The boundary between hardware and software has blurred, and Systems Software acts as the essential bridge, managing the complex interplay between physical data centers and the abstracted cloud environments that modern enterprises rely upon (e.g., security appliances increasingly ship as software subscriptions tied to cloud control planes).
Classification Decision Rule
To ensure the investable universe is cleanly defined and comparable, we establish a clear decision rule for borderline sub-sectors. This report filters constituents based on functional logic:
- In (Runs Infrastructure):
- Core Infrastructure: Operating Systems (OS) and Database Management Systems (DBMS).
- Security: Network, Endpoint, and Cloud security platforms that function as critical infrastructure.
- IT Service Management (ITSM): Platforms that manage the provisioning, health, and workflow of IT assets.
- Out (Builds Software):
- Middleware & DevOps: Standalone tools primarily used for building software rather than runninginfrastructure (often classified under Application Software).
- Pure-Play Observability: Excluded unless deeply integrated into a broader security or operations platform (e.g., within ServiceNow or CrowdStrike).
Key Constituents and Market Leaders (Universe Sanity Check)
This report analyzes the following key S&P 500 constituents. Our core universe is the S&P 500 Systems Software cohort led by Microsoft, ServiceNow, Palo Alto Networks, CrowdStrike, and Fortinet, which together drive the bulk of sub-industry market cap, with the functional addition of Oracle. Other smaller Systems Software constituents exist in the S&P 500 but are not primary drivers of sector performance.
The Constituents The sector is anchored by two distinct groups:
- Foundational Pillars:
- Microsoft Corporation (MSFT): The sector’s bellwether, representing the convergence of legacy OS (Windows) and modern cloud infrastructure (Azure).
- Oracle Corporation (ORCL): While GICS currently classifies Oracle as Application Software, we include it in this primer because database management remains a foundational systems layer and Oracle is the dominant installed-base owner in this domain.
- Cybersecurity & Operations Leaders:
- Palo Alto Networks (PANW) and Fortinet (FTNT): These firms have evolved from appliance roots to cloud-delivered security platforms, moving beyond hardware dependence to become essential Zero-Trust platforms with expanding module attach and high-visibility ARR.
- CrowdStrike Holdings (CRWD): A cloud-native endpoint and XDR platform from inception, representing the modern, agent-based security stack.
- ServiceNow (NOW): The de facto standard for IT Service Management, serving as the control plane that automates enterprise IT operations. Note that while often compared to Salesforce (CRM), ServiceNow is included here as “Systems Software” because it manages infrastructure workflows, whereas Salesforce is excluded as “Application Software” for managing customer revenue workflows.
Thesis Statement
The Systems Software sector has fundamentally evolved from a cyclical, hardware-attached business model into a secular growth engine. The investment thesis for 2025 and beyond rests on three pillars:
- Digital Transformation: The continued migration of workloads to the cloud changes the revenue model from lumpy license sales to predictable, recurring consumption.
- The Cybersecurity Imperative: Security has transitioned from a discretionary insurance policy to a mandatory infrastructure requirement, materially reducing cyclicality relative to prior IT spend regimes.
- Generative AI Infrastructure: GenAI is not just an application layer trend; it is accelerating re-platforming of databases and operating environments. Systems Software vendors are the “pick and shovel” providers for this build-out, offering the requisite data structures and security environments to run AI models safely.
Section 2: Executive Summary
The Investment Stance: The Utility Layer of the AI Economy
The S&P 500 Systems Software sub-industry is materially less correlated to the traditional hardware-refresh cycles that historically governed Information Technology returns. This sector can be viewed not merely as a collection of legacy operating systems and security tools, but as the “utility layer” of the burgeoning AI economy. Utilities earn valuation premiums when usage is sticky, expands per customer, and scales via efficient infrastructure; Systems Software mirrors this dynamic by providing the non-negotiable rails—OS, database, security, and ITSM—upon which modern AI workloads must run. While the application layer faces potential disruption from autonomous AI agents that may bypass traditional user interfaces, the underlying systems infrastructure remains essential. Current market trends suggest a favorable environment for this sector.
Market participants often favor “Platform” constituents that demonstrate a target profile of high Net Revenue Retention (NRR >110%) and structural Sales & Marketing (S&M) leverage. We identify Microsoft (MSFT), Palo Alto Networks (PANW), CrowdStrike (CRWD), and ServiceNow (NOW) as some of the potential primary beneficiaries of this regime. These firms own the control planes for compute, security, and operations, granting them pricing power that serves as a hedge against the deflationary risks threatening other areas of the software stack.
Sector Calls and Structural Shifts
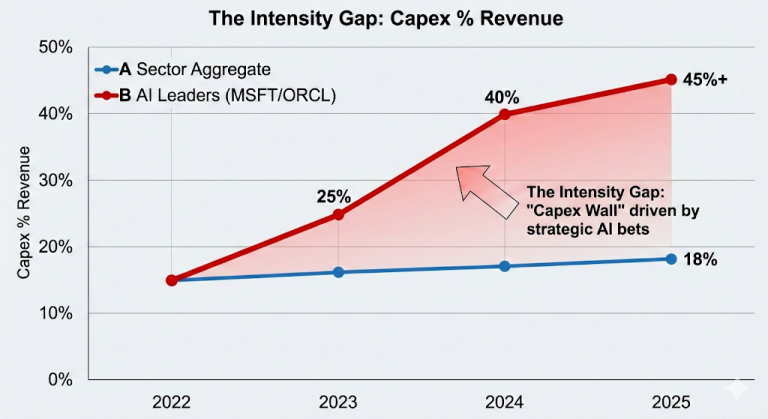
Growth Durability: Weakening the Correlation to IT Spending Cycles For decades, Systems Software revenue moved in lockstep with IT hardware budgets and PC shipments. In 2025, two powerful forces have weakened this correlation, creating a revenue floor even during macroeconomic headwinds. First, the transition to Zero Trust architecture has converted cybersecurity from a discretionary insurance policy into mandatory infrastructure; for the modern enterprise, cutting security spend is operationally destabilizing. Second, the AI CapEx supercycle driven by hyperscalers is forcing a downstream re-platforming of the enterprise stack. This is not a cyclical refresh but a multi-year secular migration with upgrade waves for data structures and operating environments. Historical trends and consensus estimates suggest Systems Software revenue growth could exceed broader S&P 500 Information Technology growth by 200–300 basis points annually through the forecast period.
The Margin Path: Shifting from Gross Margin Uplift to S&M Leverage The investment community must update its margin frameworks. For the past decade, the primary lever for profitability was the transition from on-premise delivery to SaaS, which systematically lifted Gross Margins. That trade is largely complete, and a new dynamic has emerged. Generative AI workloads are inherently compute-intensive, introducing structural “inference costs.” Projections indicate these costs may stabilize Gross Margins in the 75–78% range, preventing a return to the 85%+ levels seen in the previous pure-play SaaS era.
Future margin expansion will therefore not come from lower Cost of Goods Sold (COGS), but from aggressive Sales & Marketing (S&M) leverage. This is the financial argument for “platformization.” By consolidating disparate point solutions onto a single unified platform—such as Palo Alto Networks replacing five niche security vendors—market leaders can drive massive cross-sell revenue with minimal incremental Customer Acquisition Cost (CAC). Analysts should model flat Gross Margins moving forward, but project significant operating margin expansion as “Sales Efficiency” (the Magic Number) improves across the platform leaders.
Valuation Regime: The Platform Premium Valuations in the sector are bifurcating based on “Platform” versus “Point Solution” status. In the current market regime, premium EV/Sales multiples (8x–12x) are assigned to platforms like ServiceNow and CrowdStrike, while legacy point solutions compress to under 4x. The platform premium is a function of NRR-driven Lifetime Value (LTV) and the ‘one-to-many’ cross-sell economics that depress marginal CAC. Conversely, point solutions are priced for terminal value risk. Given the high levels of Stock-Based Compensation (SBC) in the sector, analytic frameworks often suggest avoiding sole reliance on GAAP P/E ratios. Instead, EV/Free Cash Flow—adjusted for the dilution impact of SBC—remains the most honest metric for assessing true economic yield.
Falsification Criteria: Risks to the Thesis
While our outlook is positive, three specific indicators would force a reassessment of our Overweight thesis.
Evidence of Commoditization The primary risk to pricing power is the “good enough” trap. If Chief Information Officers determine that bundled security offerings from hyperscalers are sufficient to replace best-of-breed providers, the independent security sector will face rapid commoditization. The critical signal to watch is Gross Revenue Retention (GRR). While leaders currently maintain GRR >90%, a degradation below this threshold for names like CrowdStrike or Zscaler would signal that customers are actively churning off the platform, invalidating the moat argument.
AI Deflation and Seat-Count Compression Systems Software pricing models are often per-seat or per-user, particularly in ITSM and productivity layers. A potential deflationary spiral exists if AI Copilots significantly increase IT administrator productivity, allowing companies to reduce their total headcount. If the price uplift from AI features (typically +30%) fails to offset a potential 40-50% volume decline in seats, the sector will face revenue headwinds despite technological adoption. Decelerating Net Revenue Retention (NRR) in the face of rising list prices would be the leading indicator of this dynamic.
CapEx Indigestion The current valuation multiples assume a sustained build-out of cloud capacity. If “ROI anxiety” causes corporate boards to pause cloud migrations or if hyperscaler growth decelerates sequentially for multiple quarters, the downstream demand for Systems Software—which runs on that cloud capacity—will freeze. This “air pocket” in demand would likely compress multiples across the board, regardless of individual company quality.
Universe Snapshot: The “Magnificent Systems”
| Company | Ticker | Role in Portfolio | Primary Driver | Key KPI to Watch |
| Microsoft | MSFT | Core Anchor | Cloud & AI Infrastructure | Azure Consumption Growth |
| Oracle | ORCL | Value/Transition | Database Migration to OCI | Cloud Services Mix & OCI Growth |
| Palo Alto | PANW | Security Growth | Network & Cloud Security Consolidation | Next-Gen Security (NGS) ARR |
| CrowdStrike | CRWD | Security Alpha | Endpoint & Identity Protection | Module Adoption (5+ Modules) |
| ServiceNow | NOW | Ops Compounder | IT & Workflow Automation | Subscription Revenue Growth >20% |
| Fortinet | FTNT | Cyclical/Value | Secure Networking (Firewall + SASE) | Product vs. Service Revenue Mix |
Section 3: Industry Drivers and Secular Trends
Cloud Migration and Hybrid Infrastructure
The Trend: From Capital Expenditure to Consumption The migration of systems workloads—databases, IT operations, and security control planes—from on-premise data centers to public and hybrid cloud environments is the foundational driver of the sector. While this trend is well-understood directionally, the current phase involves the movement of “heavy” mission-critical systems (e.g., Oracle databases, Windows Server estates) that were previously considered too sticky to move. This shift is accelerating due to the necessity of placing data adjacent to cloud-based AI compute resources.
The Three Investable Micro-Mechanisms
To model this trend accurately, analysts must decompose “cloud migration” into three distinct drivers that impact constituents differently:
- Installed-Base Cloud Penetration: For incumbents like Oracle and Microsoft, the primary variable is not “if” migration happens, but the pace at which the legacy installed base moves.
- Triangulation Strategy: Do not rely solely on headline cloud revenue. Triangulate penetration by comparing “Cloud Services” growth against the decline in “License Support” revenue. A bullish signal is when cloud growth accelerates while license support remains flat (additive), rather than declining 1:1 (cannibalistic). Watch for disclosures on “Cloud Usage” or “Consumption Revenue” in earnings calls to gauge actual utility versus shelfware.
- Hybrid Permanence: Hybrid infrastructure is not a temporary waypoint; it is a durable architecture driven by data sovereignty, latency requirements, and legacy application constraints.
- Investment Implication: This permanence supports long-term demand for “orchestration layers”—systems that manage policy, identity, and data replication across disparate environments. This is a structural tailwind for ServiceNow (ITSM across hybrid estates) and Palo Alto Networks (consistent security policy for on-prem firewalls and cloud containers).
- FinOps and Cost Governance: As workloads shift to variable consumption models, customers face “bill shock.” This drives demand for cost governance and observability tools.
- Beneficiaries: Platforms that integrate financial operations (FinOps) into their core offering gain stickiness. This reinforces the value proposition of broad control planes over niche monitoring tools.
Financial Line Item Bridge: RPO Mix & Contract Length
As workloads shift to cloud consumption, the revenue recognition model changes fundamentally. Analysts must adjust their models to account for the transition from upfront license recognition (ASC 606 “point-in-time”) to ratable subscription recognition (“over-time”).
- Watch RPO (Remaining Performance Obligations): As upfront license revenue disappears, GAAP revenue growth may artificially decelerate during the transition. The “truth” metric becomes RPO, which captures the total value of committed future contracts. A healthy cloud transition is characterized by RPO growth consistently outpacing Revenue growth (e.g., RPO growing at 25% while Revenue grows at 18%).
- Billings Duration: Cloud consumption contracts often have shorter commit durations (1-3 years) compared to perpetual license maintenance tails. This may shorten the average contract length but increases the velocity of renewals and upsell opportunities.
The Hyperscaler Dynamic: Distribution vs. Margin Pressure
The relationship between Systems Software vendors and the major hyperscalers (AWS, Microsoft Azure, Google Cloud) is a “double-edged sword.”
- The Tailwind (Distribution): Hyperscaler Marketplaces have become the new channel. By listing on the Azure or AWS Marketplace, vendors like CrowdStrike and Palo Alto Networks can tap into a client’s committed cloud spend (EDP/MACC), dramatically shortening sales cycles and lowering Customer Acquisition Cost (CAC).
- The Risk (Gross Margin Compression): This distribution comes at a cost. “Listing fees” paid to hyperscalers act as a permanent tax on revenue. Based on 2024/2025 schedules, these fees are typically ~1.5%–3% on private offers and ~3% on public SaaS subscriptions, with modest regional uplifts.
- Accounting Note: Analysts must verify where these fees sit in the P&L. If booked as a commission in Cost of Goods Sold (COGS), it compresses Gross Margins by low-hundreds of basis points depending on channel mix. If netted against Revenue, it slows top-line growth but preserves GM%.
The Cybersecurity Imperative (Zero Trust)
The Trend: Architecture as an Economic Moat Security has shifted from a perimeter-based “castle and moat” model to a “Zero Trust” architecture, where identity is the new perimeter. This is not just a technical nuance; it is an economic forcing function. Zero Trust requires deep integration between the endpoint (device), the network, and the identity provider. This technical requirement renders “best-of-breed” point solutions operationally inefficient for the mass market, forcing CISOs to consolidate onto integrated platforms.
The Zero Trust Taxonomy: Where Wallet Share Moves
To understand the competitive arena, analysts should map revenue streams to these four sub-segments:
- Identity-First Security: The core control plane. Microsoft (Entra ID) and CrowdStrike (Identity Protection) compete here to be the authoritative source of user verification.
- CNAPP (Cloud Native Application Protection Platform): Securing the “build” pipeline and the “run” environment in the cloud. This is the primary battleground between Palo Alto Networks (Prisma Cloud) and CrowdStrike (Falcon Cloud).
- SASE (Secure Access Service Edge): The convergence of networking (SD-WAN) and security (SSE). Palo Alto Networks and Fortinet are structurally advantaged here due to their network hardware heritage.
- XDR & SOC Automation: The analytics layer that ingests telemetry to detect threats. This drives high-margin data ingestion revenue for platform vendors.
The Procurement Physics of Platformization
“Platformization” is often dismissed as marketing jargon, but it represents a tangible change in procurement physics.
- Vendor Sprawl Cost: Managing 50+ security vendors creates integration debt and “alert fatigue.”
- The Economic Argument: CISOs are actively consolidating spend to reduce overhead. A platform vendor (e.g., Palo Alto Networks) can offer “more security for flat spend” by replacing five niche vendors. This increases the platform’s Sales Efficiency (lower CAC for cross-sell) while increasing the customer’s switching costs.
- Caveat: While the economic gravity favors platforms, best-of-breed solutions persist in regulated verticals or where performance demands are exceptional (e.g., high-frequency trading networks requiring ultra-low latency).
Financial Line Item Bridge: Module Attach Rate & NRR
The shift to Zero Trust directly correlates to Net Revenue Retention (NRR).
- The Mechanism: In a point-solution world, a vendor sells one product and fights for renewal. In a Zero Trust platform, the initial “land” (e.g., Endpoint Detection) creates the data gravity required to sell the next module (e.g., Identity Protection).
- Modeling Input: Analysts should scrutinize the “Module Attach Rate.” For example, CrowdStrike discloses the percentage of customers with 5+, 6+, or 7+ modules.
- The “Immaterial Churn” Rule: A rising attach rate is a leading indicator of durability. If a customer adopts 5+ modules, the technical pain of ripping out the platform becomes distinctively high, rendering churn risk immaterial for that cohort.
Artificial Intelligence and Automation (GenAI)
The Trend: Re-platforming for Deterministic Outcomes Generative AI is driving demand for autonomous database management (e.g., Oracle Autonomous Database) and “self-healing” IT systems (e.g., ServiceNow Now Assist). The investment thesis here is not just about AI “writing code,” but about AI agents managing the infrastructure itself—patching servers, tuning database queries, and remediating security alerts without human intervention.
Segmentation: Two Distinct Economic Models
Not all GenAI revenue is created equal. Analysts should distinguish between two monetization models:
- Embedded AI (The “Copilot” Model): AI features are sold as a per-seat uplift (e.g., Microsoft 365 Copilot at $30/user/month). This drives ARPU expansion but is capped by headcount. Note that pricing packaging is volatile; expect bundling of these features into core “Pro” or “E5” tiers over time.
- Metered & Outcome-Based AI (The “Agentic” Model): AI is sold based on consumption (e.g., credits per autonomous resolution or ticket closed). This model is uncapped and scales with workload intensity, offering higher long-term optionality.
The Hidden Moat: Data-Layer Defensibility
The market often misses the data advantage. Systems Software vendors possess privileged access to enterprise telemetry—security event streams, IT tickets, database query logs—that external LLMs cannot access. This proprietary data allows vendors to “ground” their models, reducing hallucinations and increasing the accuracy of automation. This data advantage reinforces the control-plane moat against generic AI wrappers.
Financial Line Item Bridge: Price Uplift vs. COGS Pressure
GenAI introduces a complex new variable to the P&L: Inference Costs.
- The Pricing Power (ARPU): Vendors are successfully monetizing AI features via aggressive pricing tiers. This drives immediate ARPU expansion.
- The COGS Shock: Unlike traditional SaaS software, where the marginal cost of serving the next customer is near zero, GenAI has a material marginal cost. Every AI query requires expensive GPU compute.
- Modeling Recipe:
- Look For: Disclosures on “AI SKU Attach” rates and qualitative commentary on “GPU/hosting costs” in the COGS section of the 10-K/10-Q.
- Margin Guidance: We expect Gross Margins for AI-exposed platforms to structurally settle in the 75-78% range (down from 80%+) due to this inference tax. Profitability will be defended through S&M leverage rather than COGS efficiency.
Summary Bridge Table: Modeling the Drivers
| Driver | What Changes Economically | KPI Bridge to Watch | Modeling Implication |
| Cloud Migration & Hybrid | License → Ratable consumption; Shorter commit cycles; Marketplace distribution fees | RPO Growth vs. Revenue; Cloud Revenue Mix; Marketplace Revenue Share | Expect GAAP revenue “lag” (model Bookings/RPO leading); Marketplace distribution fees (~1.5-3% on private offers; ~3% on public SaaS). |
| Zero Trust Consolidation | Point products → Platforms; Data gravity raises switching costs | Module Attach (5+/6+); NRR > 110%; GRR > 90% | Rising attach predicts durable NRR and immaterial churn; supports “Platform Premium” multiple. |
| GenAI Automation | ARPU uplift via new SKUs; New variable inference COGS | AI SKU Attach Rates; ARPU Trend; Gross Margin Deltas | Model explicit price uplift (+20-30% on AI SKUs) offset by inference costs; Expect mid-70s GM stability for AI-heavy platforms. |
Section 4: Business Models and Unit Economics
4.1 The Shift to Recurring Revenue (ARR)
The Mechanics of Subscription and Consumption
The defining characteristic of the Systems Software sector in 2025 is the decoupling of revenue recognition from cash collection. In the legacy on-premise era, a database license sale resulted in an immediate spike in Revenue, Billings, and Free Cash Flow (FCF). Today, broadly adopted models—Subscription (SaaS) and Consumption (Cloud)—smooth GAAP revenue while creating divergence in cash flows.
Analysts must distinctively track four interlinked metrics to gauge true business momentum:
- Annual Recurring Revenue (ARR): The annualized value of active contracts. This is the “North Star” for operational velocity but is a non-GAAP metric. For consumption models (e.g., Snowflake; other consumption models), ARR is often calculated as the last month’s consumption × 12, which creates volatility based on usage patterns.
- Remaining Performance Obligations (RPO): The total future revenue contractually committed but not yet recognized. This includes both Deferred Revenue (invoiced) and Backlog (unbilled future periods).
- Caveat: Under ASC 606, RPO may exclude wholly cancellable contracts with no substantive penalty, so it is not always identical to “bookings.”
- Modeling Tip: Focus on cRPO (Current RPO), which converts to revenue within 12 months, to forecast near-term GAAP revenue.
- Billings: Calculated as Revenue + Change in Deferred Revenue. This proxies the cash invoice volume.
- Caveat: This is a directional indicator, not an accounting identity; it can be distorted by FX fluctuations, M&A, and usage billed in arrears.
- GAAP Revenue: Recognized ratably (subscription) or based on usage (consumption). Due to the waterfall nature of SaaS, GAAP revenue lags ARR growth during acceleration and cushions decline during deceleration.
Illustrative Cohort Waterfall: The Power of NRR
To understand why Systems Software valuations often appear high relative to current earnings, one must model the compounding behavior of a single customer cohort.
Consider a “Land and Expand” model where a platform vendor (e.g., CrowdStrike) lands a cohort with $100 million in ARR.
- Gross Retention: We assume 90% Gross Revenue Retention (GRR), meaning 10% of ARR churns annually.
- Expansion: We assume the retained customers expand spend by 25% through module adoption (e.g., adding Identity Protection to Endpoint Security).
- Net Effect: This results in a 112.5% Net Revenue Retention (NRR) rate.
Even with zero new customer acquisition after Year 0, the revenue from this single cohort grows approximately 80% over five years. This “negative churn” is the fundamental driver of Lifetime Value (LTV) in the sector.
Table 4.1: Illustrative SaaS Cohort Evolution ($M)
| Metric | Year 0 | Year 1 | Year 2 | Year 3 | Year 4 | Year 5 |
| Starting Cohort ARR | $100.0 | $112.5 | $126.6 | $142.4 | $160.2 | $180.2 |
| (-) Churn (10%) | – | (10.0) | (11.3) | (12.7) | (14.2) | (16.0) |
| (+) Expansion (25% on retained) | – | +22.5 | +25.3 | +28.4 | +32.0 | +36.0 |
| Ending Cohort ARR | $100.0 | $112.5 | $126.6 | $142.4 | $160.2 | $180.2 |
| Implied NRR | – | 112.5% | 112.5% | 112.5% | 112.5% | 112.5% |
Reconciliation Example: ARR to Free Cash Flow
A common trap for generalists is misinterpreting the divergence between Profit (GAAP Net Income) and Cash (FCF). This divergence is driven by billing terms. Systems Software contracts are often billed annually upfront, creating a massive working capital benefit (customers pay before service is delivered).
Scenario: A customer signs a $120,000 annual contract on Jan 1st.
- Billings: The vendor invoices $120k immediately. Cash is collected in Q1 (assuming Net 30 terms).
- GAAP Revenue: Recognized ratably at $10k per month. Q1 Revenue is only $30k.
- Deferred Revenue: A liability of $120k is created on Jan 1, reducing by $10k/month.
- Free Cash Flow: FCF in Q1 is extraordinarily high ($120k minus expenses), while Net Income is low ($30k minus expenses).
Analysts must adjust for this “Cash Conversion Cycle.” If a company shifts from upfront annual billing to monthly consumption arrears (common in usage-based pricing), FCF will structurally drop for 12 months (the “cash trough”) even if revenue is unchanged.
Table 4.2: Financial Statement Reconciliation (Year 1 View)
| Line Item | Annual Upfront Model | Monthly Arrears Model | Delta Impact |
| Contract Value (TCV) | $120,000 | $120,000 | None |
| Year 1 GAAP Revenue | $120,000 | $120,000 | None |
| Year 1 Billings | $120,000 (Invoiced Jan 1) | $120,000 (Invoiced Monthly) | None over 12mo, huge intra-year skew |
| Year 1 Cash Inflow | $120,000 (Collected Q1) | $110,000 (Dec invoice paid Jan Year 2) | ($10,000) Cash Drag |
| Deferred Revenue Bal. | $0 (at year end) | $0 | None at year end |
| Accounts Receivable | $0 | $10,000 | Higher Working Capital drag |
4.2 Cost Structures and Operating Leverage
The Structural Shift: Hosting Costs and the “GenAI Shock”
Historically, traditional SaaS Gross Margins (GM) typically ranged from 70% to 80%, with best-in-class platforms reaching the low-80s. Cost of Goods Sold (COGS) was comprised mainly of customer support and basic cloud hosting fees.
In the Generative AI era, this equation has changed. AI features introduce Inference Costs—the computational expense of running a model (e.g., GPT-4) every time a user prompts the system. Unlike traditional code, AI is probabilistic and compute-heavy.
Unit Economics of the AI Transition (Illustrative)
- Traditional SaaS: User pays $30/mo. Hosting costs $2/mo. GM = ~93% (before support).
- AI-Enabled SaaS: User pays $30 + $10 Copilot add-on ($40 total).
- Inference Cost: The user generates 50 queries/day. At an illustrative ~$0.03 per 1k tokens (variable by model), inference costs might add $6/mo.
- New COGS: $2 (Hosting) + $6 (Inference) = $8.
- New GM: ($40 – $8) / $40 = 80%.
Forecast: We forecast that AI-exposed platforms will see Gross Margins structurally settle in the mid-70s, down from the highs of the previous era. While price uplifts (ARPU) grow the top line, the percentage profitability per unit of revenue compresses.
Shifting Sources of Leverage: From COGS to CAC
With Gross Margins capped by inference costs and hyperscaler marketplace fees (approx. 1.5%–3%), operating margin expansion must now come from Sales & Marketing (S&M) leverage.
The “Platformization” thesis relies on the mathematics of Sales Efficiency and Lifetime Value (LTV).
- Sales Efficiency Ratio: New ARR / S&M Spend.
- Magic Number: (Current Qtr Revenue – Prev Qtr Revenue) × 4 / Prev Qtr S&M Spend.
- Rule of Thumb: A Magic Number > 1.0 implies highly efficient growth (spend $1 to get $1 of recurring revenue). A number < 0.7 implies burn.
- The Leverage Mechanism: Selling a second module to an existing customer typically incurs 20–30% of the CAC required to land a new logo. As platforms like Palo Alto Networks cross-sell aggressively, their blended CAC drops, expanding Operating Margins even if Gross Margins remain flat.
4.3 S&M Efficiency and Platformization
Land and Expand Archetypes
Analysts should distinguish between three distinct “Expand” motions, as they have different implications for NRR and margin profiles:
- The Suite Bundle (Microsoft):
- Motion: Includable value. Security or AI features are bundled into E3/E5 licenses.
- Economics: Extremely high sales efficiency (near-zero marginal CAC) but often lower pricing power per module. NRR is driven by seat expansion and license tier upgrades.
- The Module Attach (CrowdStrike):
- Motion: Technical necessity. Endpoint data makes Identity protection better; Identity data makes Cloud security better.
- Economics: High NRR target (>120%). S&M acts as “Customer Success” spend. The key metric is the percentage of customers with 5+, 6+, or 7+ modules.
- The Consolidation Play (Palo Alto Networks):
- Motion: Vendor displacement. “Rip and replace” competitors by offering free usage periods to standardize on one platform.
- Economics: Short-term billings volatility (due to “free” incentives) followed by massive long-term LTV. This strategy depresses short-term Magic Numbers but maximizes long-term share of wallet.
Modeling Rules of Thumb
- Rising Attach Predicts NRR Stability: If a company reports consistently rising module attach (e.g., customers with 6+ modules grows 50% YoY), you can model NRR remaining strong for at least the next 4–6 quarters, as churn in high-attach cohorts is statistically negligible.
- S&M as a % of Revenue: For mature platforms (>$2B ARR), expect S&M expense to decline by 100–200 bps annually as the installed base grows. If S&M % stays flat while growth decelerates, the platform thesis is failing (rising CAC).
- The “Rule of 40” Adjustment: In Systems Software, value 40% growth + 0% margin higher than 10% growth + 30% margin due to the winner-take-most nature of infrastructure standards.
Key Takeaways for Analysts
- Check the Definition of ARR: Does the company include usage overages or just committed contracts? Usage-heavy ARR is more volatile.
- Scrutinize “Gross Margin” vs. “Subscription Gross Margin”: Ensure you are isolating the software margin from lower-margin professional services. Watch for creeping “Compute/Hosting” costs in the COGS footnotes—a sign of AI inefficiency.
- Valuation Hygiene: Always reconcile Free Cash Flow to Net Income. If FCF is >2x Net Income, check if it’s driven by healthy deferred revenue growth (good) or excessive Stock-Based Compensation add-backs (dilutive). Use FCF/Share (fully diluted) as the truth serum.
Section 5: Financial Analysis Framework
5.1 Key Performance Indicators (KPIs)
In the Systems Software regime, standard GAAP metrics often fail to capture the economic reality of platform business models. Analysts must prioritize four specific KPIs to assess durability and efficiency, looking beyond headline earnings to the underlying unit economics.
The Rule of 40 (House Standard: FCF Basis)
We define the Rule of 40 as the sum of Annual Revenue Growth (%) and Free Cash Flow (FCF) Margin (%). While industry definitions vary (with many generalists utilizing EBITDA margin), we strictly enforce an FCF Margin basis as our house standard for Systems Software to capture the capital intensity of GenAI compute infrastructure. This metric serves as the primary filter for “investable” quality.
In the 2025 regime, we view a score above 40% as the baseline quality bar and >50% as “Elite” status. Names sustaining these elite levels have historically earned materially higher EV/Sales multiples and have tended to outperform over multi-year horizons, though with meaningful dispersion by cycle. Conversely, a score below 30% is a “danger zone” indicator, implying the business is either burning cash to buy low-quality growth or has stalled. Analysts should calculate this manually by adding Revenue Growth to the FCF Margin derived from Operating Cash Flow minus CapEx.
Retention: Net Revenue Retention (NRR) vs. Gross Revenue Retention (GRR)
Retention metrics bifurcate into two distinct signals. Gross Revenue Retention (GRR) measures the percentage of recurring revenue retained from the existing customer base excluding upsells, effectively quantifying the “leaky bucket.” Net Revenue Retention (NRR) captures the total value of the cohort including upsells, seats, and price increases. The relationship is mathematical: NRR equals GRR multiplied by one plus the expansion rate.
For a platform leader, we expect NRR above 120% and GRR typically above 96%, indicating that customers are operationally locked in and aggressively expanding their footprint. Mature incumbents typically settle in the NRR range of 110%–115% with GRR above 94%. However, a GRR below 85% is a severe structural warning for point solutions, signaling that platform vendors are successfully displacing them. These metrics are typically found in the MD&A or quarterly earnings presentations; their absence is often a negative signal.
Security/Platform Module Attach Rate
The Module Attach Rate is defined as the percentage of subscription customers who have deployed three, four, or more distinct modules from the same vendor. This metric is the causal driver of NRR. When a customer adopts multiple modules—for instance, using CrowdStrike for Endpoint, Identity, and Cloud Security—the technical friction of switching becomes prohibitive. A “good” trend is characterized by a consistent sequential increase in the cohort using 5+ or 6+ modules. If this cohort grows from 30% to 40% year-over-year, it creates a powerful bias toward S&M leverage and margin expansion, assuming reinvestment intensity doesn’t rise.
Cloud Penetration of Installed Base (The “Triangulation” Method)
For legacy hybrid players like Oracle and Microsoft, analysts must estimate the percentage of the total installed base that has migrated to the vendor’s cloud environment (OCI/Azure). Since this figure is rarely disclosed explicitly, it requires triangulation. Analysts should compare the growth rate of “Cloud Services Revenue” against the decline rate of “License Support Revenue.” A bullish signal occurs when cloud revenue grows significantly (e.g., 30%) while license support remains flat, indicating net new spend. A bearish signal occurs when cloud growth merely mirrors license decline, suggesting cannibalization.
Summary: The Analyst’s KPI Cheat Sheet
| Metric | Definition | “Elite” Threshold (House View) | Valuation Implication |
| Rule of 40 | Rev Growth % + FCF Margin % | > 50% | Justifies premium multiples; signals disciplined allocation. |
| NRR | Revenue retained + expanded | > 120% | Supports longer high-growth runway and higher terminal value confidence. |
| GRR | Revenue retained (no expansion) | > 97% | Proxy for product quality; <90% typically compresses to low-single-digit EV/Sales. |
| Module Attach | % customers with 5+ modules | Rising QoQ | Leading indicator of future Margin Expansion (S&M leverage). |
5.2 Valuation Link (Retention → Multiple)
Investors frequently question why a high-retention platform commands a premium EV/Sales multiple while a low-retention peer growing at the same rate trades at a discount. This divergence is not driven by sentiment, but by the mechanical causal chain of unit economics.
First, a high Gross Revenue Retention (>95%) dramatically reduces the “replacement burden” on the sales team, meaning they do not have to burn resources just to refill a leaky bucket. Second, a high Net Revenue Retention (>120%) implies that the current installed base will double in revenue over approximately four years without the acquisition of a single new logo. This dynamic lowers the marginal Customer Acquisition Cost (CAC), as expanding an existing customer costs roughly $0.20–$0.30 per dollar of ARR, versus $1.00–$1.50 for a new logo. Consequently, the combination of low churn and high expansion generates a materially higher Lifetime Value (LTV). Over a 10-year DCF horizon, a business with high NRR generates significantly more Economic Free Cash Flow than a low-NRR peer, thereby warranting a massive premium in the terminal value multiple.
5.3 Free Cash Flow (FCF) Generation and SBC Adjustment
Stock-Based Compensation (SBC) creates a significant distortion in Systems Software valuation. Because talent is the primary expense, companies issue equity to preserve cash, which artificially inflates reported Operating Cash Flow (OCF) and FCF. Analysts must distinguish between Cash FCF (the reported number: OCF less CapEx) and Economic FCF (the valuation number). Cash FCF measures solvency, while Economic FCF treats SBC as a real expense that dilutes existing shareholders, answering the critical question: “What is the cash yield available to me as a shareholder?”
Practical Adjustment Methods
Two common methods to strip out this noise include. The conservative SBC Deduction Method subtracts SBC expense directly from reported Free Cash Flow (Adjusted FCF = (OCF – CapEx) – SBC Expense). This is best suited for mature companies like Microsoft or Oracle where share counts are stable. Alternatively, the Fully Diluted Denominator Method keeps the reported FCF as the numerator but divides it by the fully diluted share count, including all options, RSUs, and convertibles. This is essential for high-growth platforms like Palo Alto Networks, effectively penalizing the valuation multiple for the dilution rather than the cash flow line item.
The distortion can be extreme. Consider a security vendor with $1 billion in revenue, a reported FCF margin of 30%, and SBC as 25% of revenue. While the reported margin looks highly profitable, the Economic FCF Margin is a razor-thin 5%. If a company claims to achieve the “Rule of 40” solely due to a massive SBC add-back, analysts should discount the valuation. A healthy FCF profile must be driven by deferred revenue growth and operating efficiency, not just employee equity issuance.
Key Takeaways for Analysts
To ensure modeling integrity, analysts should rigorously triangulate cloud growth for legacy incumbents by mapping cloud revenue gains against license declines to verify net expansion. It is critical to treat the 90% Gross Revenue Retention level as a hard floor for platform leaders; dropping below this threshold breaks the platform thesis regardless of upsell velocity. Furthermore, never value a software stock on reported FCF/Sales alone without adjusting for the cost of equity compensation—use FCF/Share (Diluted) as the truth serum. Finally, model S&M expense as a function of Module Attach trends, as rising attach rates are the leading indicator of future operating leverage.
Section 6: Competitive Landscape and Moats
6.1 The Platform vs. Best-of-Breed Debate
In Systems Software, the distinction between “Platform” and “Best-of-Breed” is the primary determinant of unit economics and terminal valuation multiples. A Platform aggregates multiple distinct functionalities—such as Endpoint, Identity, and Cloud Security—onto a single data lake and control plane. A Best-of-Breed vendor specializes in one functional domain, competing primarily on feature depth. For investors, this debate is not philosophical but financial: platforms earn a valuation premium for durability and cross-sell efficiency, while best-of-breed vendors face the existential risk of commoditization as “good enough” bundles erode their pricing power.
Procurement Physics: The Economic Forcing Function
The drive toward platformization is fueled by the operational reality of the modern Chief Information Security Officer (CISO). In 2025, complex enterprises frequently manage dozens of security tools, often exceeding 50 distinct vendors in large environments. This fragmentation creates a “vendor sprawl tax” that manifests in three specific ways: integration debt, high administrative overhead, and alert fatigue. Every point solution requires a dedicated API integration and a separate renewal cycle, creating operational friction that does not scale.
Platform vendors like Palo Alto Networks and CrowdStrike exploit this friction to drive financial outcomes. By consolidating disparate tools onto a single agent, they offer a compelling economic proposition: “more security for flat spend.” This consolidation argument creates structural Sales & Marketing (S&M) leverage, as displacing five niche vendors with one large contract significantly reduces the blended Customer Acquisition Cost (CAC). Furthermore, the technical integration of modules creates a data gravity that supports NRR durability. Once a customer adopts five or more modules, the platform becomes the system of record for security telemetry, making the operational cost of ripping it out distinctively higher than swapping a standalone antivirus tool.
Market Misconceptions: When Best-of-Breed Still Wins
Investors often over-extrapolate the platform thesis, assuming a “winner-take-all” dynamic that eliminates all point solutions. However, Best-of-Breed vendors retain pricing power in specific niches where the “good enough” capability of a platform is insufficient. Regulated verticals requiring physical isolation or sovereign stacks—such as classified government networks—often reject cloud-native platforms in favor of specialized on-premise tools. Similarly, ultra-low-latency environments like high-frequency trading networks prioritize microsecond performance over integration convenience. While these exceptions define the boundary where platform pricing power fades, they represent a minority of the Total Addressable Market (TAM) and do not invalidate the broader consolidation thesis for the Global 2000.
6.2 Channel Power and Ecosystems (“Partner Flywheel”)
In Systems Software, the channel is not merely a distribution route; it is a defensive moat. A dominant partner ecosystem creates a flywheel effect where broad adoption generates telemetry data, which improves platform efficacy, subsequently attracting more partners and customers.
The Microsoft Partner Flywheel
Microsoft (MSFT) possesses the most formidable channel moat in the sector, built on a unique “co-sell” motion that entrench its infrastructure deeply into enterprise delivery. Microsoft incentivizes its vast network of Managed Service Providers (MSPs) and System Integrators (GSIs) to bundle Azure, Windows, and Entra ID, allowing partners to earn margin on the entire stack. Crucially, the “burn down” mechanism allows enterprise customers with committed Azure spend (MACC) to use those committed dollars to purchase Microsoft security products. This effectively reduces the perceived marginal cost of adoption to near zero for the CIO, creating a massive barrier to entry for standalone vendors trying to compete on price.
Security Marketplaces and Ecosystem Moats
Leaders like Palo Alto Networks and CrowdStrike are replicating this ecosystem model via their own marketplaces (e.g., Cortex Marketplace, CrowdStrike Store). By allowing third-party vendors to pipe data into their platforms, these companies position themselves as the operating system for security. This creates an integration flywheel: if a customer builds their entire Incident Response (IR) workflow on top of CrowdStrike’s data lake, replacing the underlying endpoint sensor becomes operationally impossible without breaking the entire Security Operations Center (SOC). Investors should monitor the breadth of third-party integrations and the mix of marketplace-transacted deals; a rising trend here indicates the platform is transitioning from a tool into an industry standard.
Moat Translation: Valuation Implications
| Moat Source | Archetype | Valuation Implication |
| Switching Costs | Platform (CRWD, NOW) | Premium Multiple: High NRR (>120%) and low churn justify high-single to low-double digit EV/Sales due to LTV certainty. |
| Channel Control | Incumbent (MSFT) | Durability: Deep partner entrenchment protects the “GRR Floor” (~95%) even during product cycles. |
| Feature Depth | Best-of-Breed (Niche) | Discount: Pricing power is capped by platform commoditization risk; trades at <5x Sales unless growth is hyper-fast. |
| Data Gravity | AI-Native Platform | Terminal Value: Proprietary telemetry trains better models, creating a widening gap vs. generic competitors. |
Key Takeaways for Analysts
To accurately forecast revenue durability, analysts must look beyond headline growth to the underlying indicators of platform health. Specifically, track Module Attach Rates—for platforms like CrowdStrike, the percentage of customers with 5+ modules is the single best predictor of future NRR stability. Monitor the Partner and Marketplace Mix in earnings commentary; a rising mix of deals closed via partners or marketplaces suggests the flywheel is working, which should lower direct sales costs over time. Finally, listen for Displacement Signals; if a platform vendor explicitly cites replacing a legacy SIEM or firewall incumbent, it signals both TAM expansion for the platform and terminal value risk for the displaced legacy provider.
Section 7: Regulatory and Geopolitical Risks
7.1 Antitrust and Competition
In the Systems Software sector, antitrust risk is not evenly distributed; it is structurally concentrated in the mega-cap “aggregators” that control the operating system and productivity layers. For mid-cap security and operations vendors, regulatory scrutiny on aggregators often acts as a tailwind by forcing open ecosystems.
The Scrutiny on Aggregators: Microsoft under the Microscope
Microsoft (MSFT) faces persistent regulatory pressure regarding its bundling practices, with the European Commission’s investigation into the tying of Teams with Office 365 serving as a critical precedent. The Commission’s acceptance of Microsoft’s commitments in late 2025 to unbundle Teams establishes a roadmap for future behavioral remedies across the stack. Regulators are increasingly focused on this dynamic as a live risk vector, scrutinizing whether Microsoft leverages its dominance in productivity (Office) and cloud (Azure) to foreclose competition in adjacent markets like endpoint security and identity management.
The core risk centers on a potential forced “de-coupling” of security SKUs, such as Defender and Entra, from the ubiquitous E3/E5 license bundles. If Microsoft is compelled to sell security as a standalone line item rather than a “free” inclusion, its pricing advantage erodes, leveling the playing field for best-of-breed competitors like CrowdStrike. Furthermore, scrutiny targets potential self-preferencing within the Windows operating system or Azure marketplace, specifically whether first-party tools receive privileged access or lower friction compared to third-party alternatives.
Investable Translation: Modeling the Break-up of the Bundle
Analysts should model antitrust risk not as a binary “break-up” event, but as a quantifiable friction on Sales Efficiency. For Microsoft, a behavioral remedy restricting bundling would materially increase the Customer Acquisition Cost (CAC) for its security products, as they would need to be sold on standalone merit rather than contract inertia. Conversely, for competitors like CrowdStrike and Okta, any regulatory action that adds friction to Microsoft’s bundling motion acts as a subsidy, effectively lowering their CAC by removing the “it’s already included” objection from the CISO’s decision matrix.
7.2 Procurement Cyclicality & Federal Spending
Government Exposure: The FedRAMP Moat
U.S. Federal demand represents a critical, non-correlated revenue stream for Systems Software, often acting as a ballast during commercial downturns. Unlike commercial budgets that may pause during a recession, federal cyber budgets are driven by mandates, such as Executive Order 14028 requiring Zero Trust adoption. Palo Alto Networks and CrowdStrike have capitalized on this by securing specific “GovCloud” instances authorized at FedRAMP High or DoD Impact Level 5 (IL5). This certification functions as a formidable barrier to entry; achieving FedRAMP High authorization is a multi-year process that often costs from high-six figures into the low-millions, creating a defensive moat around government revenue. Similarly, ServiceNow is deeply entrenched in the public sector, managing the logistics of agency operations via sticky, multi-year contracts.
Procurement Cyclicality: The “Continuing Resolution” Risk
While federal demand is secular, the timing is highly political and can introduce billings volatility. When Congress fails to pass a budget and operates under a Continuing Resolution (CR), agencies are legally restricted from initiating “new starts” or new programs, limiting them to renewing existing contracts. This dynamic can push a forecasted Q3 “Net New ARR” deal into future quarters. Analysts must adjust quarterly billings expectations during election years or periods of legislative gridlock to account for these delays, even if the long-term pipeline remains intact.
Data Sovereignty: The GDPR and Localization Headwind
European Union regulations, including GDPR and the EU Data Boundary program, are forcing vendors to localize data processing, creating a structural headwind for margins. Vendors like Oracle and Microsoft must deploy “Sovereign Cloud” regions—such as Azure Germany or OCI EU Sovereign Cloud—where data never leaves the jurisdiction. This fragmentation forces the duplication of infrastructure; instead of serving all of EMEA from a centralized hub, vendors must stand up redundant compute capacity across multiple countries.
We estimate this structural inefficiency creates a permanent drag on Gross Margins for international revenue, likely in the low-hundreds of basis points compared to a unified global architecture. Additionally, emerging regulations like the EU Data Act, which mandates cloud switching capabilities and data portability, present a longer-term tail risk to the “lock-in” economics that underpin high retention rates for cloud platforms.
7.3 Disclosure Model Risk: SEC Cyber Incident Reporting
The SEC’s new cybersecurity disclosure rules, specifically Item 1.05 of Form 8-K, have fundamentally changed the equity risk profile for security vendors. Public companies must now disclose “material” cybersecurity incidents within four business days of determination, forcing rapid transparency that can trigger immediate market reactions.
The New Volatility Regime
This rule creates a new form of headline risk where a disclosed breach triggers algorithmic selling pressure before the technical root cause is understood. While history suggests the reputational half-life of a breach is shorter than the economic impact, the mandatory disclosure creates a specific “news cycle” risk. If a vendor files an 8-K regarding a compromise, analysts must immediately assess the risk of “churn contagion,” where customers pause renewals to wait for the post-mortem.
To monitor this effectively, analysts should apply a strict “materiality” filter. Do not overreact to every security blog post; focus on the official 8-K filing. If a company files under Item 1.05, management has made a legal determination that the event is material to the shareholder. The true investment risk is rarely the immediate fine or remediation cost, but rather the degradation of Gross Revenue Retention (GRR) in the subsequent two quarters as the sales team pivots from offense to defense.
Summary of Regulatory & Geopolitical Watch Items
| Risk Bucket | Primary Exposure | Transmission Channel | What to Watch |
| Antitrust (Bundling) | Microsoft (Negative)CRWD/OKTA (Positive) | CAC / MarginsUnbundling increases MSFT CAC; lowers competitor CAC. | EU Commission probes into “security tying”; changes to E5 licensing terms. |
| Federal Spending | NOW, PANW, CRWD | Billings VolatilityCRs delay “New Start” awards; FedRAMP creates a moat. | Federal budget passage vs. CR status; “FedRAMP High” authorizations. |
| Data Sovereignty | ORCL, MSFT | COGS / Gross MarginLocalized infrastructure is less efficient than global scale. | Commentary on “Sovereign Cloud” build-outs; CapEx spikes in EU regions. |
| SEC Disclosure | All Security Vendors | Stock VolatilityMandatory 4-day reporting creates algorithmic sell-offs. | SEC Form 8-K filings under Item 1.05; post-incident GRR trends. |
Key Takeaways for Analysts
Analysts should view FedRAMP High authorization not just as a compliance checkbox, but as a leading indicator of federal pipeline durability. On the antitrust front, monitor European regulatory dockets as a leading indicator for US DOJ action; EU remedies often force global changes in Microsoft’s licensing bundle. Finally, regarding SEC disclosures, treat any Item 1.05 filing by a security vendor as a “valuation event”—not necessarily for the immediate fine, but for the potential 12-month drag on Sales Efficiency as the sales team pivots to defense.
Section 8: Valuation Methodologies
8.1 Multiple Selection Logic Tree
In Systems Software, valuation is not a matter of preference; it is a function of the business model’s lifecycle stage. A common error among generalist investors is applying a Price-to-Earnings (P/E) ratio to a high-growth platform or applying a Revenue multiple to a mature, low-margin incumbent. To avoid this, analysts should apply a sequential decision framework that first assesses growth, then profitability, and finally durability.
Step 1: Determine the Growth Tier (The Primary Anchor)
The first branch of the decision tree asks whether the company is in a High-Growth phase where Sales & Marketing (S&M) investment actively suppresses current profitability. For platforms growing Revenue or ARR above 20%, such as CrowdStrike, ServiceNow, and Palo Alto Networks, the primary valuation anchor is EV/Sales (Enterprise Value to Next Twelve Months Revenue). While internal deal models often anchor on EV/ARR, public markets translate this to EV/Sales; note that this mapping is cleanest when ARR is predominantly committed subscription revenue and becomes noisier for usage-heavy or hardware-mixed models. In this phase, earnings are often negligible or negative due to aggressive customer acquisition, so the market pays for the future cash flow generating power of the installed base. High-quality platforms in this tier typically trade in the high-single to mid-teens EV/Sales range, with elite, scarcity platforms sustaining higher teens or even 20x in risk-on windows, though these premiums are highly sensitive to interest rate regimes.
However, this transition is not binary. In practice, there is a middle regime where growth is still high (>20%), yet margins and FCF are already meaningful (e.g., Palo Alto Networks in certain cycles). In this zone, EV/Sales remains the primary anchor, but EV/FCF becomes a credible “shadow multiple” that starts to influence valuation ahead of the formal handoff. This is often the real warning signal for potential multiple compression.
Conversely, for Mature or profitability-focused companies growing below 15%, such as Microsoft, Oracle, and Check Point (an adjacent mature security incumbent), the primary anchor shifts to EV/FCF (Enterprise Value to Free Cash Flow) or P/E. Here, the market values the current cash yield and the sustainability of margins. These names typically trade on FCF yields of roughly 2%–4% in 2025, with Microsoft at the low end (~2%) and Oracle higher, implying an EV/FCF range spanning 25x to 55x depending on the name, point in the cycle, and AI CapEx intensity.
Step 2: Apply the Durability Adjustment (The Premium/Discount)
Once the primary multiple is selected, the analyst must adjust for durability, pricing in the qualitative moats and retention metrics discussed in previous sections. A Platform Premium is warranted for companies with high NRR (>120%) and rising module attach trends. For example, CrowdStrike commands a higher EV/Sales multiple than a single-product peer growing at the same rate because its revenue is “stickier” and expands automatically via cross-sell. It is worth noting that platforms with higher NRR also carry longer-duration cash flows, making the premium more rate-sensitive; in risk-off rate spikes, even “elite” platforms can mean-revert to the mid-single-digit EV/Sales range. On the flip side, vendors with low GRR (<90%) or high displacement risk face a Point Solution Discount, trading at significantly compressed multiples to reflect terminal value risk.
Summary Table: Valuation Logic Matrix
| Company Archetype | Primary Multiple | Secondary Check | When it Dominates | Key KPI for Premium/Discount |
| High-Growth Platform(e.g., CRWD, NOW) | EV / NTM Sales | Rule of 40 | Growth > 20% and profits suppressed by S&M | NRR > 120% (Justifies higher multiple via LTV) |
| Mature Incumbent (e.g., MSFT, ORCL) | EV / FCF (Normalized) | P/E (Non-GAAP) | Growth < 15% with stable FCF conversion | Cloud Mix Shift (Higher cloud mix = higher multiple) |
| Hybrid / Transition (e.g., PANW, FTNT) | EV / Sales → EV / FCF | EV / Sales | Growth decelerating into mid-teens | FCF Margin (Scaling speed determines compression) |
8.2 Why EV/FCF Anchors Mature Systems
For mature Systems Software giants like Microsoft and Oracle, the Price-to-Earnings (P/E) ratio is less informativethan for other sectors. We strongly advocate for EV/FCF (Enterprise Value / Free Cash Flow) as the “source of truth” valuation anchor for four structural reasons.
First, FCF strips out accounting noise. Net Income is heavily impacted by non-cash accounting treatments, particularly the depreciation of data center assets and tax timing strategies. Free Cash Flow cuts through this noise to reveal the actual distributable cash available to shareholders. Second, it captures the “float” from deferred revenue. Systems Software business models generate massive negative working capital because customers pay upfront for annual or multi-year contracts. This cash inflow shows up in Operating Cash Flow (and thus FCF) but not in Net Income until it is recognized ratably, causing P/E to systematically undervalue companies with growing deferred revenue balances. A mature software company growing mid-single digits can often grow FCF at double digits simply due to these billings dynamics.
Third, EV/FCF handles Stock-Based Compensation (SBC) more honestly. As detailed in Section 5, SBC is a real economic cost. While GAAP P/E includes SBC as an expense, it doesn’t capture the cash tax benefits or the dilution impact dynamically. By using FCF per Share (Fully Diluted), analysts can explicitly model the denominator expansion caused by SBC, penalizing the valuation for dilution in a way that a simple aggregate P/E multiple often obscures. Finally, this metric aligns with duration and reinvestment needs. While maintenance CapEx has historically been light, growth CapEx for cloud and AI infrastructure is now material. EV/FCF correctly forces the analyst to underwrite that reinvestment burden, distinguishing between companies that can grow efficiently versus those that must burn cash to sustain their competitive position.
Analyst Caution on Oracle: For companies in heavy transition like Oracle, trailing FCF can be mechanically meaningless due to massive working-capital swings and the recent FY25/FY26 AI CapEx surge which has temporarily overwhelmed operating cash flow. In these cases, raw screens may show negative or distorted ratios. Analysts should use EV/Normalized FCF (e.g., a 3-year average or FCF excluding transient integration noise) to derive a usable valuation signal.
Forecasting Implication: When modeling Microsoft or Oracle, analysts should not stop at EPS. Instead, build a detailed cash flow forecast that explicitly assumes an FCF margin trajectory (assessing if AI inference costs will compress margins or if S&M leverage will expand them), a reinvestment rate (determining how much CapEx is required to support the next dollar of Azure/OCI revenue), and share buybacks (using the FCF to model repurchases, which support FCF/Share growth even if the top line slows).
Key Takeaways for Analysts
Analysts must avoid mixing models; never compare CrowdStrike (valued on EV/Sales) directly to Oracle (valued on P/E) without adjusting for their lifecycle stage, as they are priced on different economics. It is crucial to watch the transition when a high-growth company decelerates below 20% growth (e.g., Palo Alto Networks in certain cycles), as the market abruptly switches from valuing Revenue to valuing FCF. This handoff is painless only if FCF margins are already scaling; otherwise, multiple compression can be severe. Remember that SBC is real; always sensitize your EV/FCF valuation for dilution, because a “cheap” 20x FCF stock might be expensive if the share count grows 3% annually. Finally, recognize the “Quality” premium: in a high-rate environment, investors pay up for NRR, meaning a 20% grower with 120% NRR is worth significantly more than a 20% grower with 100% NRR.
Section 9: Company Deep Dives (The “Magnificent” Systems)
This section applies our valuation and operational framework to the five core constituents that define the S&P 500 Systems Software investable universe. Financial data reflects actuals through the most recent reporting periods available as of October 2025, with Hypothetical Projections for Illustrative Purposes for the subsequent fiscal year. Each profile is structured to isolate the specific drivers of unit economics and valuation discussed in previous chapters.
9.1 Microsoft Corporation (MSFT)
A) Business Mix and Positioning
Microsoft operates as the sector’s “Super-Platform,” bridging the legacy PC era and the AI era through a highly integrated stack. Its revenue is derived from three segments: Intelligent Cloud (Azure hyperscale infrastructure and Server products), Productivity and Business Processes (Office 365, Dynamics, LinkedIn), and More Personal Computing (Windows OEM, Gaming). Strategically, the company is executing a “Cloud-to-Edge” convergence, leveraging its unique ability to train AI models in Azure and deploy them locally on Windows “AI PCs.” This integration creates a defensive moat that standalone cloud providers cannot replicate, effectively taxing both the compute and the productivity layer of the global economy.
B) 3-Year Financial Table (Historical + Consensus)
| Metric ($B) | FY23 (Act) | FY24 (Act) | FY25 (Act) | FY26 (Est) |
| Revenue | $211.9 | $245.1 | $281.7 | $322.5 |
| YoY Growth | 7% | 16% | 15% | 14.5% |
| Gross Margin | 69% | 70% | 70% | 69.5% |
| Operating Margin | 42% | 45% | 46% | 45.0% |
| FCF Margin | 28% | 30% | 25% | 22% |
| Net Cash/(Debt) | $47.0 | $52.0 | $45.0 | $38.0 |
Note: FY ends June 30. FCF margin compression in FY25/26 reflects the massive AI infrastructure build-out.
C) KPI Trend That Matters: Azure Growth (Constant Currency)
- Why it matters: Azure is the direct proxy for AI adoption. Unlike generic cloud compute, Azure revenue growth is now explicitly composed of “core consumption” plus “AI services” contribution (e.g., OpenAI API usage).
- Trend: After stabilizing in the 30% range during 2024, Azure growth accelerated to ~40% (CC) in Q1 FY26 (reported Oct 2025). Management commentary attributed roughly 8-10 points of this growth specifically to AI services. This re-acceleration breaks the “law of large numbers” and validates the thesis that AI infrastructure demand is currently supply-constrained rather than demand-constrained.
D) Valuation Snapshot
- Primary Anchor: EV/FCF. Given the company’s maturity and capital intensity, cash yield is the most honest metric.
- Current Multiple: ~33x EV/FCF (FY26e).
- Context: Microsoft trades at a premium to its 10-year historical median (25x) but in line with the AI platform peer group. Importantly, this multiple compresses to ~28x if analysts normalize the “investment surge” CapEx to a maintenance run-rate, suggesting the market is looking through the current investment cycle.
E) Debated Issues / Investor Fault Lines
- Capital Intensity vs. ROI Timeline:
- The Debate: Microsoft is deploying >$100 billion annually in CapEx. Bears argue that if GenAI monetization trails this spend, FCF yields will structurally collapse. Bulls argue the “If we build it, they will come” strategy is defensive against AWS.
- Resolution: Watch for Copilot seats and API consumption to become a visible, disclosed share of Intelligent Cloud gross profit by FY27.
- Copilot Seat Compression:
- The Debate: Does AI make employees so productive that enterprises eventually buy fewer Office licenses? (The “AI Deflation” risk).
- The Defense: ARPU uplift from the $30 Copilot add-on materially outweighs the potential 5-10% headcount reduction in the medium term, turning seat contraction into a net revenue positive.
9.2 Oracle Corporation (ORCL)
A) Business Mix and Positioning
Oracle has successfully scaled into a meaningful “hyperscale-adjacent” cloud provider, fundamentally flipping its revenue mix. Cloud Services & License Support now accounts for over 70% of revenue, comprised of the high-growth Oracle Cloud Infrastructure (OCI) and sticky database support, while the legacy on-premise license business manages a managed decline. OCI differentiates itself as the “AI Training Cloud,” offering superior price-performance for massive GPU clusters compared to AWS/Azure, a positioning that has won marquee contracts from AI labs like xAI and OpenAI.
B) 3-Year Financial Table (Historical + Consensus)
| Metric ($B) | FY23 (Act) | FY24 (Act) | FY25 (Act) | FY26 (Est) |
| Revenue | $50.0 | $53.0 | $57.4 | $65.1 |
| YoY Growth | 18% | 6% | 8% | 13.5% |
| Gross Margin | 73% | 71% | 71% | 72% |
| Operating Margin | 28% | 30% | 32% | 34% |
| FCF Margin | 17% | 22% | 10%* | 15% |
| Net Cash/(Debt) | $(80.0) | $(75.0) | $(85.0) | $(82.0) |
*Note: FY ends May 31. FY25/26 FCF is heavily depressed by growth CapEx for OCI data center expansion.
C) KPI Trend That Matters: Total RPO & Cloud Consumption
- Why it matters: RPO (Remaining Performance Obligations) represents the backlog of committed revenue. For Oracle, it is the best signal of future AI capacity delivery.
- Trend: Total RPO exploded to $455 Billion in Q1 FY26 (reported Sept 2025), up 359% YoY. While this figure includes long-dated cloud capacity commitments, the magnitude confirms that Oracle has pre-sold its capacity build-out. The gating variable for revenue is now conversion speed (delivery of GPUs), not customer demand.
D) Valuation Snapshot
- Primary Anchor: EV/Normalized FCF (or P/E). Trailing FCF is currently meaningless due to the massive working capital and CapEx swings associated with the AI build.
- Current Multiple: ~27x P/E (FY26e).
- Context: Oracle has re-rated significantly from its historical “value tech” multiple of 14x P/E. The market effectively prices it as a growth cloud infrastructure play, giving credit for the OCI backlog conversion before the cash flow fully arrives.
E) Debated Issues / Investor Fault Lines
- Supply Chain Constraints:
- The Risk: With massive backlog, Oracle’s revenue growth is capped by how fast they can bolt GPUs into racks. Any delay in NVIDIA shipments or power availability directly dampens the re-acceleration story.
- The “Database Trap” & Margin Structure:
- The Debate: Can Oracle migrate its mission-critical database base to OCI fast enough to offset on-premise declines? Furthermore, does the “MultiCloud” partnership (putting OCI hardware inside Azure data centers) preserve Oracle’s high software margins, or does it drift toward lower-margin colocation economics?
9.3 Palo Alto Networks (PANW)
A) Business Mix and Positioning
Palo Alto Networks is the archetype of the “Platformization” thesis, aggregating Network Security (Strata), Cloud Security (Prisma), and Security Operations (Cortex) into a unified stack. The company actively utilizes a “platformization” strategy, creating short-term billings volatility by offering fee waivers to customers who agree to consolidate multiple point products onto its platform. This financing tactic trades upfront cash for long-term annuity value and data gravity.
B) 3-Year Financial Table (Historical + Consensus)
| Metric ($B) | FY23 (Act) | FY24 (Act) | FY25 (Act) | FY26 (Est) |
| Revenue | $6.9 | $8.0 | $9.2 | $10.5 |
| YoY Growth | 25% | 16% | 15% | 14.5% |
| Gross Margin | 72% | 74% | 75% | 76% |
| Operating Margin | 24% | 27% | 29% | 31% |
| FCF Margin | 38% | 39% | 38% | 39% |
| Net Cash/(Debt) | $3.0 | $4.5 | $6.2 | $8.5 |
Note: FY ends July 31. Margins are Non-GAAP.
C) KPI Trend That Matters: Next-Gen Security (NGS) ARR
- Why it matters: This metric isolates the high-growth software business (Cloud/SASE/XDR) from the legacy hardware firewall business.
- Trend: NGS ARR grew 40% YoY to ~$4.5B in the most recent quarter. As NGS becomes the majority of the ARR mix, the company sheds its “hardware discount.” Investors should bridge the gap between this 40% ARR growth and the lower billings growth to quantify the impact of “free” period incentives.
D) Valuation Snapshot
- Primary Anchor: EV/FCF (functioning as a shadow EV/Sales check). PANW is unique for its elite FCF generation (Rule of 40 score > 50).
- Current Multiple: ~35x EV/FCF (FY26e).
- Context: While optically expensive on EV/Sales (~12x), the 39% FCF margin supports the valuation. The market pays a premium for the certainty of cash flow in a volatile macro environment, viewing PANW as the “safe haven” in cyber.
E) Debated Issues / Investor Fault Lines
- The “Freebies” Hangover:
- Bear Case: The platformization incentives (giving away product for 6-12 months) artificially depress billings. Investors fear this masks underlying demand weakness or pricing pressure.
- Bull Case: This is a temporary financing tactic to gain share. The “billings trough” of FY25 sets up a “revenue super-cycle” in FY27 as those free contracts renew at full price.
- SASE Competition:
- The Debate: Can Palo Alto defend its network dominance against cloud-native competitors like Zscaler? Evidence suggests PANW’s single-vendor SASE solution is winning in the mass market due to the operational simplicity of unified policy management.
9.4 CrowdStrike Holdings (CRWD)
A) Business Mix and Positioning
CrowdStrike is the cloud-native standard for Endpoint Security, successfully expanding into Identity and Cloud Workload Protection (CNAPP) via its Falcon platform. Unlike legacy vendors, it uses a single lightweight agent to collect data once and solve multiple problems (modules). The model is highly recurring (~94% Subscription revenue) with best-in-class Gross Revenue Retention (historically ~97–98%), signaling minimal churn.
B) 3-Year Financial Table (Historical + Consensus)
| Metric ($B) | FY23 (Act) | FY24 (Act) | FY25 (Act) | FY26 (Est) |
| Revenue | $2.24 | $3.06 | $3.95 | $4.78 |
| YoY Growth | 54% | 36% | 29% | 21% |
| Gross Margin | 76% | 78% | 78% | 79% |
| Operating Margin | 16% | 22% | 25% | 27% |
| FCF Margin | 30% | 31% | 32% | 33% |
| Net Cash/(Debt) | $2.5 | $3.4 | $4.3 | $5.5 |
Note: FY ends Jan 31. FY25 actuals represent the year ending Jan 2025. Margins are Non-GAAP.
C) KPI Trend That Matters: Module Adoption (6+ Modules)
- Why it matters: This is the measure of “platform gravity.” A customer adopting 6+ modules approaches zero churn risk due to integration depth.
- Trend: Deals with 6+ modules grew to 48% of the customer base in FY25. This rising attach rate acts as a lever for Sales Efficiency—selling the 7th module costs significantly less than landing a new logo, supporting the “Rule of 60” financial profile.
D) Valuation Snapshot
- Primary Anchor: EV/Sales.
- Current Multiple: ~14x EV/Sales (FY26e).
- Context: CrowdStrike commands a scarcity premium due to its growth-profitability combination. It trades at the top of the Systems Software cohort. However, this premium implies significant duration risk; the multiple is highly sensitive to long-term interest rates.
E) Debated Issues / Investor Fault Lines
- SMB Saturation Risk:
- The Fear: CrowdStrike has dominated the enterprise. As it moves down-market to SMBs (via “Falcon Go”), it faces price sensitivity and competition from Microsoft Defender. Can it maintain high pricing power in this segment?
- The “Platform vs. Best-of-Breed” Ceiling:
- The Debate: Can CrowdStrike win in markets where it isn’t the incumbent, like SIEM (vs. Splunk) or Cloud Security (vs. Wiz)? The bull case relies on “Falcon Next-Gen SIEM” displacing legacy log managers, opening a massive new TAM.
9.5 ServiceNow (NOW)
A) Business Mix and Positioning
ServiceNow serves as the “ERP for IT,” providing the workflow automation layer that sits above disparate systems of record. Its business is divided into Technology Workflows (ITSM/ITOM), Customer & Creator Workflows, and Employee Workflows. The strategic value lies in creating a “system of action” that unifies data without requiring a rip-and-replace of underlying Oracle/SAP databases, making it essential infrastructure for the Fortune 500.
B) 3-Year Financial Table (Historical + Consensus)
| Metric ($B) | FY22 (Act) | FY23 (Act) | FY24 (Est) | FY25 (Est) |
| Revenue | $7.2 | $9.0 | $10.9 | $13.1 |
| YoY Growth | 23% | 24% | 22% | 20.5% |
| Gross Margin | 82% | 82% | 82% | 82.5% |
| Operating Margin | 26% | 28% | 29% | 30.5% |
| FCF Margin | 30% | 30% | 31% | 31% |
| Net Cash/(Debt) | $4.0 | $5.2 | $6.5 | $8.0 |
Note: FY ends Dec 31. Consistent ~20%+ growth at scale is the defining characteristic.
C) KPI Trend That Matters: cRPO Growth & Large Deal Durability
- Why it matters: cRPO (Current Remaining Performance Obligations) is the proxy for next-12-month revenue. Large deals (ACV > $1M) signal strategic relevance.
- Trend: cRPO continues to grow at 21-23% constant currency, consistently outpacing revenue. Crucially, the number of customers with >$5M ACV grew 18% YoY in the most recent quarter, validating that large-deal demand remains durable even amidst broader procurement scrutiny.
D) Valuation Snapshot
- Primary Anchor: EV/Sales (Growth at Scale).
- Current Multiple: ~13x EV/Sales (FY25e).
- Context: NOW trades at a premium because of its unparalleled consistency. It is the “bond proxy” of software growth—rarely accelerating massively, but never missing. The Valuation is supported by elite 98%+ renewal rates.
E) Debated Issues / Investor Fault Lines
- The “Generative AI” Monetization Gap:
- The Debate: ServiceNow launched aggressive “Pro Plus” AI SKUs (e.g., text-to-workflow). Investors are watching if this drives a 2025 revenue inflection or just defends the existing price point. Management targets $500M in AI revenue for FY25.
- Total Addressable Market (TAM) Ceiling:
- The Fear: With 85% of the Fortune 500 already customers, where does the next leg of growth come from? The company must successfully sell into “Lines of Business” (HR, Customer Support) to sustain 20% growth, placing them in direct competition with Salesforce and Workday.
Cross-Company Snapshot: The Analyst’s Cheat Sheet
| Company | Growth Tier (FY26e) | Primary Multiple | KPI Anchor | Core Debate |
| MSFT | Mature / Mid-Teens | EV/FCF | Azure CC Growth | AI CapEx ROI Timing |
| ORCL | Transition | EV/Norm. FCF | Total RPO vs. Cloud Rev | Capacity Delivery vs. Demand |
| PANW | Hybrid High-Quality | EV/FCF | NGS ARR / Billings Gap | Billings Optics vs. Durable ARR |
| CRWD | High-Growth | EV/Sales | 6+ Module Attach | Premium Durability vs. SMB Risk |
| NOW | High-Growth at Scale | EV/Sales | cRPO CC Growth | AI Rev. Inflection vs. Defense |
Section 10: Conclusion and Appendix
10.1 Conclusion: The Durable Utility of the Digital Economy
The transformation of the S&P 500 Systems Software sector from a cyclical, hardware-dependent industry into a secular growth engine is now structurally complete. Over the next decade, we view this sub-industry not merely as a collection of software vendors, but as the “utility layer” of the AI economy. Just as utilities provide the indispensable infrastructure for physical commerce, Systems Software provides the non-negotiable rails—operating systems, database architectures, security control planes, and workflow automation—upon which modern generative AI applications must run. This architectural necessity creates a revenue floor for mission-critical platforms that is less correlated, though not immune, to broader IT spending cycles than in previous eras, supported by the operational imperative of Zero Trust security and the mass migration of data to the cloud.
For the institutional investor, the path to alpha in this sector requires a disciplined focus on unit economics over headline growth. The transition to recurring revenue models has decoupled cash collection from revenue recognition, making traditional GAAP metrics less informative than the underlying mechanics of Annual Recurring Revenue (ARR) and Remaining Performance Obligations (RPO). Durability is no longer a function of brand longevity but of “platform gravity,” measurable specifically through Module Attach Rates and Net Revenue Retention (NRR). Companies that successfully consolidate point solutions—replacing five vendors with one platform—generate structural Sales & Marketing leverage that defends profitability even as AI inference costs introduce new pressure on Gross Margins.
The valuation regime for 2025 and beyond will likely remain bifurcated. The market correctly assigns premium multiples to platforms that demonstrate the “Rule of 40” efficiency and high retention, viewing them as scarcity assets with compounding Lifetime Value. Conversely, point solutions facing commoditization risks will see multiples compress, regardless of their short-term growth rates. We advise analysts to anchor valuations on Economic Free Cash Flow, stripping out the noise of stock-based compensation to reveal the true cash yield available to shareholders. This approach aligns the valuation methodology with the long-duration nature of the cash flows being underwritten.
Looking ahead to the next 12 to 24 months, the primary monitoring task is to distinguish between cyclical noise and structural thesis violations. Investors should look through short-term billings volatility caused by “platformization” incentives or federal budget delays, focusing instead on the stability of Gross Revenue Retention (GRR) and the trajectory of AI consumption revenue. The thesis would face a fundamental challenge only if one of two scenarios emerges: first, if we observe widespread seat-count compression due to AI productivity gains that pricing power cannot offset; or second, if AI monetization stalls at the application layer despite sustained hyperscaler spend. If Copilot/agentic workflows do not become habitual spend, platform ROI weakens, and downstream vendors will feel the impact with a lag. Until then, Systems Software warrants a structural allocation bias, offering a unique combination of defensive recurring revenue and offensive AI optionality.
10.2 Appendix
Modeling Cheat Sheet: Where to Find the Data
This table maps critical KPIs and model inputs to their typical location in public filings for the covered universe (MSFT, ORCL, PANW, CRWD, NOW).
| Metric / Input | Typical Location in 10-K / 10-Q | Analyst Note / Calculation |
| ARR (Annual Recurring Revenue) | MD&A (Key Performance Indicators) | Often non-GAAP. For consumption models (e.g., Azure), proxy with “Annualized Consumption” if disclosed, or triangulate via Segment Revenue growth. |
| RPO / cRPO | Notes to Financial Statements (Revenue Recognition) | Focus on cRPO (Current RPO) for next-12-month visibility. Note: Under ASC 606, reported RPO may exclude cancellable contracts or “variable consideration,” so it is not always identical to bookings. |
| Deferred Revenue (Contract Liabilities) | Balance Sheet & Notes | Labeled “Contract Liabilities” under ASC 606. Split into Current (<12mo) and Non-Current. Crucial for calculating Billings. |
| Billings | Calculated (Not always explicit) | Formula: Revenue + (Ending Def. Rev – Beginning Def. Rev). Note:Adjust for M&A purchase accounting write-downs, which can artificially suppress reported billings vs. true ARR. |
| Segment / Subscription Margins | Notes (Segment Reporting) or MD&A | Critical for separating high-margin software economics (80%+) from lower-margin professional services or hardware drag. |
| Stock-Based Compensation (SBC) | Notes (Share-Based Compensation) & Income Statement | Do not just rely on the Cash Flow add-back. Check the Notes for specific expense allocation by department and for RSU grant activity to forecast dilution. |
| Free Cash Flow (Economic Adjustment) | Cash Flow Statement (Base) | Valuation Adjustment: (CFO – CapEx) – SBC Expense. This is a non-GAAP valuation metric, not a cash accounting identity. |
| Capital Expenditures | Cash Flow Statement (Investing Activities) | Look for “Additions to property and equipment.” For MSFT/ORCL, verify if “Finance Leases” are included in CapEx guidance. |
| Share Count | Income Statement / Notes (EPS) | Always use Diluted Weighted Average Shares. Check the “Treasury Stock” method note for options/RSU impact at current prices. |
| Gross Revenue Retention (GRR) | Investor Presentation / Earnings Call | Rarely in 10-K text. If not disclosed, assume it is lower than peers. <90% is a structural warning. |
| Cloud Revenue (Legacy) | Segment Reporting (Notes) | For Oracle/Microsoft, look for specific sub-segment break-outs (e.g., “Cloud Services and License Support” or “Intelligent Cloud”). |
Glossary & Financial Ratios
A consolidated reference for the specific unit-economic terms used throughout this primer.
| Term | Definition | Formula / Benchmark |
| Rule of 40 | The principle that a healthy software company’s Growth % + Profit Margin % should exceed 40%. | Rev Growth % + FCF Margin %. Benchmark:>40% is good; >50% is elite. |
| Magic Number | A proxy for Sales Efficiency: implies how much new ARR is generated for every $1 of S&M spend, derived from revenue expansion. | (Current Qtr Rev – Prev Qtr Rev) * 4 / Prev Qtr S&M Spend. Benchmark: >1.0 is efficient; <0.7 implies burn. |
| Sales Efficiency Ratio | A broader measure of efficiency comparing new booking value to sales expense. | Net New ARR / S&M Expense. Related to Magic Number but uses ARR directly. |
| CAC Payback Period | The time (in months) required to earn back the cost of acquiring a customer. | CAC / (ARPA * Gross Margin %). Analyst Note:If ARPA is not disclosed, proxy with S&M Spend / Net New ARR inverse. |
| Net Revenue Retention (NRR) | The % of recurring revenue retained from the existing customer base, including expansion. | (Starting ARR + Expansion – Contraction – Churn) / Starting ARR. Benchmark: >120% for top-tier platforms. |
| Gross Revenue Retention (GRR) | The % of recurring revenue retained from the existing customer base, excluding expansion. | (Starting ARR – Contraction – Churn) / Starting ARR. Benchmark: >90% is the floor for platform durability. |
| FCF Margin (Economic) | Free Cash Flow adjusted for the dilutive cost of stock-based compensation. | (CFO – CapEx – SBC) / Revenue. Often significantly lower than Reported FCF Margin for high-growth companies. |
| Module Attach Rate | The % of customers adopting multiple distinct products (modules) from the same vendor. | Context: Rising attach rates (e.g., customers with 5+ modules) act as a leading indicator for future NRR and margin expansion. |
| Inference Costs | The variable compute cost (COGS) associated with running a live AI model per user query. | Impact: Creates a structural drag on Gross Margins for AI-enabled products compared to traditional SaaS. |
Disclaimer: This report is strictly for informational and educational purposes and does not constitute financial advice, investment recommendations, or an offer to buy or sell any securities. The author is not a registered investment advisor and establishes no fiduciary duties to the reader. All investments involve inherent risks, including the total loss of principal; past performance is not indicative of future results. The author may hold long or short positions in the securities mentioned herein. While the data and analysis presented are believed to be accurate at the time of publication, they are not guaranteed and are subject to change without notice.