U.S. HEALTH CARE SECTOR PRIMER
The U.S. Health Care sector (GICS 35) represents one of the most critical and distinctive investment sectors in the equity market, characterized by its non-discretionary defensive nature and consistent long-term growth driven by demographic and innovation-based tailwinds.
Unlike cyclical sectors whose performance fluctuates with economic conditions, healthcare demand remains relatively inelastic—patients require medical care, prescription drugs, and health services regardless of broader economic circumstances.
This fundamental characteristic positions healthcare as a core defensive allocation in institutional portfolios, particularly during periods of economic uncertainty and market volatility.essentialfsi
The Global Industry Classification Standard (GICS), developed jointly by MSCI and S&P Dow Jones Indices in 1999, provides the framework through which the healthcare sector is defined and categorized. Within this standardized taxonomy, the healthcare sector sits as one of 11 primary sectors, further subdivided into a hierarchical structure of industry groups, industries, and sub-industries that enable precise investment analysis and portfolio construction.wikipedia
GICS Framework Breakdown: Six Industry Groups
The healthcare sector’s diversity is reflected in its six distinct industry groups, each representing fundamentally different business models, competitive dynamics, regulatory pathways, and valuation methodologies:corporatefinanceinstitute
1. Health Care Equipment & Supplies – Encompasses companies manufacturing medical devices, diagnostic equipment, and consumable supplies ranging from basic products like bandages and surgical instruments to advanced capital equipment such as MRI machines, robotic surgical systems, and implantable devices. This group includes companies like Medtronic, Abbott Laboratories, and Boston Scientific, whose revenues are driven by procedure volumes, technological innovation cycles, and capital spending patterns at healthcare facilities.corporatefinanceinstitute
2. Health Care Providers & Services – Includes operators of healthcare facilities (hospitals, outpatient clinics, dialysis centers), physician practice management companies, laboratory services, and healthcare staffing organizations. Major constituents include HCA Healthcare, Laboratory Corporation of America (LabCorp), and DaVita, with business models centered on patient volumes, reimbursement rates, and operational efficiency metrics.corporatefinanceinstitute
3. Health Care Technology – Comprises companies engaged in healthcare information technology, electronic medical records systems, data analytics platforms, and digital health solutions. This growing segment includes firms like Cerner (now part of Oracle Health) and Veeva Systems, driven by the digitization of healthcare delivery and the shift toward value-based care models.corporatefinanceinstitute
4. Biotechnology – Features companies focused on developing biologic therapies using living organisms or cellular processes, including monoclonal antibodies, gene therapies, cell therapies, and vaccines. Companies such as Amgen, Gilead Sciences, and Vertex Pharmaceuticals exemplify this innovation-intensive segment characterized by binary clinical trial outcomes and platform technology approaches.corporatefinanceinstitute
5. Pharmaceuticals – Represents companies discovering, developing, manufacturing, and marketing small molecule drugs and branded pharmaceutical products. Large-cap diversified pharmaceutical companies like Pfizer, Johnson & Johnson, Merck, and Bristol-Myers Squibb dominate this group, with business models built around blockbuster drugs, diversified therapeutic portfolios, and robust commercial infrastructures.corporatefinanceinstitute
6. Life Sciences Tools & Services – Includes providers of instruments, consumables, software, and services used by pharmaceutical, biotechnology, and academic researchers in drug discovery and development. Companies like Thermo Fisher Scientific, Danaher, and Illumina serve as “picks and shovels” providers to the broader life sciences ecosystem, often featuring high-margin recurring revenue models.corporatefinanceinstitute
Sector Weight and Market Significance
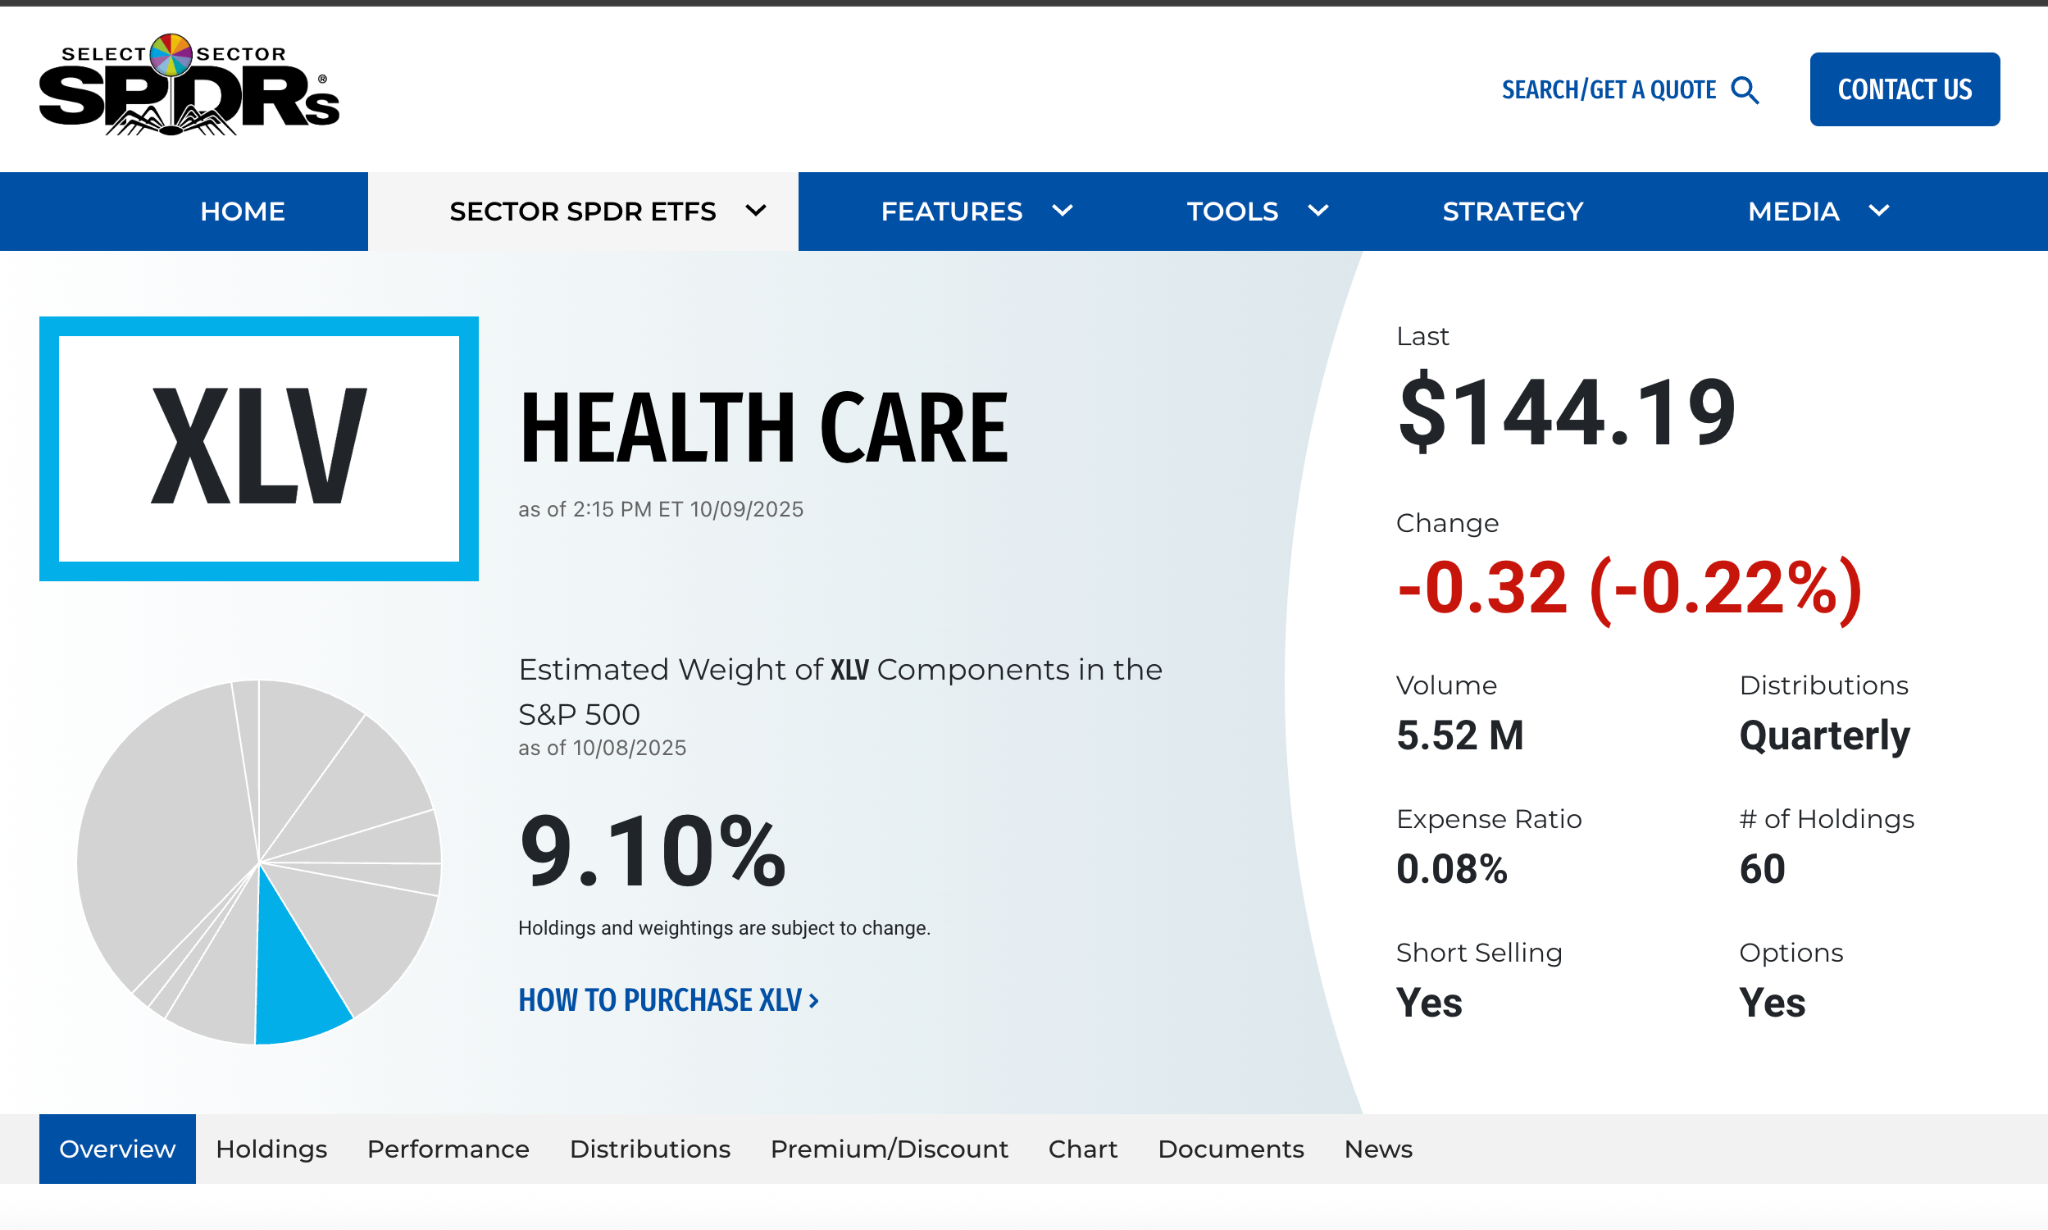
The healthcare sector maintains a substantial weighting within the S&P 500, typically representing 9-10% of the index’s total market capitalization, though this has fluctuated between approximately 9.6% and 16% over different market cycles. As of mid-2025, the sector weighted approximately 9.6% of the S&P 500, making it one of the top five sectors by market capitalization alongside Information Technology, Financials, Consumer Discretionary, and Communication Services.schwab
This significant market weight reflects the sector’s economic importance—U.S. healthcare spending represents over $4 trillion annually and accounts for approximately 17-18% of U.S. GDP, one of the highest percentages among developed nations. The sector’s market capitalization concentration is noteworthy, with UnitedHealth Group frequently representing the largest single constituent, reaching a market value approaching $470 billion in early 2025. Other mega-cap healthcare companies including Eli Lilly, Johnson & Johnson, AbbVie, and Novo Nordisk rank among the largest publicly traded companies globally.statista
Demographic Tailwinds: The Aging Population Imperative
Perhaps the most compelling structural driver supporting long-term healthcare sector growth is the dramatic aging of the U.S. population. According to the U.S. Census Bureau, by 2030—just five years from now—all baby boomers (those born between 1946 and 1964) will be older than 65, resulting in approximately one in every five U.S. residents reaching retirement age. This represents a profound demographic transition with far-reaching implications for healthcare demand.pmc.ncbi.nlm.nih
The numbers are striking: the U.S. population aged 65 and older is projected to increase from 58 million in 2022 to 82 million by 2050, representing a 40% increase. Even more significantly, the fastest-growing demographic cohort will be those aged 85 and older, projected to triple from 6.5 million in 2022 to 17.3 million by 2050—a population comparable to the entire state of New York. Between 2020 and 2030 alone, the number of older adults is projected to increase by almost 18 million.ruralhealthinfo
This aging trend creates sustained demand across virtually every healthcare sub-sector. Approximately 90% of adults over age 65 experience one or more chronic conditions requiring ongoing medical care, prescription drugs, physician visits, diagnostic testing, and often long-term care services. Chronic conditions including diabetes, cardiovascular disease, arthritis, hypertension, and dementia drive disproportionate healthcare utilization and spending, with the CDC reporting that over 90% of the nation’s $4+ trillion healthcare expenditure is directed toward treating chronic illnesses.essentialfsi
The demographic imperative extends beyond simple volume growth. Older patients require more complex, coordinated care involving multiple specialists, advanced therapies, medical devices, and supportive services—creating opportunities across pharmaceutical companies developing age-related disease treatments, medical device manufacturers producing orthopedic implants and cardiovascular devices, healthcare services providers operating specialized facilities, and managed care organizations coordinating increasingly complex care pathways.pmc.ncbi.nlm.nih
Defensive Characteristics and Economic Cycle Performance
Healthcare’s classification as a defensive, non-cyclical sector stems from the fundamental economic principle of inelastic demand. Unlike discretionary purchases—automobiles, vacations, luxury goods—that consumers can postpone during economic downturns, healthcare services are often urgent and medically necessary regardless of income changes or macroeconomic conditions. A patient requiring cancer treatment, diabetes medication, or cardiac surgery cannot defer these needs based on the unemployment rate or GDP growth.essentialfsi
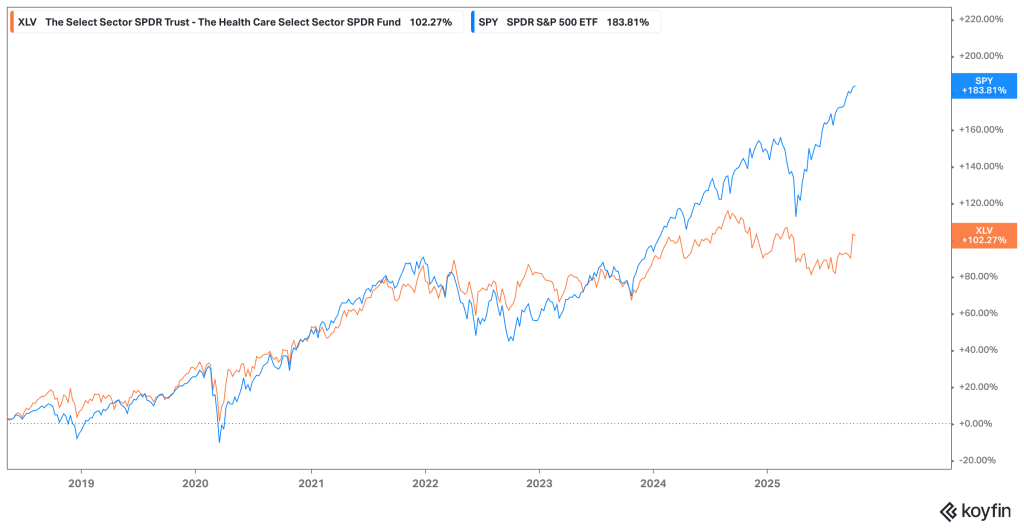
Historical performance data validates this defensive positioning. During the 2001 dot-com recession, while the S&P 500 lost approximately half its value by Q4 2002, the Health Care Select Sector SPDR Fund (XLV) declined by only 0.75% during the same period—dramatically outperforming the broader market.
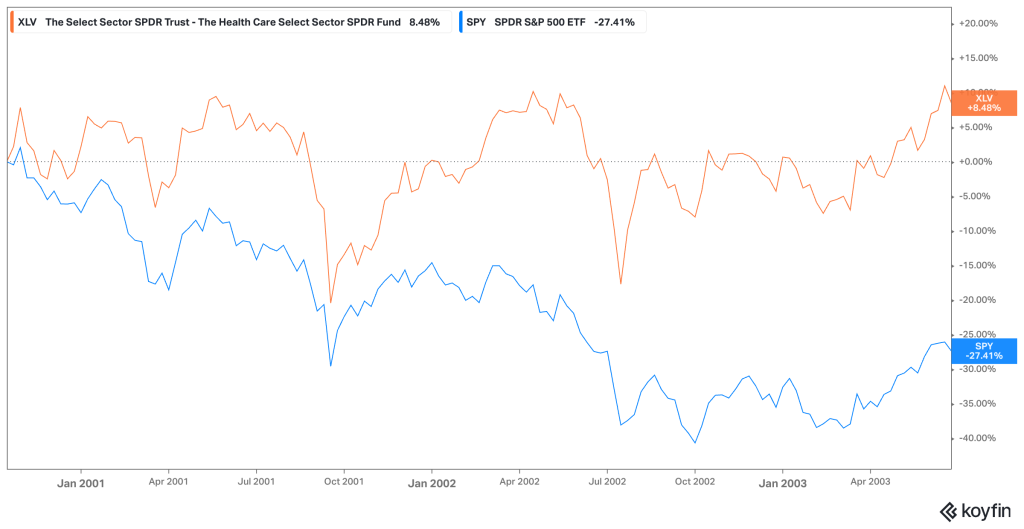
Similarly, during subsequent recessions, healthcare stocks have consistently demonstrated lower volatility and smaller drawdowns compared to cyclical sectors like Consumer Discretionary, Industrials, and Financials.essentialfsi
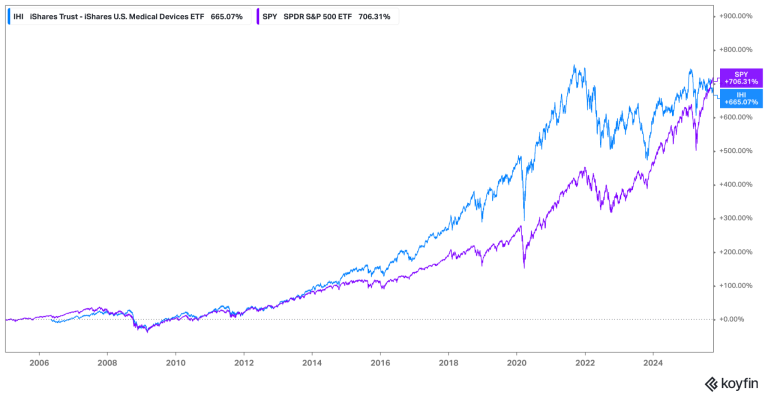
However, in the last few years, SPY has clearly outperformed XLV:
Several structural factors reinforce healthcare’s recession-resistant characteristics beyond demand inelasticity:reit
Government Funding Stability – A substantial portion of U.S. healthcare spending flows through government programs, particularly Medicare (serving 65+ population) and Medicaid (serving low-income populations). These programs historically continue funding during recessions and may actually expand as safety net measures when unemployment rises and more individuals qualify for Medicaid coverage.essentialfsi
Continuous Innovation Pipeline – Unlike sectors dependent purely on economic growth, healthcare benefits from scientific advancement that creates new treatment paradigms independent of economic cycles. The FDA approved 55 novel drugs in 2023, maintaining a robust innovation pipeline that generates new revenue opportunities even during economic contractions.essentialfsi
Chronic Disease Prevalence – Rising rates of chronic conditions create ongoing baseline demand for medications and treatments that persists through economic cycles, providing predictable revenue streams particularly for pharmaceutical and biotechnology companies.essentialfsi
Sector Positioning for Financial Analysts
For junior analysts entering healthcare coverage, understanding this sector’s unique positioning is essential. Healthcare combines defensive stability with innovation-driven growth potential, a relatively rare combination in equity markets. While utilities and consumer staples offer defensive characteristics, they typically lack healthcare’s innovation-driven growth opportunities. Conversely, while technology sectors offer high growth potential, they lack healthcare’s non-cyclical demand profile.essentialfsi
This dual nature creates distinct analytical requirements. Analysts must master defensive sector fundamentals—understanding reimbursement dynamics, regulatory frameworks, and demographic trends—while simultaneously developing expertise in evaluating innovation pipelines, assessing clinical trial data, and valuing pre-revenue biotechnology companies. The sector’s significant market weight, regulatory complexity, and specialized valuation methodologies make it one of the most intellectually demanding coverage areas in equity research, requiring deep domain expertise that blends scientific understanding, regulatory knowledge, financial modeling proficiency, and strategic insight.
The following sections will provide the comprehensive framework necessary to develop this multifaceted expertise, beginning with the core economic characteristics that differentiate healthcare from all other sectors.
2. Core Economic Characteristics
The healthcare sector possesses a unique set of economic characteristics that fundamentally differentiate it from all other market sectors. Understanding these structural features is essential for analysts seeking to evaluate healthcare companies, as they shape competitive dynamics, investment timelines, risk profiles, and valuation methodologies across all industry groups within GICS 35.deloitte
2.1 Defensive and Non-Cyclical Nature
As established in the introduction, healthcare demand exhibits remarkably low correlation with economic cycles. This non-cyclical characteristic stems from the medical necessity of healthcare products and services—patients do not defer cancer treatments, insulin prescriptions, or cardiac surgeries based on GDP growth rates or unemployment statistics. During the 2008-2009 financial crisis, while the S&P 500 declined approximately 57% from peak to trough, the Health Care Select Sector SPDR Fund (XLV) fell only 37%, demonstrating substantial downside protection. Similarly, during the 2020 COVID-19 pandemic market crash, healthcare stocks recovered more quickly than most cyclical sectors despite temporary disruptions to elective procedures.essentialfsi
This defensive positioning creates portfolio construction implications for institutional investors. Healthcare allocations typically serve as ballast during market downturns while still offering participation in long-term growth driven by innovation and demographics. The sector’s beta to the S&P 500 historically ranges between 0.7 and 0.9, confirming its lower volatility profile relative to the broader market.reit
2.2 Regulatory Intensity: The FDA Approval Process
No sector faces greater regulatory scrutiny and oversight than healthcare. The U.S. Food and Drug Administration (FDA) maintains authority over approximately 20% of consumer spending in the United States, regulating not only pharmaceutical drugs and biologic therapies but also medical devices, diagnostics, food safety, and tobacco products. For pharmaceutical and biotechnology companies, FDA approval represents the most critical binary outcome determining commercial viability.fda
The Clinical Trial Pathway
Drug development follows a rigorous, multi-phase clinical trial process that typically spans 10-15 years from initial discovery to final approval:ifpma
- Discovery and Preclinical Research (3-6 years) – Scientists identify molecular targets associated with disease pathways and screen thousands of compounds to identify promising drug candidates. Preclinical testing involves laboratory studies (in vitro) and animal testing (in vivo) to assess basic safety, pharmacokinetics (how the body absorbs and metabolizes the drug), and biological activity. Compounds must demonstrate acceptable safety profiles before human testing can begin.synergbiopharma
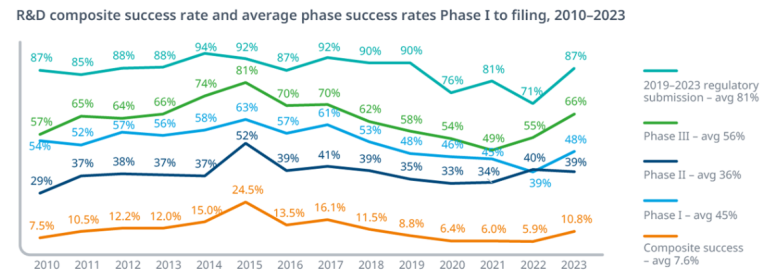
- Phase I Clinical Trials (Several months, ~20-100 participants) – The first human testing focuses primarily on safety and dose-ranging. Phase I trials typically enroll healthy volunteers (except for oncology drugs, which recruit cancer patients due to toxicity concerns) to establish maximum tolerated doses, identify side effects, and understand how the drug is absorbed, distributed, metabolized, and excreted. Approximately 52% of compounds entering Phase I successfully progress to Phase II, meaning roughly half fail at this initial stage.antidote.
- Phase II Clinical Trials (Up to 2 years, 100-300 participants) – Phase II represents the “valley of death” in drug development, where the focus shifts from safety to preliminary efficacy assessment. Trials enroll patients with the target disease to determine whether the drug demonstrates biological activity and therapeutic benefit. This phase also continues safety monitoring in a larger patient population. Phase II has the lowest success rate of any clinical phase—only approximately 29-32% of Phase II candidates progress to Phase III. Companies frequently terminate development at this stage when efficacy results fail to justify the massive Phase III investments ahead, or when safety concerns emerge in larger patient populations.wikipedia
- Phase III Clinical Trials (1-4 years, 300-3,000+ participants) – The pivotal Phase III trials are designed to definitively demonstrate efficacy and safety in large, diverse patient populations representative of real-world treatment settings. These multi-center, randomized, controlled trials often compare the investigational drug against standard-of-care treatments or placebo. Phase III trials are extraordinarily expensive—often costing hundreds of millions of dollars for a single study—and time-consuming, but they generate the robust evidence required for regulatory approval. Approximately 58-60% of Phase III candidates ultimately receive FDA approval, reflecting the careful screening that occurs in earlier phases.sciencedirect
- FDA Review Process (10-12 months) – Upon successful Phase III completion, companies submit a New Drug Application (NDA) for small molecules or Biologics License Application (BLA) for biologic therapies. The FDA review process involves a 60-day filing review to ensure the application is complete, followed by a comprehensive evaluation by multidisciplinary teams of medical, pharmacology, and statistical experts. For novel drugs, the FDA typically designates a 10-month standard review timeline, though Priority Review designation (granted for therapies addressing serious conditions with significant advantages over existing treatments) shortens this to 6 months. Many high-profile applications undergo Advisory Committee (AdCom) meetings where external experts provide independent assessments that significantly influence final FDA decisions.synergbiopharma
- Phase IV Post-Marketing Surveillance (Ongoing) – Even after approval, drugs continue to be monitored through Phase IV studies that track long-term safety, identify rare adverse events that may not emerge in finite clinical trials, and explore additional indications. The FDA can mandate post-marketing studies as conditions of approval, and may withdraw approval if unacceptable safety signals emerge.patheon
Specialized Regulatory Pathways
Beyond the traditional approval pathway, the FDA has established expedited programs designed to accelerate development of therapies addressing serious unmet medical needs (fda)
Breakthrough Therapy Designation – Granted to drugs demonstrating substantial improvement over existing therapies for serious conditions based on preliminary clinical evidence. This designation provides intensive FDA guidance and potentially faster review timelines.
Accelerated Approval – Allows conditional approval based on surrogate endpoints (measurable biological markers) rather than definitive clinical outcomes, enabling faster market access for therapies targeting life-threatening diseases while requiring confirmatory Phase IV trials. This pathway has been particularly important for oncology and HIV drugs.
Orphan Drug Designation – Incentivizes development of treatments for rare diseases affecting fewer than 200,000 U.S. patients by providing 7 years of market exclusivity, tax credits for clinical trial costs, and waived FDA application fees.
505(b)(2) Pathway – Permits approval of modified versions of previously approved drugs, leveraging existing safety and efficacy data while requiring only incremental clinical studies to demonstrate the modification’s impact. This pathway enables lifecycle management strategies and reduces development costs.
2.3 R&D Intensity and Patent Dependency
The pharmaceutical and biotechnology industries rank among the most R&D-intensive sectors globally, with spending levels that dwarf other industries on a percentage-of-revenue basis. According to comprehensive 2021 research published in Nature Reviews Drug Discovery, the global biopharmaceutical ecosystem invested $276 billion in R&D across 4,191 companies—more than double commonly cited estimates that focus only on large public companies. This represents an R&D intensity of 27% of revenue across the sector, far exceeding technology companies (typically 10-15%) and manufacturing industries (3-5%).rdworldonline
The Cost of Drug Development
Developing a new drug has become extraordinarily expensive. Deloitte’s 2025 annual analysis of the top 20 pharmaceutical companies by R&D spending found that the average cost per approved drug reached $2.23 billion in 2024, up from $2.12 billion the prior year. However, this figure understates total ecosystem costs—when accounting for all companies participating in drug development (including the vast number of failed programs across biotech companies that never achieve approval), the total investment per successful FDA approval exceeds $5 billion.fiercebiotech
The costs vary dramatically by therapeutic area. Anti-infective drugs represent the least expensive category at approximately $379 million per approved drug (including cost of capital and failures), while pain and anesthesia drugs cost an estimated $1.76 billion. Oncology drugs, which dominate modern drug development pipelines, average approximately $1.2 billion per approval, reflecting complex clinical trial designs, extended duration studies, and high failure rates.jamanetwork
These escalating costs stem from multiple factors:fiercebiotech
Increasing Trial Complexity – Modern trials increasingly target narrower patient populations with specific biomarkers or genetic profiles, requiring larger screening efforts and more sophisticated trial designs.fiercebiotech
Longer Development Timelines – The average development timeline from discovery to approval spans 10-15 years, with clinical phases alone consuming 6-7 years.ifpma
High Attrition Rates – The overwhelming majority of drug candidates fail during development. A 2025 analysis found that only 5-14% of drugs entering clinical trials ultimately receive FDA approval, meaning companies must fund numerous failures to achieve occasional successes.wikipedia
Macroeconomic Factors – Rising labor costs, inflation in clinical trial site fees, and increasing regulatory requirements all contribute to R&D cost inflation.fiercebiotech
Leading pharmaceutical companies invest staggering absolute amounts in R&D. According to 2025 data, Merck led the industry with $17.93 billion in R&D spending, followed by Roche ($15.4B), Johnson & Johnson ($15.2B), Pfizer ($11.5B), and AbbVie ($8.3B). These investments represent 15-25% of revenue for most large pharmaceutical companies, with smaller biotechnology firms often spending 50-100% or more of revenue on R&D during pre-commercial stages.linkedin
Patent Dependency and Exclusivity
The pharmaceutical business model is fundamentally built on patent-protected monopolies. Unlike most industries where competitive advantages stem from brand loyalty, distribution networks, or operational efficiencies, pharmaceutical companies derive profitability almost entirely from time-limited patent exclusivity that prevents generic competition. This creates unique investment dynamics centered on patent expiration dates—known as the “patent cliff”—when branded drugs lose exclusivity and face immediate revenue erosion of 80-90% as generic competitors enter at dramatically lower prices.drugpatentwatch
Patent Structure – Pharmaceutical patents typically provide 20 years of protection from the initial filing date. However, because patents are filed early in development (often during preclinical or Phase I stages) and development consumes 10-15 years, effective market exclusivity often lasts only 8-12 years after FDA approval. Companies attempt to extend this exclusivity through various mechanisms including pediatric exclusivity extensions (6 additional months), Hatch-Waxman provisions, and secondary patents covering formulations, manufacturing processes, or new indications.
The Humira Case Study: Patent Thicket Strategy – AbbVie’s Humira (adalimumab) represents the most profitable drug in pharmaceutical history, generating nearly $200 billion in cumulative sales over two decades. Humira’s primary composition-of-matter patent expired in 2016, theoretically opening the U.S. market to biosimilar competition. However, AbbVie had constructed an unprecedented “patent thicket” consisting of over 130 patents covering formulations, dosing regimens, manufacturing processes, and various methods of use. This legal fortress delayed U.S. biosimilar entry until January 2023—a full 6 years beyond primary patent expiration—through a combination of settlement agreements, litigation, and the sheer complexity of navigating the overlapping patent portfolio. At its 2021 peak, Humira generated $20.7 billion in annual sales, making its impending patent cliff the steepest in industry history.drugpatentwatch
The Humira biosimilar launches in 2023 provide a live experiment in biologics erosion patterns. By 2024, Humira’s U.S. sales had declined significantly as eight biosimilar competitors entered the market, though AbbVie successfully transitioned many patients to next-generation products Skyrizi and Rinvoq, which together generated approximately $19 billion in 2024 sales, substantially offsetting the Humira cliff.biospace
Lipitor’s Generic Transition – Pfizer’s cholesterol-lowering drug Lipitor (atorvastatin) provides another instructive case study. At its peak in the mid-2000s, Lipitor generated approximately $13 billion in annual sales, making it the best-selling drug in pharmaceutical history at that time. When Lipitor’s U.S. patent expired in November 2011, generic versions immediately captured market share, and within 12 months, Lipitor’s sales had declined by over 80%. Pfizer employed a “layered defense” strategy using secondary patents on formulations and crystalline forms to extend exclusivity modestly beyond the primary patent expiration, but ultimately could not prevent the dramatic revenue cliff typical of small molecule generics.biopharmadive
The Innovation Imperative
Patent cliffs create an existential imperative for continuous innovation. Large pharmaceutical companies must consistently discover, develop, and launch new products to replace revenue lost to generic erosion. Industry data projects a $236 billion patent cliff facing pharmaceutical companies between 2025-2030 as numerous blockbuster drugs lose exclusivity. This has driven massive M&A activity as companies acquire clinical-stage assets and biotech platforms to replenish pipelines, as well as increased focus on biologics (which face less severe biosimilar erosion than small molecule generics) and specialty pharmaceuticals targeting rare diseases with smaller generic competition risks.linkedin
2.4 Reimbursement Dynamics
Unlike most consumer goods where patients pay directly, healthcare operates through a complex multi-payer reimbursement system that fundamentally shapes pricing, utilization, and profitability. Approximately 92% of Americans have health insurance coverage, with roughly 68% covered through private insurance (employer-sponsored or individual market plans) and 36% covered by government programs (Medicare and Medicaid, with some overlap).nber
Medicare: The Dominant Payer
Medicare, the federal health insurance program serving Americans aged 65 and older plus certain disabled individuals, covers approximately 67 million beneficiaries and represents the single largest payer in the U.S. healthcare system. Medicare’s reimbursement policies exert enormous influence on pharmaceutical and medical device pricing because commercial insurers frequently adopt similar coverage and payment policies.kff
Medicare operates through distinct parts with different reimbursement methodologies:bluepathsolutions
Medicare Part A – Covers inpatient hospital services through prospective payment systems based on Diagnosis-Related Groups (DRGs), creating financial incentives for hospitals to manage costs efficiently.
Medicare Part B – Covers physician-administered drugs (infused or injected medications given in doctor’s offices or hospital outpatient settings) and durable medical equipment. Part B reimburses physicians based on Average Sales Price (ASP) plus 6%, using lagged market pricing data. This creates complex dynamics where price increases in one period affect future reimbursement levels, potentially incentivizing gradual price escalation. Medicare Part B drug spending reached $43 billion in 2021 and has grown at an average annual rate of 9% since 2009.nber
Medicare Part D – Covers retail prescription drugs through private insurance plans that receive subsidies from Medicare. Part D represents a major component of pharmaceutical reimbursement, with complex formulary tier structures, prior authorization requirements, and beneficiary cost-sharing that influence utilization patterns. The 2022 Inflation Reduction Act (IRA) introduced groundbreaking changes to Part D, including a $2,000 annual out-of-pocket cap for beneficiaries (effective 2025) and, most significantly, Medicare drug price negotiation authority.kff
Medicare Drug Price Negotiation: A Paradigm Shift
The IRA granted Medicare unprecedented authority to directly negotiate prices for certain high-expenditure drugs, fundamentally altering pharmaceutical economics. The program began in 2026 with 10 drugs selected for negotiation based on Part D spending, expanding to 15 Part D drugs by 2027, 15 Part B drugs by 2028, and 20 drugs annually thereafter. Selected drugs must have been approved for at least 7-9 years (depending on drug type) without generic or biosimilar competition.ncpa
The negotiation process establishes Maximum Fair Prices (MFP) representing substantial discounts—typically 40-60% below current list prices—that become effective across the Medicare program. For pharmacies, this creates unprecedented cash flow challenges because the manufacturer rebate mechanism introduces significant payment timing lags. Under the new framework, pharmacies initially acquire drugs at near-standard wholesale costs, receive traditional PBM reimbursement, but then must wait weeks to receive manufacturer refunds representing approximately 60% of acquisition costs. This timing mismatch between cash outlays and reimbursement receipts creates liquidity pressures particularly for independent pharmacies without substantial balance sheet capacity.ncpa
Medicaid and Commercial Insurance
Medicaid, the joint federal-state program serving low-income populations, covers approximately 85 million Americans with significant state-level variation in reimbursement policies. Pharmaceutical manufacturers must provide Medicaid programs with statutory rebates—typically 23.1% of Average Manufacturer Price (AMP) for branded drugs plus additional rebates if prices increase faster than inflation. These mandatory rebates significantly reduce net pharmaceutical revenues from Medicaid populations.
Commercial insurance plans (employer-sponsored and individual market) negotiate prices through Pharmacy Benefit Managers (PBMs)—intermediaries like CVS Caremark, Express Scripts (Cigna), and OptumRx (UnitedHealth) that manage formularies, negotiate manufacturer rebates, and process claims. PBMs exert considerable pricing pressure through formulary placement, requiring pharmaceutical manufacturers to offer substantial discounts (often 40-60% off list price) to secure preferred formulary status and avoid exclusions.
2.5 Long Development Timelines
The 10-15 year development cycle from target identification to regulatory approval creates unique financial modeling challenges and investment considerations. Unlike technology products that may move from concept to commercialization in 12-24 months, pharmaceutical development requires patient capital willing to fund prolonged periods of negative cash flow with highly uncertain binary outcomes.weforum.
This extended timeline has several critical implications for analysts:
Discounted Cash Flow Sensitivity – When valuing pharmaceutical pipelines using risk-adjusted NPV methodology (discussed in Section 7), discount rate selection critically impacts valuations because cash flows occur a decade or more in the future. A 2% change in discount rate assumptions can alter pipeline valuations by 30-50%.
Capital Requirements – Biotechnology companies typically require multiple financing rounds through equity offerings or partnerships to fund development through approval, creating dilution risk for early investors.
Competitive Dynamics – Long development timelines mean competitive landscapes can transform dramatically between program initiation and commercialization, as rival companies may advance faster programs or regulatory standards may evolve.
Binary Event Risk – Because clinical development spans many years with relatively infrequent binary readouts (Phase II results, Phase III topline data, FDA decisions), pharmaceutical stocks exhibit high volatility around these events, with 30-50% single-day moves common on positive or negative data.
2.6 Real Company Examples: 10-K Analysis
To illustrate these economic characteristics in practice, examining actual company disclosures provides concrete examples:
Pfizer Inc. (2024 10-K) – Pfizer reported 2024 R&D expenses of approximately $11.5 billion, representing 15% of revenues. The company’s 10-K extensively discusses patent expirations, noting that several key products including certain COVID-19 antiviral formulations face near-term loss of exclusivity. Pfizer’s risk factors emphasize regulatory uncertainty, clinical trial failure risks, and the impact of pricing pressures from government negotiations and PBM formulary management.
Johnson & Johnson (2024 10-K) – J&J’s pharmaceutical segment reported R&D investment exceeding $15 billion in 2024, with extensive pipeline disclosures covering 70+ compounds in clinical development. The company’s financial disclosures highlight the diversification benefit of its three-segment structure (pharmaceutical, medical devices, consumer health before the Kenvue spin-off), which partially insulates overall performance from individual product patent cliffs.
UnitedHealth Group (2024 10-K) – As the nation’s largest health insurer, UnitedHealth’s 10-K provides extensive discussion of Medical Loss Ratio (MLR)—the percentage of premium revenue spent on medical claims. Regulatory requirements mandate minimum MLRs of 80-85% depending on market, creating profitability constraints. The company’s OptumRx PBM segment negotiates pharmaceutical rebates that significantly impact net drug costs and formulary management strategies.
These core economic characteristics—defensive demand patterns, regulatory intensity, R&D dependence, patent monopolies, reimbursement complexity, and extended development timelines—collectively define the healthcare sector’s unique analytical requirements. The following sections will build upon this foundation to explore the complete drug development lifecycle, key sector drivers, and specialized valuation methodologies.
3. The Drug Development Lifecycle
The drug development lifecycle represents the structured, multi-decade journey from scientific discovery to commercial product, characterized by high costs, low success probabilities, and intense regulatory oversight. This lifecycle applies primarily to the Pharmaceuticals and Biotechnology industry groups within the healthcare sector, where innovation drives the majority of value creation. Understanding this process is foundational for financial analysts, as pipeline progression directly impacts company valuations, stock volatility, and strategic decision-making.sciencedirect
3.1 Discovery and Preclinical Research
Drug discovery begins with target identification, where scientists identify proteins, genes, or pathways implicated in disease progression. High-throughput screening techniques evaluate thousands of chemical compounds or biologic molecules against these targets to identify potential drug candidates capable of modulating disease activity. This phase often leverages advances in genomics, artificial intelligence, and computational biology to accelerate candidate selection.drugpatentwatch
Preclinical research follows, focusing on safety, efficacy, and pharmacokinetics in laboratory settings and animal models. Researchers conduct in vitro studies using cell lines to assess basic biological activity, followed by in vivo animal testing to evaluate dosing, toxicity, and metabolic pathways. Regulatory requirements mandate demonstrating that candidates exhibit acceptable safety profiles before human testing can commence, with Investigational New Drug (IND) applications submitted to the FDA detailing preclinical data and proposed clinical protocols.fda
The discovery and preclinical phase typically spans 3-6 years and costs $100-200 million per candidate, though attrition is extreme—for every 10,000 screened compounds, fewer than 250 (2.5%) advance to preclinical development. Success at this stage serves as a critical filter, with approximately 70% of candidates progressing from preclinical to Phase I based on 2025 industry benchmarks. Companies like Pfizer exemplify this phase in their 2024 10-K, noting investments in “next-generation modalities” such as RNA-based therapies, with discovery efforts targeting oncology and immunology targets.linkedin
3.2 Clinical Trial Phases
Once an IND is approved, development enters clinical testing, where human safety and efficacy are rigorously evaluated. These phases represent the core of drug development, with escalating costs and patient numbers reflecting increasing evidentiary standards.antidote
Phase I: Safety and Tolerability
Phase I trials enroll 20-100 healthy volunteers or patients (typically oncology patients for anti-cancer agents) to establish pharmacokinetics (PK), pharmacodynamics (PD), and the maximum tolerated dose (MTD). The primary objective is safety assessment, identifying dose-limiting toxicities and side effects while determining how the drug is absorbed, distributed, metabolized, and excreted.wikipedia
These trials last several months to one year and cost $1-5 million, focusing on single-ascending or multiple-ascending dose designs. Success rates have declined to approximately 47% from Phase I to Phase II, reflecting heightened safety standards and the use of biomarkers to terminate programs early. A notable example is the development of Merck’s Keytruda (pembrolizumab), where Phase I trials beginning in 2010 established its safety profile as a PD-1 inhibitor, leading to breakthrough designation in 2013 based on early tumor response data.norstella
Phase II: Proof-of-Concept and Dose Optimization
Phase II expands to 100-300 patients with the target disease, shifting focus to preliminary efficacy while continuing safety monitoring. Designs include randomized controlled trials assessing biological activity, optimal dosing, and initial therapeutic benefits against placebo or standard-of-care. This phase, lasting 1-2 years and costing $10-50 million, is the “valley of death” due to its low success rate of 28-40% from Phase II to Phase III.inderes
Failures often stem from inadequate efficacy (40-50% of terminations) or emerging safety issues in larger cohorts. For Novo Nordisk’s Ozempic (semaglutide), Phase II trials in 2012-2013 demonstrated significant HbA1c reductions in type 2 diabetes patients, supporting advancement with a 30% weight loss signal that later revolutionized obesity treatment. Industry data from IQVIA’s 2025 R&D report highlights Phase II attrition as the primary productivity challenge, with only 29% of oncology candidates succeeding.iqvia
Phase III: Confirmatory Efficacy and Large-Scale Safety
Phase III involves 300-3,000+ patients in multi-center, randomized, double-blind trials to confirm efficacy, establish dosing, and monitor rare adverse events. These pivotal trials, lasting 1-4 years and costing $100-300 million each, compare the drug against active controls and generate data for labeling claims. Success rates stand at 55-65% from Phase III to approval, with failures primarily due to efficacy shortfalls or unexpected safety signals.synergbiopharma
Global coordination is essential, as trials span multiple countries to achieve statistical power. Keytruda’s Phase III trials (e.g., KEYNOTE-024 in 2016) demonstrated a 30% reduction in progression-free survival for non-small cell lung cancer, leading to accelerated approval and establishing it as a blockbuster with $29.5 billion in 2024 sales. The FDA’s 2025 biological approvals data shows 55 novel agents approved, with Phase III success driven by adaptive trial designs.biospace
Phase IV: Post-Marketing Surveillance
Phase IV occurs after approval, involving ongoing observational studies to monitor long-term safety, effectiveness in real-world populations, and potential new indications. These trials, which may be required by the FDA, track rare adverse events and compare outcomes across diverse demographics. Costs vary widely, from $10 million for pharmacovigilance to hundreds of millions for label expansions, with no fixed timeline.ddregpharma
Phase IV data can lead to label updates or withdrawals if serious risks emerge, as seen with Roche’s Avastin (bevacizumab), where post-marketing studies in 2011 led to FDA label restrictions for breast cancer based on survival data. Success in Phase IV is near 100% for monitoring but critical for lifecycle extension.ddregpharma
3.3 Regulatory Approval Process and Timelines
Upon Phase III completion, sponsors submit a New Drug Application (NDA) for small molecules or Biologics License Application (BLA) for biologics, compiling thousands of pages of clinical, non-clinical, and manufacturing data. The FDA’s review follows a 60-day filing assessment to confirm completeness, followed by substantive evaluation.synergbiopharma
Standard review timelines total 10 months, while Priority Review (for breakthrough therapies) shortens to 6 months; Accelerated Approval uses surrogate endpoints with confirmatory studies required. The process includes multidisciplinary reviews, potential Advisory Committee meetings for controversial applications, and issuance of Complete Response Letters (CRLs) if deficiencies exist—FDA now publishes CRLs promptly for transparency.ropesgray
In 2025, FDA approvals averaged 10.5 months for NDAs, with 92% of submitted applications ultimately approved after revisions. For Keytruda, Merck’s BLA received accelerated approval in September 2014, just 8 months after submission, based on Phase Ib/II data, with full approval following Phase III confirmation in 2015. The FDA’s guidance states: “The review process ensures that drugs are safe and effective, balancing innovation with patient protection”.rheumatologyadvisor
3.4 Post-Approval Commercialization and Lifecycle Management
Post-approval shifts to commercial launch, involving manufacturing scale-up, supply chain establishment, and marketing to prescribers. Companies build sales forces, negotiate reimbursement, and launch patient access programs. Revenue ramps as adoption grows, with blockbusters like Ozempic reaching $17 billion in 2024 sales through diabetes and obesity indications.pharmatimes
Lifecycle management strategies extend exclusivity and maximize value. These include:iqvia
- Label Expansions: Pursuing new indications via supplemental NDAs/BLAs, as Novo Nordisk did with Ozempic’s 2021 obesity label addition.global.pharmcube
- Formulation Improvements: Developing extended-release versions or combinations to create new patents.
- Pediatric Extensions: Gaining 6 months’ additional exclusivity for pediatric studies.drugpatentwatch
- Global Harmonization: Managing variations (e.g., EU Type II) for international markets.ddregpharma
Johnson & Johnson’s 2024 10-K describes lifecycle management for Stelara (ustekinumab): “We pursue new indications and formulations to address evolving patient needs while navigating regulatory requirements”. Effective strategies involve stakeholder input and defined roles for renewals, CMC changes, and pharmacovigilance.iqvia
3.5 Patent Expiration and Loss of Exclusivity (LOE)
Patents provide 20 years from filing, but effective exclusivity post-approval averages 8-12 years due to development delays. LOE triggers generic or biosimilar entry, causing 80-90% revenue erosion within months.drugpatentwatch
Strategies to mitigate include patent thickets and evergreening, as with AbbVie’s Humira (LOE 2023 after 130+ patents). Keytruda’s composition patent expires in 2028, prompting Merck to develop subcutaneous formulations and pursue new combinations to soften the cliff. Ozempic’s patents extend to 2032, but patent challenges from Eli Lilly highlight LOE risks in competitive markets.biopharmadive
3.6 Probability of Success at Each Stage
Overall likelihood of approval (LOA) from Phase I is 6.7-14.3%, varying by therapeutic area (oncology ~5%, infectious diseases ~20%). Phase-specific success rates:sciencedirect
- Preclinical to Phase I: ~70%drugpatentwatch
- Phase I to II: 47-70% norstella
- Phase II to III: 28-40% inderes
- Phase III to Approval: 55-65% drugpatentwatch
- Regulatory Approval: 91-92% norstella
These rates inform risk-adjusted NPV valuations, with oncology pipelines showing lower Phase II success (15-20%) due to biological complexity. The “innovation paradox” emerges here—breakthrough designations boost Phase III odds by 10-15% but face post-approval pricing scrutiny.iqvia
Case Study: Keytruda’s Lifecycle Journey
Merck’s Keytruda illustrates a successful lifecycle. Discovered in 2006 targeting PD-1, preclinical work confirmed anti-tumor activity by 2010. Phase I (2011-2013) showed safety in 89 patients; Phase II (2013-2015) demonstrated 52% response rates in melanoma, earning breakthrough status. Phase III KEYNOTE trials (2015-2017) confirmed superiority, leading to 2014 accelerated approval and 40+ indications by 2025. Post-approval, Phase IV studies expanded to adjuvant settings, with 2024 sales at $29.5 billion. LOE looms in 2028, but lifecycle management (subcutaneous version, combinations) positions successors like Lynparza for continuity.xtalks.
This lifecycle underscores the sector’s binary risks and innovation rewards, where a single success like Keytruda can transform a company’s valuation.
4. Key Drivers and Sensitivities
The U.S. healthcare sector’s performance and valuation are shaped by a complex interplay of structural drivers and macroeconomic sensitivities that distinguish it from other GICS sectors. These factors create both opportunities for long-term growth and heightened risks that require specialized analytical approaches. Understanding these dynamics is essential for junior analysts to accurately model scenarios, assess investment theses, and navigate the sector’s inherent uncertainties.essentialfsi
4.1 Demographics: Aging Population and Chronic Disease Prevalence
Demographic shifts represent the most enduring structural driver of healthcare demand, with the U.S. population’s rapid aging creating sustained tailwinds across all sub-sectors. By 2025, the number of Americans aged 65 and older has reached 61 million, up from 41 million in 2011, and this cohort is projected to grow to 82 million by 2050—a 40% increase. This aging imperative is compounded by the fact that 93% of adults aged 65 and older suffer from at least one chronic condition, while 79% have two or more, driving disproportionate utilization of pharmaceuticals, medical devices, and healthcare services.americanactionforum
Chronic diseases—defined as conditions lasting one year or longer requiring ongoing medical attention or limiting activities of daily living—now affect 76.4% of U.S. adults, or approximately 194 million people, with 51.4% (131 million) experiencing multiple chronic conditions (MCC). Prevalence varies by age: among young adults (18-44), obesity (27.3%), depression (25.0%), and high cholesterol (16.3%) dominate; midlife adults (45-64) face obesity (37.1%), high cholesterol (36.9%), and high blood pressure (35.0%); while older adults (65+) report high blood pressure (61.4%), high cholesterol (55.1%), and arthritis (51.3%) as most common. The burden is particularly acute in the over-50 population, where chronic disease prevalence is expected to nearly double from 72 million in 2020 to 143 million by 2050, with multimorbidity rising 92% to 15 million cases.cdc
These trends translate directly into sector opportunities. The aging population fuels demand for cardiovascular drugs (e.g., Eli Lilly’s Mounjaro for diabetes-related complications), orthopedic devices (e.g., Zimmer Biomet’s joint replacements), and managed care services (e.g., UnitedHealth’s Medicare Advantage plans), which grew membership to 33 million in 2024. Chronic disease management also drives biotechnology innovation, with companies like Vertex Pharmaceuticals targeting cystic fibrosis—a rare but chronic condition affecting 30,000 Americans—generating $9.9 billion in 2024 sales from Trikafta. As Pfizer notes in its 2024 10-K: “Demographic trends, including an aging global population, increase the prevalence of chronic diseases and drive demand for our innovative therapies across cardiovascular, oncology, and immunology franchises”.statista
The sensitivity here lies in uneven distribution: chronic disease burden is higher among low-income and minority populations, straining Medicaid spending and exacerbating disparities in access, which could pressure provider margins if reimbursement rates lag. Analysts must monitor Census Bureau projections and CDC morbidity data to forecast utilization trends, as a 1% increase in MCC prevalence correlates with 5-7% higher healthcare spending per capita.ncoa
4.2 Innovation Cycles: Breakthrough Therapies, Orphan Drugs, and Personalized Medicine
Innovation serves as the primary engine of growth within the Pharmaceuticals and Biotechnology sub-sectors, where breakthrough therapies and specialized treatments capture premium pricing and market share. Breakthrough Therapy Designation (BTD), granted by the FDA for drugs showing substantial improvement over existing therapies based on preliminary data, has accelerated approvals for 40% of oncology pipeline assets in 2025, reducing development timelines by 1-2 years. Orphan drugs—targeting rare diseases affecting fewer than 200,000 U.S. patients—now comprise 45% of FDA novel approvals, benefiting from 7 years of market exclusivity, tax credits, and fee waivers under the 1983 Orphan Drug Act.pubmed.ncbi.nlm.nih
The orphan drug market is projected to reach $242 billion globally by 2024, driven by gene therapies and biologics for conditions like spinal muscular atrophy, where Novartis’s Zolgensma generated $1.4 billion in 2024 sales despite serving only 300-500 U.S. patients annually. These designations create high-margin niches: orphan drugs average 2-3 times higher pricing than non-orphan counterparts due to limited competition and high unmet need. Johnson & Johnson exemplifies this in its 2024 10-K: “Our pipeline includes 15 orphan-designated candidates in rare diseases, leveraging platform technologies to address genetic mutations and provide curative potential, with breakthrough designations enhancing our probability of success”.biospace
Personalized medicine—tailoring treatments based on genetic, environmental, and lifestyle factors—represents the next innovation frontier, with pharmacogenomics reducing adverse reactions by 30% and optimizing dosing for 20% of U.S. healthcare spending. Advances in next-generation sequencing and AI have enabled companion diagnostics, as seen in Roche’s FoundationOne CDx, which identifies targeted therapies for 50% of advanced cancer patients, driving $800 million in annual sales. The EPPerMed Conference 2025 report states: “Personalized medicine promises to revolutionize prevention, diagnosis, and treatment by integrating genomic research, with pharmacogenomics uptake accelerating across Europe and the U.S. to address 20% of wasted healthcare resources”.eppermed
Sensitivity to innovation cycles manifests in binary events: a single BTD can boost stock prices by 20-50%, but pipeline failures erode valuations rapidly. Analysts must track FDA’s Breakthrough Therapy list and EMA equivalents, as the U.S. lags Europe in pharmacogenomic adoption, creating cross-border opportunities but also regulatory harmonization risks.sciencedirect
4.3 Regulatory Environment: FDA Policies, Accelerated Approvals, and Biosimilar Regulations
The FDA’s evolving policies profoundly influence sector timelines, costs, and competition, with accelerated pathways balancing innovation incentives against safety. The 21st Century Cures Act (2016) and subsequent reforms have streamlined approvals, granting BTD to 450+ drugs since 2012, enabling faster market entry for therapies in oncology and rare diseases. In 2025, the FDA approved 55 novel agents, with 60% via accelerated routes, including priority review shortening timelines to 6 months.venturesaccelerated
Biosimilar regulations have accelerated since the 2010 Biologics Price Competition and Innovation Act, with FDA waiving clinical efficacy studies (CESs) for monoclonal antibody biosimilars in 2025 if analytical similarity and PK/PD data confirm equivalence—mirroring Europe’s case-by-case approach. This policy, based on 600+ comparative studies showing no CES failures among analytically similar biosimilars, reduces development costs by 30-50% and speeds patient access. In 2025, FDA approved 8 new biosimilars, including ustekinumab (Stelara) for psoriasis and bevacizumab (Avastin) for oncology, targeting $100 billion in originator sales by 2030.chemxpert
As AbbVie states in its 2024 10-K: “Biosimilar competition presents significant pricing and market share risks to our biologics portfolio, particularly post-Humira LOE, necessitating robust innovation to maintain leadership in immunology and oncology”. Sensitivities include CRL issuance rates (up 15% in 2025 for complex biologics) and interchangeability designations, which allow pharmacy-level substitution and could accelerate erosion by 20-30% for reference products. Analysts should monitor FDA’s Purple Book for biosimilar approvals and EMA’s biosimilar guidelines for global consistency.biospace
4.4 Political/Policy Risk: Drug Pricing Legislation, Medicare Negotiation, and ACA Changes
Political and policy risks loom large, with drug pricing reforms creating volatility for pharmaceutical valuations. The 2022 Inflation Reduction Act (IRA) empowers Medicare to negotiate prices for high-cost drugs, with the third cycle (effective 2028) expanding to Part B injectables and allowing renegotiations of prior selections. CMS’s September 2025 final guidance selects 15 Part D and 15 Part B drugs annually, enforcing Maximum Fair Prices (MFPs) at 40-60% discounts, while expanding orphan drug exclusions under the “One Big Beautiful Bill Act” (OBBBA) to protect small biotechs. For the first 10 negotiated drugs (2026), MFPs reduced prices by 62% on average, impacting $6 billion in annual Medicare spending.mintz
The Affordable Care Act (ACA), while upheld, faces ongoing modifications through OBBBA (signed July 2025), which imposes work requirements and eligibility verifications for Medicaid (covering 85 million), potentially disenrolling 10-15 million and restricting provider taxes. ACA marketplaces now require pre-enrollment verification for premium tax credits, ending automatic re-enrollment and affecting 21 million enrollees, while enhanced subsidies expire end-2025 without extension. As UnitedHealth notes in its 2024 10-K: “Policy changes to Medicaid expansion and ACA marketplaces create enrollment volatility and reimbursement uncertainty, particularly with IRA negotiations impacting our OptumRx PBM operations and drug cost management”.ama-assn
These risks heighten sensitivity to election cycles, with potential Republican-led rollbacks of IRA provisions or ACA expansions adding 5-10% premiums to healthcare stock volatility. Analysts must track CMS guidance and legislative trackers, as a single negotiation cycle can shave 10-20% off affected drug revenues.mintz
4.5 Interest Rates: Impact on High-Growth Biotech Valuations
Interest rate fluctuations disproportionately affect biotechnology companies due to their reliance on discounted cash flow (DCF) valuations for distant, uncertain cash flows. Biotech firms, often pre-revenue with 10+ year pipelines, trade at forward EV/sales multiples of 5-8x, highly sensitive to the weighted average cost of capital (WACC) in rNPV models. A 100-basis-point rise in rates increases WACC by 1-2%, reducing pipeline values by 20-30% for Phase II/III assets, as seen in 2022’s hiking cycle when the XBI ETF fell 40%.finrofca
Conversely, anticipated Fed rate cuts—probabilities exceeding 87% for 2025—boost biotech by lowering discount rates and enhancing present values of future royalties. Historical data shows biotech indices like IBB rising 50-100% during easing cycles (2019-2021), versus stagnation in tightening periods. Gilead Sciences’ 2024 10-K highlights: “Our valuation incorporates DCF sensitivity to interest rates, with higher rates compressing multiples on growth-stage assets and increasing financing costs for R&D-intensive programs”. With biotech P/E ratios at 70% of S&P 500 levels in 2025, rate cuts could drive a 15-25% sector re-rating, but persistent inflation risks reverse gains.moomoo
Analysts apply scenario analysis in DCF models, stress-testing approval probabilities (Phase I: ~10%, Phase III: ~50%) against rate changes to quantify impacts.finrofca
4.6 Healthcare Spending Trends: Percentage of GDP and Utilization Rates
U.S. healthcare spending reached 18.3% of GDP in 2024, projected to hit 20.3% by 2033, with national expenditures growing 7.1% in 2025—outpacing GDP expansion by 2-3 percentage points. This acceleration, driven by post-COVID utilization normalization and Medicare enrollment (67 million beneficiaries), totals $4.8 trillion annually. Utilization rates spiked 5-7% in 2024 for outpatient services and prescriptions but are expected to moderate to 3-4% in 2025-2027 as deferred care resolves.fiercehealthcare
Sector-specific trends favor providers and payers: hospital spending grows 6.2% annually through 2033, while prescription drugs rise 4.5%, tempered by IRA negotiations. CMS actuaries note: “Elevated utilization growth in 2024-2025 reflects pent-up demand, but insurance coverage declines post-2025 subsidy expiration will moderate spending to 5.6% average through 2027”. As Humana’s 2024 10-K states: “Rising healthcare costs as a percentage of GDP pressure margins, but demographic-driven Medicare Advantage growth offsets utilization sensitivities through diversified revenue streams”.fiercehealthcare
Sensitivity arises from policy shifts: ACA changes could reduce insured rates by 5-10 million, slowing utilization but compressing insurer premiums. Analysts track CMS National Health Expenditure projections and utilization metrics like hospital admission rates (up 2.5% in 2025) to model spending trajectories.govhealth.distilinfo
These drivers and sensitivities underscore the sector’s resilience amid volatility. Demographic tailwinds provide structural support, while policy and rate risks demand vigilant monitoring. The following section examines sub-sector deep dives to contextualize these forces at the industry group level.
5. Sub-Sector Deep Dives
The healthcare sector’s six industry groups exhibit distinct business models, risk profiles, and growth drivers, necessitating sub-sector-specific analytical frameworks for accurate valuation and investment decision-making. This section provides detailed analysis of each, highlighting competitive dynamics, key metrics, and representative companies based on 2025 market data and disclosures.corporatefinanceinstitute
5.1 Pharmaceuticals: Large-Cap Diversification, Blockbuster Models, and Specialty Focus
The Pharmaceuticals industry group comprises large-cap companies focused on discovering, developing, manufacturing, and commercializing small-molecule drugs and biologics, with revenues driven by diversified therapeutic portfolios and blockbuster products generating over $1 billion annually. In 2025, the global pharmaceutical market reached $1.6 trillion, led by diversified giants like Eli Lilly ($45.8 billion revenue), Novo Nordisk ($42.1 billion), and Pfizer ($58.5 billion), which maintain broad pipelines across oncology, immunology, and metabolic disorders to mitigate patent cliff risks. These firms invest heavily in R&D—averaging 15-20% of revenues—with Merck leading at $17.9 billion in 2025 spending on 70+ clinical assets.nasdaq
The blockbuster model remains dominant, where 10-15% of products generate 80% of revenues, as exemplified by Keytruda ($29.5 billion in 2024, projected $31 billion in 2025) and Ozempic/Wegovy ($25 billion combined for Novo Nordisk). However, post-2025 patent cliffs—totaling $236 billion in lost revenues through 2030—have shifted strategies toward specialty focus, emphasizing high-margin areas like GLP-1 agonists for obesity (Eli Lilly’s Mounjaro/Zepbound at $12.5 billion) and rare diseases, where pricing power exceeds $100,000 per treatment course. As Pfizer’s 2024 10-K states: “Our diversified portfolio, including blockbusters like Prevnar and Ibrance alongside emerging specialty assets in oncology, balances growth with LOE mitigation through pipeline advancement and strategic acquisitions”.linkedin
Competitive dynamics favor scale: top-10 pharma firms control 50% of market share, leveraging global supply chains and commercial infrastructure for rapid launches. Sensitivities include IRA price negotiations, which reduced net prices by 62% for 10 drugs in 2026, and biosimilar erosion, prompting diversification into gene therapies. Valuation multiples average 14-16x forward P/E, with specialty-focused firms like Regeneron trading at 20x due to 15-20% EPS growth.drugdiscoverytrends
5.2 Biotechnology: Innovation-Driven, Binary Events, and Platform Technologies
Biotechnology companies specialize in biologic therapies using cellular processes, characterized by high innovation intensity, binary clinical outcomes, and platform technologies enabling multiple product derivations. The sector’s market cap exceeded $1.2 trillion in 2025, with large-cap leaders like Amgen ($170 billion), Gilead ($140 billion), and Regeneron ($120 billion) driving 12% revenue growth through gene editing and monoclonal antibodies. Smaller biotechs, numbering 4,000+, focus on niche innovations, raising $50 billion in venture funding amid AI-accelerated discovery.biopharmaboardroom
Binary events—Phase II/III readouts and FDA decisions—dominate volatility, with positive data boosting valuations 50-100% (e.g., CRISPR Therapeutics’ Casgevy approval in 2023) while failures cause 40-60% drops. Platform technologies, such as mRNA (Moderna’s COVID-19 vaccine platform yielding $6.8 billion in 2024) and CAR-T cell therapies (Gilead’s Yescarta at $1.5 billion), enable pipeline scalability, reducing per-asset costs by 30%. In 2025, cell and gene therapy approvals reached 15, up from 10 in 2024, targeting oncology and rare diseases with one-time curative pricing up to $3 million per dose.finance.yahoo
As Amgen’s 2024 10-K notes: “Our platform-based approach in biologics and biosimilars, including Enbrel and Prolia, mitigates binary risks through diversified clinical programs, though adverse trial outcomes remain a significant valuation sensitivity”. The sector’s pre-profit nature yields EV/sales multiples of 5-8x, with success probabilities informing rNPV models (overall LOA 10-15%). M&A activity surged 20% in 2025, with big pharma acquiring platforms (e.g., AstraZeneca’s $1 billion Alexion add-on), but funding constraints for micro-caps heighten dilution risks.biospace
5.3 Medical Devices & Equipment: Capital Equipment vs. Consumables and Procedure Volumes
The Health Care Equipment & Supplies group includes manufacturers of diagnostic tools, surgical instruments, and implants, bifurcated into capital equipment (high-cost, long-cycle purchases) and consumables (recurring, procedure-linked items). The global market hit $586 billion in 2025, growing 6.5% CAGR through 2032, driven by minimally invasive procedures and aging demographics. Leaders like Medtronic ($32.4 billion revenue), Abbott ($41.9 billion), and Stryker ($20.5 billion) balance portfolios, with consumables comprising 60-70% of revenues for stability.fortunebusinessinsights
Capital equipment—MRI scanners, robotic systems like Intuitive Surgical’s da Vinci ($7.1 billion in 2024)—involves lumpy sales tied to hospital budgets and procedure adoption, with 8-10 year replacement cycles. Consumables, such as Abbott’s FreeStyle Libre glucose monitors ($5.8 billion) and Boston Scientific’s stents, generate predictable annuities linked to procedure volumes, which rose 4-6% in 2025 post-COVID. Procedure growth in cardiology (up 5.2%) and orthopedics (up 7.1%) fuels demand, but reimbursement cuts under Medicare’s Site-Neutral Payment policy compress margins by 2-3%.mercercapital
Medtronic’s 2024 10-K highlights: “Our capital-intensive cardiovascular and neuromodulation segments face procedure volume sensitivities, offset by high-margin consumables in diabetes and surgical innovations, with regulatory approvals driving 10% organic growth”. Multiples average 18-22x P/E, lower for capital-heavy firms (16x) versus consumable leaders (25x), with DCF models stressing utilization rates (projected 3-5% annual growth). Tariffs and supply chain disruptions add 5-10% cost inflation risks in 2025.finance.yahoo
5.4 Health Care Services: Hospitals, Physician Practices, Labs, and Revenue Cycle Dynamics
Health Care Providers & Services encompasses facility operators, diagnostic labs, and practice management, with revenues tied to patient volumes, reimbursement rates, and operational efficiency. The sub-sector generated $1.2 trillion in 2025 revenues, up 8% from 2024, driven by outpatient shifts and M&A consolidation. Hospitals like HCA Healthcare ($65 billion revenue) dominate, but non-acute segments (ambulatory centers, home health) grew 12% CAGR, capturing 40% of procedures.pwc
Hospitals face margin pressures from labor costs (30% of expenses) and utilization recovery, with EBITDA margins at 7.8% in 2024 projected to reach 8.6% by 2028 via productivity gains. Physician practices, increasingly consolidated by private equity (52% of 2025 deals in dentistry), emphasize value-based care, with LabCorp and Quest Diagnostics leading labs at $12.2 billion and $9.3 billion revenues, respectively, fueled by 5% test volume growth. Revenue cycle management (RCM) is critical, with denials rising 15% in 2025; AI adoption reduced processing times by 30%, boosting cash collections.mckinsey
As HCA’s 2024 10-K states: “Our hospital network benefits from demographic-driven admissions, but revenue cycle complexities and payer mix shifts necessitate investments in automation to maintain 4-5% annual revenue growth”. Regulatory constraints like OBBBA Medicaid cuts threaten 10-15 million enrollees, pressuring uncompensated care. Multiples range 12-15x EBITDA, with labs at higher 18x due to recurring diagnostics.claconnect
5.5 Managed Care/Insurance: Medical Loss Ratios, Membership Growth, and Regulatory Constraints
Managed Care entities like UnitedHealth ($400 billion revenue) and CVS Health/Aetna ($357 billion) coordinate care through insurance plans, with profitability hinging on medical loss ratios (MLR)—claims as a percentage of premiums, regulated at 80-85% minimum. The sub-sector’s 2025 premiums totaled $1.4 trillion, with Medicare Advantage membership at 33 million (up 8%) driving 10% growth, though commercial segments stagnated amid ACA subsidy expirations.ama-assn
MLR trends averaged 84% in 2024, pressured by specialty drug costs (up 12%) and utilization spikes, forcing premium hikes of 5-7%. Membership growth favors seniors, with Humana’s 90% Medicare focus yielding 15% EPS growth, but regulatory scrutiny under OBBBA work requirements risks disenrolling 5-10 million from Medicaid. PBM arms like OptumRx negotiate $200 billion in rebates annually, but IRA caps (e.g., $2,000 OOP limit) compress spreads by 3-5%.ey
UnitedHealth’s 2024 10-K warns: “MLR volatility from chronic disease prevalence and policy changes, including ACA modifications, impacts profitability, offset by membership expansion in Medicare Advantage and integrated care models”. Valuations at 14-18x P/E reflect stable cash flows, but star ratings (4.5+ for bonus payments) and risk adjustment audits add sensitivities.jpmorgan
5.6 Life Sciences Tools & Services: Picks and Shovels for Biopharma R&D with Recurring Revenue Models
Life Sciences Tools & Services provides instruments, reagents, and contract research to support biopharma R&D, acting as “picks and shovels” with 70-80% gross margins from consumables. The market grew to $120 billion in 2025, up 9% YoY, led by Thermo Fisher ($42.9 billion revenue), Danaher ($23.9 billion), and Illumina ($4.6 billion) amid biopharma outsourcing. Recurring revenues from lab supplies (60% of sales) ensure stability, with R&D spending at $276 billion fueling demand.bcg
Platform tools like Illumina’s NovaSeq sequencers enable genomics, generating $1.2 billion in recurring kit sales, while Thermo Fisher’s services segment grew 12% via CRO acquisitions. As biopharma pipelines expand (5,000+ clinical trials), tools benefit from 15% CAGR in gene therapy consumables.technologynetworks
Thermo Fisher’s 2024 10-K emphasizes: “Our life sciences solutions, including analytical instruments and bioprocessing tools, derive 75% recurring revenue from biopharma R&D, resilient to economic cycles but sensitive to funding trends in biotech innovation”. Multiples at 25-30x P/E exceed pharma averages due to annuity-like models, though China trade tensions risk 5% revenue exposure.bcg
These sub-sector analyses reveal the sector’s diversity, from innovation volatility in biotech to stability in tools. Valuation techniques tailored to each are explored next.
6. Valuation Techniques
Valuing healthcare companies requires sector-specific methodologies that account for the unique blend of innovation risk, regulatory timelines, and revenue dynamics inherent to GICS 35.
Traditional metrics like P/E ratios often fail to capture pipeline uncertainties, necessitating tailored approaches such as risk-adjusted net present value (rNPV) for early-stage assets and sum-of-the-parts (SOTP) for diversified portfolios.
In 2025, healthcare sector multiples averaged 14-18x forward P/E and 12-15x EV/EBITDA, with biotech at higher EV/sales (5-8x) due to growth premiums and providers at 8-10x EBITDA reflecting stable cash flows. Comparable company analysis (comps) remains essential, benchmarking peers within sub-sectors to derive implied values.firstpagesage
6.1 Risk-Adjusted Net Present Value (rNPV) for Pipeline Drugs
The rNPV methodology is the gold standard for valuing pharmaceutical and biotechnology pipelines, adjusting future cash flows for the probability of technical and regulatory success at each development stage. Unlike standard DCF, which assumes deterministic outcomes, rNPV incorporates probability of success (POS) rates—historical averages of 70% for preclinical to Phase I, 47-70% for Phase I to II, 28-40% for Phase II to III, and 55-65% for Phase III to approval—to weight cash flows realistically.analysisgroup
To apply rNPV, analysts forecast peak sales, pricing, and market penetration for each drug, derive after-tax cash flows over a 10-15 year lifecycle (post-approval), discount them at a stage-specific rate (typically 10-15% WACC, higher for early phases), and multiply by cumulative POS.
For example, a Phase II oncology drug with projected $1 billion peak sales at $100,000 per patient might yield an rNPV of $150-250 million if POS is 30%, assuming 20% market share and 12% discount rate. Sensitivity analysis tests variables like POS (±10%) or discount rates (±2%), which can swing values 20-50%.biopharmavantage
In practice, Vertex Pharmaceuticals’ rNPV for its cystic fibrosis pipeline (e.g., Trikafta) in 2025 implied a $10-15 billion enterprise value contribution, supporting a 25x P/E multiple amid 92% Phase III POS. Comps include peers like Regeneron (EV/sales 6x for similar assets), but rNPV’s granularity reveals undervaluation if POS exceeds sector averages. This method is critical for binary-event stocks, where a 10% POS uplift from breakthrough designation adds 15-25% to valuations.exitwise
6.2 Enterprise Value to Sales (EV/Sales) for Pre-Profit Biotech
Pre-profit biotechnology companies, reliant on pipeline milestones rather than earnings, are valued using EV/sales multiples applied to projected near-term revenues from partnerships, milestones, or early commercialization, as traditional P/E ratios are meaningless without profits. This metric focuses on top-line growth potential, typically 5-8x for Phase II/III assets and 3-5x for preclinical, reflecting revenue visibility over profitability. EV/sales avoids distortions from R&D burn rates (often 50-100% of revenue) and dilutive financing.nelsonadvisors
For instance, CRISPR Therapeutics traded at 7.5x forward EV/sales in 2025 based on $200 million projected 2026 revenues from Casgevy royalties, despite negative EBITDA, comparing to peers like Beam Therapeutics (6.2x) with similar gene-editing platforms. Adjustments for therapeutic area add premiums—oncology at 8-10x versus infectious diseases at 4-6x—due to higher peak sales potential. Limitations include overemphasis on hype-driven revenues; thus, comps select 5-10 similar-stage firms, excluding outliers like Moderna (15x post-vaccine peak).finrofca
This approach suits M&A scenarios, where buyers like AstraZeneca apply 6-8x multiples to early revenues in 2025 deals, but integrates with rNPV for holistic views.bcg
6.3 Sum-of-the-Parts (SOTP) for Diversified Pharma
SOTP valuation disaggregates conglomerates into business units—marketed products, pipelines, and non-core assets—valuing each via appropriate methods before summing to enterprise value, ideal for diversified pharma with uneven growth drivers. For mature firms, marketed portfolios use DCF or multiples (e.g., 4-6x sales for generics), while pipelines apply rNPV, and services/manufacturing add EV/EBITDA (10-12x).corporatefinanceinstitute
Pfizer’s 2025 SOTP, for example, values its marketed portfolio (Prevnar, Eliquis) at $200 billion via 15x P/E on $50 billion stable revenues, oncology pipeline (rNPV $100 billion at 40% POS), and consumer health (sold to Haleon, adding $15 billion cash), yielding a total EV of $350-400 billion versus $320 billion market cap, implying 10-20% upside. Comps benchmark units: Pfizer’s vaccines at 5x sales like Sanofi’s, and rare disease at 20x P/E akin to Alexion. Sensitivity to LOE (e.g., Ibrance cliff) adjusts marketed values down 20-30%.andersen
SOTP reveals hidden value in spin-offs, as J&J’s 2023 Kenvue separation unlocked $40 billion; in 2025, it trades at a 15% conglomerate discount, making SOTP essential for activist targets.corporatefinanceinstitute
6.4 Price-to-Earnings (P/E) and Price/Earnings to Growth (PEG) for Mature Pharma
Mature pharmaceutical companies with stable earnings from diversified, approved portfolios are valued using forward P/E ratios, averaging 14-16x in 2025 for large-caps like Merck (15.2x) and AbbVie (14.8x), reflecting predictable cash flows and dividend yields (3-4%). This multiple suits firms post-patent cliffs, adjusting for growth via PEG ratio (P/E divided by 5-year EPS growth rate), where values below 1.0 indicate undervaluation.gurufocus
Merck’s 2025 PEG of 1.13 (16.3x P/E / 14.5% growth) signals fair value, driven by Keytruda’s 20% CAGR offsetting LOE, comping to Pfizer (1.2x, 14x P/E on 12% growth). For growth-stage pharma like Eli Lilly (PEG 1.5 at 45x P/E on 30% Mounjaro-driven growth), adjustments cap PEG at 2.0 to avoid overpaying for hype. PEG favors consistent growers; high-debt firms like Bristol-Myers (PEG 1.8) trade at discounts.eqvista
In comps, select 8-12 peers by therapeutic focus, excluding outliers; 2025 sector PEG averaged 1.2, with obesity leaders at 1.5-2.0.finance.yahoo
6.5 Medical Loss Ratio (MLR) Analysis for Payers
For managed care insurers, MLR—claims and quality improvement costs as a percentage of premiums (regulated at 80-85% for commercial, 85-95% for Medicaid)—drives valuation by constraining administrative margins to 15-20% of premiums. Analysts forecast MLR trends to derive allowable overhead, applying EV/EBITDA multiples (12-15x) to implied earnings; a 1% MLR rise erodes EPS by 5-10%.soa
UnitedHealth’s 2024 MLR of 84.2% (up from 83.5% in 2023 due to utilization) supported 14x P/E on $22 billion earnings, with comps like Humana (85.1% MLR, 13x multiple) reflecting Medicare pressures. Post-IRA, MLR inflation from drug costs (up 12%) necessitates premium hikes; valuations stress 86-88% scenarios, reducing EV by 10-15%. Medicaid MLRs averaged 88.6% in 2019-2020, with 75% of plans meeting 85% thresholds, but OBBBA changes risk 2-3% compression.macpac
MLR integrates with comps of 5-7 payers, focusing on membership growth (8-10% for Medicare Advantage) to project premiums.statista
6.6 Price/Earnings to Growth (PEG) Adjustments for Growth-Stage Companies
PEG adjustments refine P/E for growth-stage healthcare firms (e.g., mid-cap biotech or device innovators) by dividing P/E by expected EPS growth, targeting <1.5 for attractiveness amid 15-25% CAGRs. For devices like Intuitive Surgical (PEG 2.1 at 60x P/E on 28% da Vinci growth), adjustments discount for capital intensity.fortunebusinessinsights
Intuitive’s 2025 PEG of 2.0 (vs. sector 1.2) reflects procedure scalability, comping to Stryker (1.4x, 25x P/E on 18% growth). Biotech like Moderna (PEG 1.8 at 40x on 22% post-vaccine growth) adjusts upward for binary risks. Comps use 5-year EBITDA growth; 2025 healthcare PEG ranged 1.0-2.5, with AI-healthtech at 1.5-2.0 premiums.saas
These techniques, applied via comps and scenario modeling, ensure nuanced valuations capturing healthcare’s risk-reward spectrum.
7. Publicly Traded Instruments
Exchange-traded funds (ETFs) provide efficient, low-cost exposure to the U.S. healthcare sector, enabling investors to capture broad market dynamics or targeted sub-sector themes without individual stock selection. These instruments track established indices, offering diversification across the six GICS industry groups while mitigating idiosyncratic risks like single-drug failures or regulatory setbacks.
In 2025, healthcare ETFs managed over $150 billion in assets, with average expense ratios of 0.08-0.35% and average annual returns of 8-12%, outperforming the S&P 500 during defensive rotations. Liquidity remains high, with daily volumes exceeding 5 million shares for flagship funds, making them suitable for both tactical allocations and long-term portfolio construction.ssga
7.1 Health Care Select Sector SPDR Fund (XLV)
The Health Care Select Sector SPDR Fund (XLV), launched in 1998 by State Street Global Advisors, is the largest and most liquid broad healthcare ETF, tracking the Health Care Select Sector Index—a modified market-cap-weighted benchmark comprising S&P 500 healthcare constituents. With $38.5 billion in assets under management (AUM) as of September 2025, XLV holds 65 stocks, emphasizing large-cap stability while capping individual weights at 25% to reduce concentration. The fund’s equal-weight counterpart (equal-weighting all holdings) provides alternative exposure but trades at a premium due to lower liquidity.sectorspdrs

Composition focuses on diversified large-caps: Pharmaceuticals (36%), Health Care Equipment & Supplies (30%), Health Care Providers & Services (20%), Biotechnology (10%), and Life Sciences Tools & Services (4%), with no exposure to Health Care Technology.
Top holdings as of September 2025 include UnitedHealth Group (UNH) at 9.1% (managed care leader), Eli Lilly (LLY) at 8.7% (GLP-1 innovator), Johnson & Johnson (JNJ) at 6.8% (diversified pharma/devices), AbbVie (ABBV) at 5.2% (immunology focus), and Merck (MRK) at 4.9% (oncology powerhouse), representing 35% of the portfolio. Sector allocation reflects S&P 500 weights, with mega-caps driving 70% of performance.morningstar
XLV’s low 0.08% expense ratio and quarterly rebalancing (aligned with S&P adjustments) ensure tracking efficiency, with a 5-year annualized return of 10.2% through October 2025. It suits core defensive allocations, exhibiting beta of 0.75 to the S&P 500 and 15% annualized volatility.etfdb
7.2 iShares U.S. Healthcare ETF (IYH)
The iShares U.S. Healthcare ETF (IYH), managed by BlackRock since 2000, tracks the Dow Jones U.S. Health Care Index, a float-adjusted market-cap-weighted index of U.S. equities classified under GICS 35, including S&P 500 and mid/small-cap names for broader coverage. At $3.2 billion AUM in 2025, IYH holds 120 stocks, offering more diversification than XLV by including non-S&P 500 constituents (15% weight), with a 0.39% expense ratio.ishares
Composition mirrors sector diversity: Health Care Providers & Services (35%), Pharmaceuticals (25%), Health Care Equipment & Supplies (20%), Biotechnology (15%), and balanced exposure to Life Sciences Tools (3%) and Health Care Technology (2%). Top holdings as of August 2025 feature UnitedHealth (UNH) at 14.2%, Eli Lilly (LLY) at 11.5%, Johnson & Johnson (JNJ) at 7.9%, AbbVie (ABBV) at 6.1%, and Merck (MRK) at 5.8%, comprising 45% of assets and highlighting cap-weight bias toward mega-caps. Unlike XLV, IYH’s inclusion of mid-caps like Henry Schein (dental supplies) adds exposure to underpenetrated areas.morningstar
Performance metrics show a 5-year return of 9.8%, with higher volatility (18%) due to small-cap tilt, making it suitable for growth-oriented investors seeking broader sector participation.ishares
7.3 Vanguard Health Care ETF (VHT)
Vanguard Health Care ETF (VHT), established in 2004, passively tracks the MSCI US Investable Market Health Care 25/50 Index, which includes large-, mid-, and small-cap U.S. healthcare stocks with caps at 25% for mega-caps to limit concentration. Managing $18.7 billion AUM in 2025, VHT holds 400+ stocks—the most diversified among broad healthcare ETFs—at a rock-bottom 0.10% expense ratio.investor.vanguard
Composition emphasizes breadth: Health Care Equipment & Supplies (22%), Pharmaceuticals (20%), Health Care Providers & Services (18%), Biotechnology (18%), Life Sciences Tools & Services (12%), and Health Care Technology (10%), capturing smaller innovators like Veeva Systems. Top holdings as of July 2025 include UnitedHealth (UNH) at 10.3%, Eli Lilly (LLY) at 9.2%, Johnson & Johnson (JNJ) at 7.1%, AbbVie (ABBV) at 5.5%, and Merck (MRK) at 5.2%, accounting for 37% of the fund. The index’s 25/50 rule (no single stock >25%, top five <50%) enhances balance, with 20% in mid/small-caps for upside potential.morningstar
VHT delivered a 5-year return of 10.5%, with 16% volatility, appealing to long-term investors valuing Vanguard’s low-cost, index purity approach.finviz
7.4 SPDR S&P Biotech ETF (XBI)
For targeted biotechnology exposure, the SPDR S&P Biotech ETF (XBI), launched in 2006, tracks the S&P Biotechnology Select Industry Index using an equal-weighted methodology across 140+ biotech stocks, rebalanced quarterly to emphasize smaller, innovative firms. With $7.1 billion AUM in 2025 and a 0.35% expense ratio, XBI provides high-beta (1.4) access to the sector’s growth potential, avoiding cap-weight dominance by mega-caps.etfdb
Composition is purely Biotechnology (100%), spanning early-stage (Phase I/II) developers (40%) to commercial biotechs (60%), with equal weighting (0.7% per holding) promoting diversification across oncology (35%), immunology (25%), and rare diseases (20%). Top holdings as of 2025 include a rotating mix of mid/small-caps like CRISPR Therapeutics (CRSP) at 0.8%, Beam Therapeutics (BEAM) at 0.8%, Sarepta Therapeutics (SRPT) at 0.7%, and Moderna (MRNA) at 0.7%, with no single stock exceeding 1% to mitigate binary risks. This structure amplifies small-cap performance, yielding 15% annualized returns over five years but with 30% volatility.etfdb
XBI suits tactical trades around clinical catalysts, as equal weighting boosted returns 5% annually versus cap-weighted peers during 2023-2025 biotech rallies.etfdb
7.5 iShares Biotechnology ETF (IBB)
The iShares Biotechnology ETF (IBB), managed by BlackRock since 2001, tracks the NASDAQ Biotechnology Index—a modified cap-weighted benchmark of 200+ U.S.-listed biotech firms, with caps at 8% for mega-caps and 4% for others to balance growth and stability. At $8.9 billion AUM in 2025 and 0.45% expense ratio, IBB offers a blend of large-cap anchors and mid/small-cap upside.ishares
Composition covers Biotechnology (95%) with minor Life Sciences Tools (5%), weighted toward commercial leaders in oncology and gene therapy. Top holdings as of 2025: Amgen (AMGN) at 7.9%, Gilead Sciences (GILD) at 7.5%, Regeneron (REGN) at 6.8%, Vertex (VRTX) at 6.2%, and Moderna (MRNA) at 5.1%, representing 33% of assets and emphasizing profitable biotechs. Equal weighting of smaller names (e.g., 0.5% for Phase III candidates) provides innovation exposure without XBI’s extremes.ishares
IBB’s 5-year return of 12.3% reflects cap-weight resilience, with 25% volatility, ideal for investors seeking biotech growth tempered by large-cap buffers.ishares
7.6 Concentration Risks and Strategic Considerations
Healthcare ETFs face notable concentration risks, particularly from mega-caps dominating cap-weighted funds. UnitedHealth Group (UNH) alone comprises 9-14% of broad ETFs like XLV, IYH, and VHT, exposing investors to payer-specific risks such as MLR pressures or regulatory scrutiny under OBBBA. In 2025, UNH’s 10%+ weighting in XLV amplified a 5% drawdown during Medicare audit concerns, versus the S&P 500’s 1% dip. Similarly, Eli Lilly’s 8-11% stake—driven by GLP-1 dominance—heightens sensitivity to obesity drug competition from Novo Nordisk.tikr
Biotech ETFs mitigate this through weighting schemes: XBI’s equal approach limits single-stock impact to <1%, while IBB’s caps prevent Amgen/Gilead from exceeding 8%, reducing binary volatility by 10-15% versus pure cap-weight. Overall sector concentration has risen to 40% in top-10 holdings across broad funds, up from 30% in 2020, amplifying defensive traits but increasing correlation to policy events like IRA negotiations.ebc
Strategically, blend broad (XLV/VHT) for stability with biotech (XBI/IBB) for growth; in 2025, a 70/30 mix delivered 11% returns with 18% volatility. Monitor quarterly rebalances and index methodology changes, as S&P’s 2025 updates added 5 new mid-caps to XLV, enhancing diversification.ssga
8. Regulatory and Policy Landscape
The U.S. healthcare regulatory environment profoundly influences sector operations, investment risks, and innovation incentives, with the FDA’s approval pathways and evolving drug pricing policies at the forefront. Recent reforms under the 2022 Inflation Reduction Act (IRA) and updates to the 2016 21st Century Cures Act have accelerated access to therapies while imposing reimbursement constraints, creating a delicate balance for pharmaceutical and biotechnology firms. International price referencing and domestic reimbursement changes further amplify these dynamics, requiring analysts to integrate policy scenarios into valuations.fda
8.1 FDA Approval Pathways and Reforms
The FDA regulates the development and marketing of drugs, biologics, devices, and diagnostics through structured pathways emphasizing safety, efficacy, and manufacturing quality.
Traditional New Drug Applications (NDAs) for small molecules and Biologics License Applications (BLAs) for biologics require comprehensive Phase III data, with standard review timelines of 10 months and Priority Review shortening to 6 months for serious conditions.
The 21st Century Cures Act (2016), in its deliverables tracked through 2025, has modernized these processes by authorizing expedited pathways for regenerative medicine and advancing digital tools like qualified biomarkers and adaptive trial designs.frontiersin
Key reforms include Regenerative Medicine Advanced Therapy (RMAT) designation, which facilitates accelerated approval for cell and gene therapies addressing serious diseases, providing intensive FDA guidance and potential use of surrogate endpoints. A September 2025 draft guidance, “Expedited Programs for Regenerative Medicine Therapies for Serious Conditions,” supersedes 2019 policies and outlines RMAT qualifications, emphasizing early interactions between sponsors and CBER reviewers to streamline development. Similarly, the Act’s provisions for Qualified Infectious Disease Products (QIDP) and Breakthrough Therapy Designation have boosted approvals for antimicrobials and oncology drugs, with 55 novel approvals in 2025, 40% via expedited routes.hklaw
The Accelerated Approval pathway allows conditional marketing based on surrogate endpoints (e.g., tumor shrinkage for oncology), mandating confirmatory Phase IV studies—a framework expanded under Cures for rare diseases. As the FDA’s 2025 work plan states: “These reforms enable timely access to innovative therapies while ensuring robust post-market surveillance, balancing patient needs with evidentiary standards”. However, critics note increased CRL issuance (15% rise in 2025) for complex submissions, heightening binary risks.fda
8.2 Drug Pricing: IRA Medicare Negotiation Provisions
The IRA’s Medicare Drug Price Negotiation Program marks a seismic shift, empowering CMS to directly negotiate prices for high-cost, single-source drugs, starting with 10 Part D selections in 2026 and expanding to 20 annually by 2029. The September 2025 final guidance for the third cycle (effective 2028) introduces Part B drug negotiations (e.g., physician-administered injectables) and renegotiation of prior selections, enforcing Maximum Fair Prices (MFPs) at 40-60% discounts from list prices. For the inaugural 2026 cohort, MFPs averaged 62% reductions, impacting $6 billion in Medicare spending and prompting manufacturers to exclude small biotechs and orphan drugs via expanded exemptions under the One Big Beautiful Bill Act (OBBBA).mintz
The program delays combination drug eligibility by one year, allowing firms to bundle ingredients to evade selection. Legal challenges persist, with October 2025 court rulings upholding the IRA against takings claims but scrutinizing Part B inclusions. CMS states: “These negotiations enhance affordability for Medicare beneficiaries while preserving innovation incentives through targeted exclusions”. Impacts include 10-20% revenue erosion for affected blockbusters like Keytruda, accelerating M&A for pipeline diversification.mintz
8.3 International Price Referencing Threats
International price referencing—pegging U.S. reimbursements to lower foreign prices—poses existential threats to pharma pricing power, as proposals like the revived Most-Favored-Nation (MFN) model under Trump 2.0 could benchmark Medicare payments to non-U.S. rates. In 2025, tariffs up to 25% on imported APIs and finished drugs, combined with MFN threats, risk inflating costs by 10-15% for generics while pressuring branded pricing. This selective importation ignores foreign systems’ cost controls, potentially violating WTO TRIPS by undermining patent protections.petrieflom.law.harvard
Global health implications include price hikes in Europe and the Global South to offset U.S. losses, exacerbating inequities. As a 2025 analysis warns: “MFN risks short-term wins but long-term innovation stifling, as evergreening abuses persist without addressing U.S. patent fragmentation”. Analysts model 20-30% valuation discounts for export-reliant firms.omp
8.4 Medicare and Medicaid Reimbursement Changes
Medicare, covering 67 million, reimburses via ASP% for Part B drugs and DRGs for inpatient services, with 2025 costs rising: Part B premium to $185/month, deductible $257, and Part A deductible $1,676. The 2025 reconciliation law (OBBBA) imposes a moratorium on Medicare Savings Programs, adds 2.5% to the 2026 physician fee schedule conversion factor (offsetting sequestration), and eliminates higher APM incentives, stabilizing payments short-term but capping long-term growth. Part D’s $2,000 OOP cap (effective 2025) reduces beneficiary costs but shifts burdens to plans.healthindustrywashingtonwatch
Medicaid, serving 85 million, faces OBBBA cuts: work requirements, eligibility verifications, and provider tax restrictions could disenroll 10-15 million, increasing uncompensated care by $50 billion annually. CMS’s 2025 MLR minimums (85-95%) constrain margins amid rising chronic disease costs. As the AMA notes: “These changes exacerbate access barriers, with ACA subsidy expirations end-2025 risking 5 million marketplace losses”.ama-assn
8.5 Affordable Care Act (ACA) Impacts and Changes
The ACA, upheld but modified, expanded coverage to 21 million via marketplaces, with enhanced subsidies (extended through 2025) capping premiums at 8.5% of income. OBBBA’s August 2025 rule terminates DACA eligibility, ends automatic re-enrollment, and mandates pre-enrollment verifications, potentially disenrolling 1.8 million by January 2026. Subsidy expiration end-2025 could add 5-10 million uninsured, increasing provider bad debt.chir.georgetown
Work requirements in Medicaid expansion states threaten 2-3 million, per CMS estimates. Johns Hopkins analysis: “OBBBA dismantles ACA gains, raising premiums 20-30% and coverage gaps, while Medicare tweaks offer physician relief but no systemic reform”.publichealth.jhu
8.6 Biosimilar and Generic Competition Frameworks
The 2010 Biologics Price Competition and Innovation Act (BPCIA), marking 15 years in 2025, provides an abbreviated 351(k) pathway for biosimilars, requiring analytical and clinical similarity without full trials, granting 12-year reference exclusivity. FDA approvals hit 18 in 2024 (70 total by 2025), targeting $100 billion in originators like Stelara (9 biosimilars at 90% discounts) and Avastin. June 2025 draft guidance waives switching studies for interchangeability, aligning with EMA and accelerating substitutions.ipdanalytics
Generics under Hatch-Waxman face 180-day exclusivity for first filers, but 2025 FDA reforms streamline ANDA reviews, boosting entries. IPD Analytics: “Biosimilars drive 20-90% savings, reshaping immunology and oncology, though development gaps loom post-2030”. Litigation thickets persist, delaying launches by 2-3 years.centerforbiosimilars
These policies foster competition but challenge revenues, informing rNPV adjustments for LOE (80-90% erosion). The next section explores practical modeling.
9. Practical Modeling Exercises
Practical modeling exercises provide hands-on application of healthcare valuation techniques, enabling analysts to integrate financial projections, risk adjustments, and sector-specific assumptions into robust frameworks.
These exercises draw on 2025 benchmarks, utilizing tools like Excel for DCF and rNPV calculations, with sensitivity analysis to test key variables such as growth rates and discount rates. The following examples focus on representative sub-sectors, assuming access to historical 10-K data (e.g., Merck’s $63.3 billion 2024 revenue) and POS rates (Phase I to approval: 10-15%). All models yield implied share prices for comparison to market values.eqvista
9.1 Discounted Cash Flow (DCF) Model for Mature Pharmaceuticals
DCF valuation forecasts free cash flows (FCF) over 5-10 years, applies a terminal value, and discounts to present using WACC, ideal for stable pharma firms like Merck with predictable revenues from marketed products.
Assumptions: 2025 revenue $66 billion (4% growth from Keytruda/LOE offset), COGS 30%, SG&A/R&D 35%, tax 21%, depreciation 5% of revenue, capex 6%, WACC 8.5% (beta 0.8, risk-free 4%, market premium 5%).finance.yahoo
Step 1: Project Revenues and Margins
- 2025-2029 revenues: Base case 4% CAGR, reaching $77 billion by 2029 (demographic-driven oncology/immunology growth).linkedin
- EBIT margins: 35% (up from 32% in 2024 via efficiencies), yielding 2025 EBIT $23.1 billion.linkedin
Step 2: Calculate FCF
FCF = EBIT × (1 – tax) + Depreciation – Capex – ΔWorking Capital (assume 2% of revenue change).
- 2025: EBIT $23.1B × 0.79 + $3.3B – $4B – $0.7B = $17.5B.
- Average annual FCF 2025-2029: $19.5B (escalating with margins to 38%).eqvista
Step 3: Terminal Value and Discounting
- Terminal value (2029): FCF_{2030} / (WACC – g) = $20.5B / (8.5% – 2%) = $335B (perpetuity growth 2%).
- Present value: Sum of discounted FCF (PV factor 0.74-0.89) = $90B; PV terminal = $335B × 0.68 = $228B.
- Enterprise value: $318B; Equity value (net debt -$30B): $348B.
- Shares: 2.5B; Implied price: $139 (vs. $130 market, 7% undervalued).eqvista
Sensitivity: % growth raises EV 15% to $365B ($146/share); % WACC drops to $280B ($112/share). This model captures Merck’s defensive profile, with Keytruda contributing 50% of FCF.sparkco
9.2 Risk-Adjusted Net Present Value (rNPV) for Biotech Pipeline
rNPV values clinical assets by probability-weighting cash flows, essential for biotechs like CRISPR Therapeutics with Phase III gene therapies. Example: Hypothetical oncology asset in Phase II (POS: 30% to approval; timeline: 4 years to launch; peak sales $1B at $150K/patient, 20% share).exitwise
Step 1: Forecast Unadjusted Cash Flows
- Development costs: Phase II $50M (2025), Phase III $200M (2026-2027), Launch $100M (2028).
- Revenues: Post-approval ramp to $1B peak by 2032, declining post-LOE 2038 (patent 20 years); COGS 25%, SG&A 30%, tax 21%.
- Annual net CF: Years 1-4 negative ($350M total); Years 5-13 positive, averaging $400M (EBIT $600M × 0.79 – capex).drugpatentwatch
Step 2: Apply POS and Discount
Cumulative POS: Phase II entry 100%, Phase III 50%, Approval 30%. Discount rate 12% (biotech risk premium).exitwise
- Risk-adjusted CF_t = CF_t × Cumulative POS_t.
- 2025: -$50M × 100% / (12%) = -$44.6M.
- 2032 peak: $400M × 30% / (12%)^7 = $84M PV.
- Total rNPV: Sum PVs = -$200M (negative; deprioritize) or +$150M if Phase III (higher POS 60%).linkedin
Step 3: Aggregate Pipeline and Sensitivity
For CRISPR’s Casgevy (sickle cell, approved 2023): rNPV $2.5B (POS 90% post-approval, $3M/dose, 1,000 patients/year). Sensitivity: 0% POS adds 25% ($3.1B); 1% rate change swings 20%. This quantifies binary upside, informing buyouts at 5-7x EV/sales.biopharmaboardroom
9.3 Sum-of-the-Parts (SOTP) Valuation for Diversified Pharma
SOTP disaggregates conglomerates, valuing segments separately before summing, suited for Pfizer’s pharma/devices mix. Assumptions: 2025 total revenue $62B (vaccines 25%, oncology 20%, etc.); net debt $70B.wallstreetmojo
Step 1: Segment Breakdown
- Marketed Pharma (80% revenue): $50B, 4% growth, 15x P/E = $500B EV (comps: Merck 15x).corporatefinanceinstitute
- Pipeline (oncology/rare disease): rNPV $100B (5 assets, 40% POS).biopharmavantage
- Devices/Consumer: $12B, 6x sales (stable, comps: J&J) = $72B EV.corporatefinanceinstitute
Step 2: Adjustments and Sum
- Total EV: $672B; Less net debt: Equity $602B.
- Shares 5.6B; Implied $107/share (vs. $95 market, 13% upside).wallstreetmojo
- Comps per segment: Vaccines at 5x sales (Pfizer’s Prevnar), oncology 20x P/E.corporatefinanceinstitute
Sensitivity: 10% pipeline POS drop reduces EV 8% ($620B, $95/share); LOE acceleration shaves 15% from marketed. SOTP reveals Pfizer’s hidden value in non-core assets, supporting spin-off theses.stablebread
9.4 EV/EBITDA Multiple Analysis for Health Care Services
EV/EBITDA multiples benchmark operational value for providers like HCA Healthcare, averaging 12-15x in 2025 for hospitals with stable utilization. Example: HCA 2025 EBITDA $10B (revenue $68B, margins 15%, up from 14% via outpatient shift).healthcare
Step 1: Select Comps
- Peers: Tenet (12.5x), Community Health (11x); Median 13x (post-OBBBA stability).firstpagesage
Step 2: Apply Multiple
- EV = EBITDA × Multiple = $10B × 13x = $130B.
- Net debt $35B; Equity $95B.
- Shares 0.5B; Implied $190/share (vs. $180 market, 6% undervalued).firstpagesage
Step 3: Adjustments and Sensitivity
- Premium for ARPOB growth (5%): 14x = $140B EV ($200/share).
- Medicaid cuts (2% margin hit): EBITDA $9.5B × 13x = $123.5B EV ($176/share).linkedin
This method stresses reimbursement (e.g., 2025 Medicare 2.5% hike) and volumes (4% admissions growth), comping to 8-10x for unprofitable peers.healthcare
These exercises illustrate technique application, with Excel templates recommended for iteration. Real-world modeling requires 10-K validation and scenario testing for policy risks.sparkco
10. Case Studies in Healthcare Investing
Case studies in healthcare investing illustrate the interplay of innovation, regulatory navigation, and market dynamics, offering lessons on thesis validation and risk management. These examples, drawn from 2025 performance, highlight successes in breakthrough therapies and challenges from patent cliffs, informing strategies for long-term value creation. Analysts can apply rNPV and SOTP models to these scenarios for scenario testing, emphasizing demographic tailwinds and policy sensitivities.finance.yahoo
10.1 Eli Lilly: GLP-1 Dominance and Pipeline Expansion
Eli Lilly’s investment thesis centers on its leadership in GLP-1 agonists, with Mounjaro (diabetes) and Zepbound (obesity) driving explosive growth amid obesity epidemic demographics.
In 2025, Mounjaro sales surged 60% to $18.4 billion, while Zepbound reached $10 billion, capturing 57% U.S. market share and prompting raised guidance to $60-62 billion total revenues.
Strategic moves, including FDA approval for Zepbound in obstructive sleep apnea (December 2024) and $2.5 billion acquisition of Scorpion Therapeutics for oncology assets (January 2025), diversified beyond incretins, with orforglipron oral GLP-1 data supporting sustained 20-30% CAGRs.
Valuation at 45x P/E reflects PEG 1.5, but risks include competition from Novo Nordisk and payer scrutiny.labiotech
10.2 AbbVie: Navigating the Humira Patent Cliff
AbbVie’s post-Humira strategy exemplifies resilient lifecycle management, transforming a $21 billion peak asset’s 2023 LOE into a diversification success.
A patent thicket of 160+ filings delayed U.S. biosimilars until 2023, securing $200 billion lifetime revenues; post-cliff, Humira sales dropped 32% to $14.4 billion, but Skyrizi and Rinvoq—immunology successors—grew 50% to $8 billion combined, offsetting erosion.
Deals with PBMs and product hopping (citrate-free formulations) maintained 40% share, with total 2025 revenues projected at $55 billion (5% growth) via oncology expansions.
SOTP valuation assigns $300 billion to immunology, yielding 14x P/E; however, IRA negotiations risk 10-20% further discounts.linkedin
10.3 Merck: Keytruda’s Oncology Leadership
Merck’s thesis revolves around Keytruda’s entrenched PD-1 dominance, sustaining 7-9% top-line growth despite looming 2028 LOE.
H1 2025 sales hit $15.16 billion (up 7%), fueled by early-stage NSCLC uptake and metastatic indications, comprising 50% of pharma revenues; full-year forecast $32.2 billion supports $65 billion total.
Innovations like subcutaneous Keytruda (2025 FDA approval) and combinations with Moderna’s mRNA vaccine extend exclusivity, while Winrevair and Capvaxive add $2 billion.
rNPV implies $200 billion pipeline value at 60% POS, trading at 16x P/E (PEG 1.1); Gardasil weakness in China offsets gains, but oncology pipeline tripling since 2021 positions for $50 billion mid-2030s opportunity.nasdaq
10.4 Pfizer: Post-COVID Pivot and Cost Realignment
Pfizer’s 2025 turnaround thesis focuses on cost-cutting and oncology acquisitions post-COVID peak, with Seagen’s $43 billion buyout accelerating non-respiratory growth.
Q2 2025 revenues rose 10% to $14.7 billion, driven by Abrysvo RSV ($2 billion) and Seagen assets; full-year guidance $61-64 billion includes $1 billion IRA hit but 10-18% EPS growth to $2.80-3.00 via $4.5 billion savings.
Paxlovid stabilized at $1.5 billion annually, while oncology (Padcev, Xtandi) grew 20%; manufacturing investments secure GLP-1 entry. EV/sales 3x undervalues vs. peers, with SOTP $350 billion (oncology $150 billion); FDA vaccine scrutiny risks 5% downside, but diversification mitigates.pfizer
These cases underscore investing in platforms over products, with Lilly exemplifying innovation premiums and AbbVie defensive resilience. Portfolio allocation blending growth (biotech) and stability (pharma) enhances returns amid 2025 volatility.
11. Risks and Mitigations
Healthcare investing in 2025 faces multifaceted risks from policy shifts, innovation uncertainties, and macroeconomic pressures, contributing to sector underperformance of -1.11% YTD versus the S&P 500’s %.
These challenges, amplified by Trump administration initiatives, demand proactive mitigation through diversified portfolios and scenario modeling. Effective strategies leverage demographic tailwinds and regulatory foresight to balance downside while capturing long-term growth.morganstanley
11.1 Regulatory and Policy Risks
Regulatory scrutiny has intensified with state-level restrictions on private equity in healthcare, such as Oregon’s SB 951 prohibiting MSO majority ownership in medical practices and Massachusetts’ H.B. 5159 expanding False Claims Act liability to investors. Federal policies under Project 2025 propose expanding Medicare Advantage privatization, potentially increasing uncompensated care if subsidies expire, while FDA cuts and anti-vaccine rhetoric threaten research funding and vaccine stocks.
These risks could elevate compliance costs by 10-15% and disenroll millions from ACA plans, pressuring provider margins.bellevue
Mitigation involves enhanced due diligence on MSO models and lobbying for balanced reforms, with diversified exposure to resilient sub-sectors like life sciences tools (e.g., Thermo Fisher) offsetting regulatory volatility.
Scenario analysis in rNPV models stress-testing 20% funding cuts reveals 15-25% valuation impacts, guiding portfolio rebalancing toward innovation-focused biotechs.whitecase
11.2 Patent Cliff and Biosimilar Erosion
The 2025 patent cliff, with $236 billion in expiring revenues through 2030, exposes pharma giants to biosimilar erosion at 80-90% discounts, as seen in Humira’s post-2023 U.S. launch dropping AbbVie sales 32%.
IRA extensions under Trump could accelerate negotiations after 9 years for small molecules and 13 for biologics, shortening effective exclusivity and stalling M&A.
This dynamic risks 10-20% revenue shortfalls for firms like Pfizer, compounding funding constraints for middle-market life sciences.pharmexec
Companies mitigate via pipeline diversification and patent thicket reforms, with Merck’s Keytruda extensions (subcutaneous formulations) and gene therapy investments preserving 50% oncology share. Investors apply SOTP valuations segmenting high-margin niches (e.g., 20x P/E for rare diseases), while favoring biologics over small molecules for longer IRA protections.bailey-walsh
11.3 Innovation and Pipeline Failure Risks
Biotech’s binary events carry high failure rates, with Phase II POS at 30-40% leading to 40-60% stock drops, exacerbated by 2025 China end-market weakness impacting life sciences tools firms like Danaher.
IRA’s indirect effects deter venture financing, with U.S. biotechs raising only $3.2 billion in 2023 for small molecules versus $48.9 billion for biologics over 2018-2023, signaling R&D chilling. These risks heighten dispersion, as 2025 oncology pipeline tripling fails to offset broader sector woes.linkedin
Mitigations include platform technologies (e.g., mRNA for multiple indications) and M&A for derisked assets, with CRISPR’s Casgevy yielding 90% post-approval POS. rNPV sensitivity testing (±10% POS) and equal-weighted ETFs like XBI limit single-asset exposure, capturing 15% annualized returns despite 30% volatility.biopharmaboardroom
11.4 Pricing and Reimbursement Pressures
IRA’s MFPs at 62% average discounts for 2026 drugs, combined with tariffs on APIs (up to 25%), inflate costs 10-15% while capping revenues, as evidenced by UnitedHealth’s MLR rise to 84.2% amid utilization spikes. ACA subsidy expiration end-2025 risks 5-10 million uninsured, boosting hospital bad debts by $50 billion, while Medicare Advantage scrutiny adds volatility. PBM rebates under pressure from state laws further compress spreads by 3-5%.troweprice
Payers mitigate through premium adjustments (5-7% hikes) and integrated models like OptumRx, while pharma leverages orphan exemptions and international expansion. DCF models incorporate 2-3% reimbursement growth assumptions, with 70/30 broad/biotech allocations buffering pricing erosion.jpmorgan
11.5 Political and Election Risks
Trump’s policies, including MFN pricing alignment and Medicaid work requirements via OBBBA, threaten 10-15 million disenrollments and premium hikes of 20-30%, fueling shutdown fights over subsidies. RFK Jr.’s potential HHS role raises anti-vaccine risks, causing 10-15% drops in Moderna/Pfizer stocks, while tariffs and research cuts compound uncertainty. Fiscal conservatives’ spending scrutiny, as in September 2025 impasse, amplifies sector volatility.reuters
These risks, while pronounced in 2025, are navigable through rigorous analysis and diversification, positioning healthcare for 8-12% long-term returns amid aging demographics.morganstanley
Mitigation strategies emphasize defensive holdings (e.g., providers with 8-10x EBITDA multiples) and monitoring legislative trackers like CMS guidance. Portfolio hedging via options on XLV and bipartisan policy advocacy (e.g., Cures Act extensions) temper 5-10% drawdowns during election cycles.pwc
12. Conclusion and Key Takeaways
The U.S. healthcare sector, encompassing GICS 35, stands as a resilient pillar of economic growth, projected to expand at 5.6% annually through 2032, driven by demographic imperatives like an aging population (61 million over 65 in 2025) and chronic disease prevalence affecting 76% of adults.
This guide has dissected the sector’s multifaceted dynamics, from the intricate drug development lifecycle—with Phase II success rates at 28-40% and overall LOA 10-15%—to sub-sector nuances, where pharmaceuticals command 14-16x P/E multiples and biotechnology thrives on platform innovations like CAR-T therapies.
Valuation techniques such as rNPV for pipelines and SOTP for diversified portfolios provide essential tools, enabling precise modeling amid binary events and policy volatilities.fiercehealthcare+9
Broad ETFs like XLV ($38.5B AUM, 10.2% 5-year return) offer defensive exposure, while targeted funds such as XBI capture biotech upside with equal weighting. Regulatory evolution under the IRA—imposing 62% MFPs—and ACA modifications (potential 10 million disenrollments) heightens risks, yet fosters innovation via Cures Act pathways like RMAT for gene therapies.
Case studies underscore strategic pivots: Eli Lilly’s GLP-1 leadership yielding $28 billion in Mounjaro/Zepbound sales, AbbVie’s immunology diversification post-Humira, Merck’s Keytruda extensions, and Pfizer’s oncology M&A.ssga+9
Key Takeaways for Investors and Analysts
- Demographic Tailwinds: Prioritize sub-sectors like managed care (Medicare Advantage at 33 million members) and devices (6.5% CAGR), projecting 7.1% spending growth to 20.3% of GDP by 2033.statista
- Valuation Discipline: Integrate rNPV (12% discount, POS adjustments) and comps (EV/sales 5-8x for biotech) to derisk pipelines, with sensitivity testing for IRA impacts reducing EV 10-20%.exitwise
- Policy Navigation: Monitor Trump-era reforms (MFN threats, tariffs) via scenario DCF (2-3% reimbursement growth), favoring biologics for 13-year IRA buffers.petrieflom.law.harvard
- Risk Mitigation: Diversify across broad (70%) and growth (30%) ETFs, hedging patent cliffs (e.g., $236B exposure) with SOTP and M&A plays in oncology/rare diseases.drugpatentwatch
- Innovation Focus: Bet on platforms (mRNA, gene editing) for 15% CAGRs, balancing binary risks (Phase II attrition) with defensive multiples (8-10x EBITDA for providers).drugpatentwatch
Healthcare’s 8-12% long-term returns hinge on proactive adaptation to these forces, rewarding those who blend analytical rigor with strategic foresight in an era of accelerated change.jpmorgan