How to Build an S&P 500 Stock Screener with Python
Stock screeners are powerful tools for investors, helping to filter thousands of stocks down to a manageable list based on specific criteria. Building your own screener allows for maximum customization. In this post, we’ll walk through creating a basic stock screener for the S&P 500 universe using Python, leveraging libraries like pandas and yfinanceto fetch and analyze real market data. We’ll get the list of S&P 500 companies directly from Wikipedia.
What You’ll Need:
- Python installed
- Required libraries:
pandas,yfinance,requests,lxml,beautifulsoup4(You can install them using pip:pip install pandas yfinance requests lxml beautifulsoup4)
Step 1: Get the List of S&P 500 Tickers from Wikipedia
First, we need the current list of companies in the S&P 500 index. Wikipedia hosts a frequently updated table that we can scrape programmatically using Python. The pandas library has a convenient function, read_html, that can parse HTML tables directly into DataFrames.
import pandas as pd

def get_sp500_tickers():
    """
    Scrapes the Wikipedia page for the list of S&P 500 companies and returns a list of tickers.
    """
    # URL of the Wikipedia page listing S&P 500 companies
    url = 'https://en.wikipedia.org/wiki/List_of_S%26P_500_companies'
    print(f"Attempting to fetch S&P 500 tickers from: {url}")

    try:
        # pandas read_html returns a list of DataFrames found on the page
        # The S&P 500 components table is usually the first one
        tables = pd.read_html(url)
        sp500_table = tables[0]

        # The ticker symbols are typically in the 'Symbol' column
        # Clean up potential naming variations ('Symbol', 'Ticker symbol', etc.)
        if 'Symbol' in sp500_table.columns:
             tickers = sp500_table['Symbol'].tolist()
             # Sometimes tickers might have suffixes (e.g., 'BF.B'), handle as needed
             # Basic cleaning: remove potential '.B' or similar if problematic for yfinance
             # tickers = [ticker.replace('.', '-') for ticker in tickers] # Example adjustment
             print(f"Successfully fetched {len(tickers)} tickers.")
             return tickers
        else:
             print("Could not find the 'Symbol' column in the table.")
             # Fallback: Try finding the column by index if needed, or investigate table
             # Example: ticker_column_index = 0 # Adjust if necessary
             # tickers = sp500_table.iloc[:, ticker_column_index].tolist()
             # print(f"Attempted fetch via index, got {len(tickers)} tickers.")
             # return tickers
             return [] # Return empty list if column not found

    except Exception as e:
        print(f"Error fetching or parsing S&P 500 tickers: {e}")
        return [] # Return an empty list in case of error

# Get the tickers
sp500_tickers = get_sp500_tickers()

# Display the first few tickers as a check
if sp500_tickers:
    print("\nFirst 5 S&P 500 Tickers:")
    print(sp500_tickers[:5])
else:
    print("\nCould not retrieve S&P 500 tickers.")
Explanation:
- We import the
pandaslibrary. - The function
get_sp500_tickersfetches the HTML content from the Wikipedia page (List of S&P 500 companies). pd.read_html(url)parses all tables on the page into a list of DataFrames. We assume the first table (tables[0]) contains the S&P 500 constituents.- We extract the ‘Symbol’ column, which contains the stock tickers, and convert it to a Python list.
- Error handling is included in case the page structure changes or the URL becomes invalid.
- Some basic ticker cleaning might be needed (like replacing ‘.’ with ‘-‘ for certain symbols) depending on the requirements of the data provider (
yfinance).
Step 2: Fetch Financial Data with yfinance
Now that we have the tickers, we need to fetch financial data for each company. The yfinance library is excellent for accessing historical market data and company fundamentals from Yahoo Finance.
import yfinance as yf
import pandas as pd
def get_stock_data(tickers, period="1y"):
"""
Fetches historical data and basic info for a list of tickers using yfinance.
Returns a dictionary where keys are tickers and values are yfinance Ticker objects.
"""
stock_data = {}
print(f"\nFetching data for {len(tickers)} tickers...")
count = 0
for ticker_symbol in tickers:
try:
stock = yf.Ticker(ticker_symbol)
# Fetch history (adjust period as needed)
# hist = stock.history(period=period) # Fetch historical prices if needed later
# Fetch basic info (includes market cap, P/E, etc.)
info = stock.info
if info and 'symbol' in info and info['symbol'] == ticker_symbol:
stock_data[ticker_symbol] = info
count += 1
print(f" Fetched data for {ticker_symbol} ({count}/{len(tickers)})")
else:
print(f" Could not fetch valid info for {ticker_symbol}. Skipping.")
except Exception as e:
print(f" Error fetching data for {ticker_symbol}: {e}")
continue # Skip to the next ticker on error
print(f"\nSuccessfully fetched data for {len(stock_data)} tickers.")
return stock_data
# Assuming sp500_tickers is populated from Step 1
if sp500_tickers:
all_stock_data = get_stock_data(sp500_tickers)
# Display data for one stock as a check
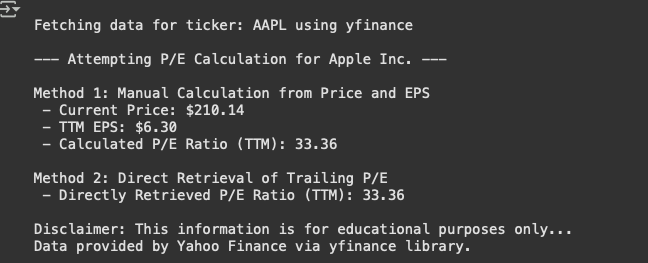
if all_stock_data and 'AAPL' in all_stock_data: # Check if AAPL data exists
print("\nSample Data for AAPL:")
aapl_data = all_stock_data['AAPL']
print(f" Market Cap: {aapl_data.get('marketCap')}")
print(f" P/E Ratio: {aapl_data.get('trailingPE')}")
print(f" Sector: {aapl_data.get('sector')}")
elif all_stock_data:
print("\nSample data check (first available stock):")
first_ticker = list(all_stock_data.keys())[0]
print(f" Ticker: {first_ticker}")
print(f" Market Cap: {all_stock_data[first_ticker].get('marketCap')}")
print(f" P/E Ratio: {all_stock_data[first_ticker].get('trailingPE')}")
else:
print("\nSkipping data fetching as ticker list is empty.")Explanation:
- We import
yfinanceasyf. - The
get_stock_datafunction iterates through our list oftickers. yf.Ticker(ticker_symbol)creates a Ticker object for each stock.stock.infofetches a dictionary containing various fundamental data points likemarketCap,trailingPE(Price-to-Earnings ratio),sector,forwardPE,dividendYield, etc. (Note: Available fields can vary). We add a check (if info and 'symbol' in info...) to ensure valid data was returned.- We store the fetched
infodictionary for each ticker inall_stock_data. - Error handling is included for tickers that might fail (e.g., delisted, data unavailable).
- Fetching data for all 500+ stocks can take several minutes due to rate limits and network requests. You might want to add delays (
time.sleep) or fetch data in batches.
Step 3: Define Screening Criteria
This is where you decide what characteristics you’re looking for in a stock. Criteria can be based on:
- Valuation: P/E ratio, Price-to-Book (P/B), Price-to-Sales (P/S), PEG ratio.
- Profitability: Return on Equity (ROE), Return on Assets (ROA), Profit Margins.
- Growth: Revenue Growth, Earnings Growth.
- Size: Market Capitalization.
- Dividends: Dividend Yield, Payout Ratio.
- Technical Indicators: Moving Averages, Relative Strength Index (RSI).
For this example, let’s define a simple screen which makes little sense in the real world. However, it allows to keep things simple:
- Market Cap: Greater than $10 Billion (Large-cap stocks).
- P/E Ratio: Less than 20 (Potentially undervalued).
- Sector: Not in ‘Financials’ (Example exclusion).
Step 4: Implement the Screener Logic
Now we apply our criteria to the data we fetched.
def screen_stocks(stock_data, min_market_cap=10e9, max_pe=20, excluded_sector='Financials'):
    """
    Filters the fetched stock data based on screening criteria.
    Returns a list of tickers that pass the screen.
    """
    passed_screen = []
    print(f"\nScreening {len(stock_data)} stocks...")
    print(f"Criteria: Market Cap > ${min_market_cap/1e9:.0f}B, P/E < {max_pe}, Sector != {excluded_sector}")

    for ticker, info in stock_data.items():
        try:
            # Safely get values, using .get() with default to avoid errors if key is missing
            market_cap = info.get('marketCap')
            pe_ratio = info.get('trailingPE')
            sector = info.get('sector')

            # --- Apply Screening Criteria ---
            # Check 1: Market Cap (ensure not None)
            if market_cap is None or market_cap <= min_market_cap:
                # print(f"  {ticker}: Fails Market Cap ({market_cap})")
                continue # Skip to next stock

            # Check 2: P/E Ratio (ensure not None and positive)
            if pe_ratio is None or pe_ratio <= 0 or pe_ratio >= max_pe:
                # print(f"  {ticker}: Fails P/E Ratio ({pe_ratio})")
                continue # Skip to next stock

            # Check 3: Excluded Sector (ensure not None)
            if sector is None or sector == excluded_sector:
                # print(f"  {ticker}: Fails Sector ({sector})")
                continue # Skip to next stock

            # If all checks pass:
            print(f"  {ticker}: Passed Screen (MCap: {market_cap/1e9:.1f}B, P/E: {pe_ratio:.2f}, Sector: {sector})")
            passed_screen.append(ticker)

        except Exception as e:
            print(f"  Error screening {ticker}: {e}")
            continue

    print(f"\nScreening complete. Found {len(passed_screen)} stocks matching criteria.")
    return passed_screen

# Assuming all_stock_data is populated from Step 2
if 'all_stock_data' in locals() and all_stock_data:
    screened_tickers = screen_stocks(all_stock_data, min_market_cap=10e9, max_pe=20, excluded_sector='Financials')
else:
    print("\nStock data not available for screening.")
    screened_tickers = []
Explanation:
- The
screen_stocksfunction takes the dictionary of stock data and our criteria as input. - It iterates through each
tickerand its correspondinginfodictionary. - Inside the loop, it retrieves
marketCap,trailingPE, andsectorusing.get()to handle cases where data might be missing (None). - It then applies the defined criteria using
ifconditions. Note the checks forNoneand sensible values (e.g., P/E > 0). - If a stock fails any criterion,
continueskips to the next ticker. - If a stock passes all criteria, its ticker is added to the
passed_screenlist.
Step 5: Display Results
Finally, let’s show the list of stocks that passed our screen.
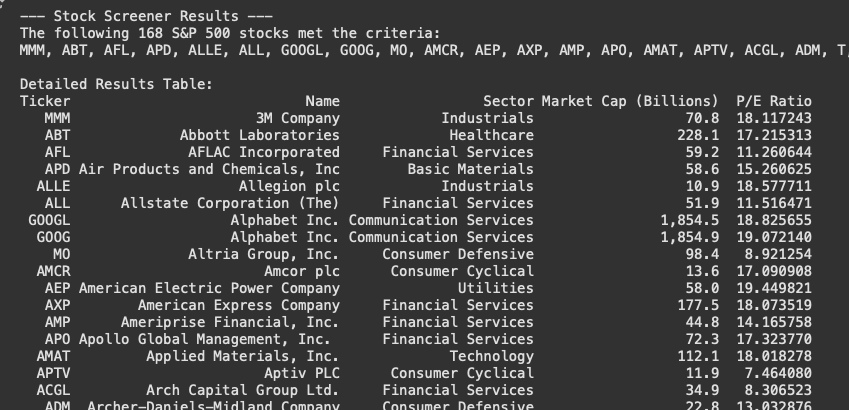
print("\n--- Stock Screener Results ---")
if screened_tickers:
    print(f"The following {len(screened_tickers)} S&P 500 stocks met the criteria:")
    # Print tickers comma-separated for brevity
    print(", ".join(screened_tickers))

    # Optional: Create a DataFrame for better display
    results_data = []
    for ticker in screened_tickers:
         info = all_stock_data[ticker]
         results_data.append({
              'Ticker': ticker,
              'Name': info.get('shortName'),
              'Sector': info.get('sector'),
              'Market Cap (Billions)': info.get('marketCap', 0) / 1e9,
              'P/E Ratio': info.get('trailingPE')
         })
    results_df = pd.DataFrame(results_data)
    print("\nDetailed Results Table:")
    print(results_df.to_string(index=False, formatters={'Market Cap (Billions)': '{:,.1f}'.format}))

elif 'all_stock_data' in locals() and all_stock_data:
     print("No stocks passed the screening criteria.")
else:
     print("Screening could not be performed (no data).")

print("\n----------------------------")
Explanation:
- We simply print the list of tickers stored in
screened_tickers. - Optionally, we can gather the key data points for the passing stocks back into a pandas DataFrame for a nicely formatted table output using
to_string.
The outcome of the code should look similar to the one below:
Conclusion and Next Steps
You’ve successfully built a basic S&P 500 stock screener using Python! This framework allows you to:
- Get current constituents: Automatically fetch the S&P 500 list.
- Fetch real data: Use
yfinancefor up-to-date fundamentals. - Apply custom criteria: Filter stocks based on your investment strategy.
Potential Enhancements:
- More Criteria: Add technical indicators (moving averages, RSI from historical data), dividend yields, revenue growth, etc.
- Data Storage: Save fetched data to CSV or a database to avoid refetching every time.
- Error Handling: Improve robustness for missing data points or API issues.
- Scheduling: Automate the screener to run periodically.
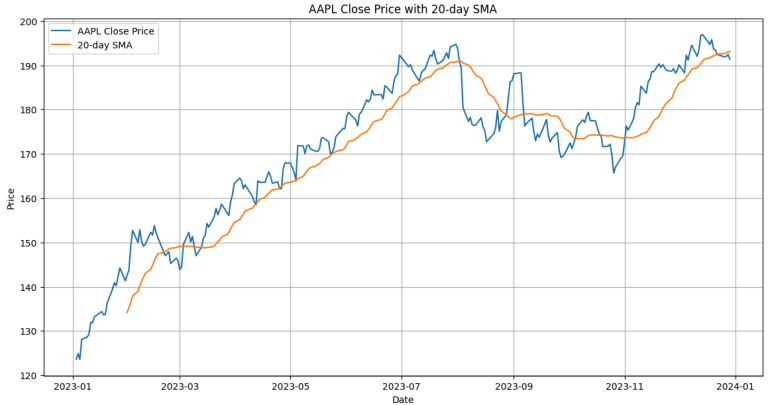
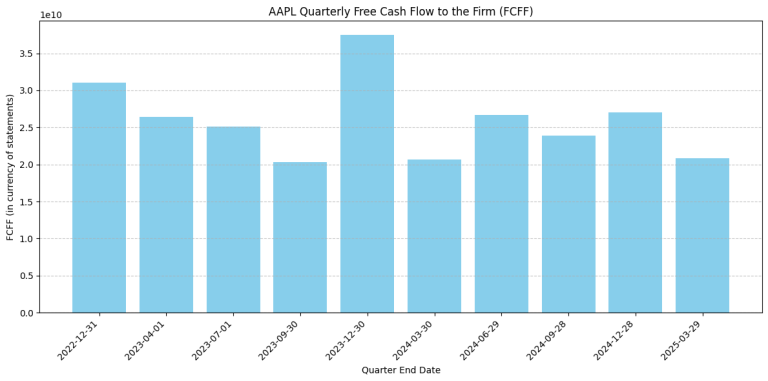
- Visualization: Plot results or historical performance of screened stocks.
Disclaimer: This code is for educational purposes only and does not constitute financial advice. Stock market data can have inaccuracies, and financial decisions should be made carefully, potentially with the help of a qualified professional. Ensure you comply with the terms of service for any data sources used (like Yahoo Finance via yfinance and Wikipedia).
Disclosure: This article was drafted with the assistance of AI and has been reviewed, edited, and verified by the human author.