My Python Bot Tried a Famous Stock Market ‘Glitch’. It Didn’t Go As Planned.
You know that feeling? The one you get right after a company like Apple or Nvidia drops its quarterly earnings report. You see the headline: “EARNINGS BEAT!” The stock pops 5% after hours. You think, “Duh, of course. The company is printing money.” You go to bed feeling smart.
Then you wake up, and the stock is… down? Or maybe it’s up 10%. Or maybe it just sort of… sits there. For days. While you scream at your monitor, “Don’t you people READ THE NEWS?!”
Welcome to the chaotic casino that is earnings season. For years, I’ve watched this circus, convinced it was just random noise. A bunch of Wall Street traders fueled by caffeine and anxiety, making bets on top of bets.
But what if it isn’t entirely random? What if there’s a ghost in the machine? An echo?
That’s what I heard about, anyway. It’s a famous market anomaly, a little “glitch” in the efficient market matrix that finance professors have written about for decades. It’s called Post-Earnings Announcement Drift, or PEAD if you want to sound like you belong at a hedge fund happy hour.
The idea is deceptively simple: When a company reports a big positive earnings “surprise” (way better than analysts expected), its stock doesn’t just jump and stop. It tends to keep drifting upward for the next 60 to 90 days. The same thing happens in reverse for big negative surprises.
Basically, the market is like that one friend who takes a full minute to get a joke. The information is out there, but it takes a while to fully sink in. For decades, this was as close to a free lunch as you could get in the stock market.
So, I did what any self-respecting tech columnist with a Python script does. I decided to build a bot to see if this ghost is real. Could I, from my command center (read: my laptop, on my couch, in pajamas), capture this legendary market inefficiency?
Getting Our Hands Dirty: The Python Ghost-Hunting Kit
First, a disclaimer. This isn’t financial advice. My lawyer, who is actually just me in a slightly more serious tone of voice, wants you to know this is for educational purposes only. We’re exploring, not investing our life savings.
Our mission is to write a Python script that:
- Picks a company (we’ll use Microsoft, an S&P 500 giant).
- Fetches its historical earnings announcement dates and analyst estimates.
- Calculates the “earnings surprise.”
- Travels back in time (computationally speaking) to “buy” the stock after a positive surprise.
- Holds it for 60 trading days to see if the “drift” paid off.
For this, we’ll need a few trusty Python libraries. yfinance is our time machine for stock prices, pandas is our super-smart spreadsheet, and we’ll pull some fundamental data from a financial data provider (there are several free and paid APIs available like Financial Modeling Prep or Alpha Vantage).
Here’s a look at the core logic.
iimport yfinance as yf
import pandas as pd
from datetime import datetime, timedelta

# Let's imagine we have our earnings data in a CSV file.
# In the real world, you'd get this from a data provider's API.
# The format would be: 'date', 'reportedEPS', 'estimatedEPS'
# For this example, let's create a dummy DataFrame for Microsoft (MSFT).

data = {
    'date': ['2022-01-25', '2022-04-26', '2022-07-26', '2022-10-25',
             '2023-01-24', '2023-04-25', '2023-07-25', '2023-10-24'],
    'reportedEPS': [2.48, 2.22, 2.23, 2.35, 2.32, 2.45, 2.69, 2.99],
    'estimatedEPS': [2.31, 2.19, 2.29, 2.30, 2.29, 2.23, 2.55, 2.65]
}
earnings_df = pd.DataFrame(data)
earnings_df['date'] = pd.to_datetime(earnings_df['date'])

# Calculate the "surprise" percentage
earnings_df['surprise_pct'] = ((earnings_df['reportedEPS'] - earnings_df['estimatedEPS'])
                               / earnings_df['estimatedEPS']) * 100

# Let's define a "big positive surprise" as anything over 5%
positive_surprises = earnings_df[earnings_df['surprise_pct'] > 5.0]

print("Positive Surprise Dates Found:")
print(positive_surprises)

# --- The Backtesting Engine ---
ticker = "MSFT"
msft = yf.Ticker(ticker)
hist_prices = msft.history(period="5y")

# --- THIS IS THE FIX ---
# Remove timezone information to allow for comparison with naive dates
hist_prices.index = hist_prices.index.tz_localize(None)
# --------------------

trade_results = []
HOLDING_PERIOD = 60 # Days

for index, row in positive_surprises.iterrows():
    announcement_date = row['date']

    # Find the first trading day on or after the announcement
    # This comparison now works because both dates are timezone-naive
    entry_date_series = hist_prices.index[hist_prices.index >= announcement_date]

    if not entry_date_series.empty:
        entry_date = entry_date_series[0]

        # Find the exit date 60 trading days later
        entry_loc = hist_prices.index.get_loc(entry_date)
        exit_loc = entry_loc + HOLDING_PERIOD

        if exit_loc < len(hist_prices):
            exit_date = hist_prices.index[exit_loc]

            entry_price = hist_prices.loc[entry_date]['Close']
            exit_price = hist_prices.loc[exit_date]['Close']

            trade_return = ((exit_price - entry_price) / entry_price) * 100

            trade_results.append({
                'entry_date': entry_date.date(),
                'exit_date': exit_date.date(),
                'entry_price': entry_price,
                'exit_price': exit_price,
                'return_pct': trade_return
            })

# Display the results of our simulated trades
results_df = pd.DataFrame(trade_results)
print("\n--- Backtest Results ---")
print(results_df)

if not results_df.empty:
    average_return = results_df['return_pct'].mean()
    print(f"\nAverage return over {HOLDING_PERIOD} days after a positive surprise: {average_return:.2f}%")
else:
    print("\nNo trades were executed based on the criteria.")
So, Did We Get Rich?
After running my script, I leaned in close. The results? A resounding… “meh.”
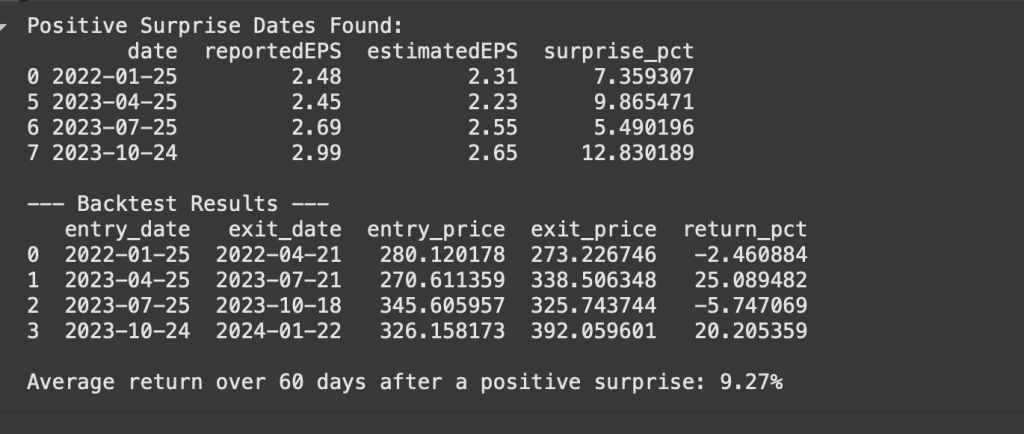
My first reaction looking at that average return of 9.27% was, “Jackpot!” An average 9% return in three months? That’s incredible. Sign me up!
But then I looked at the individual trades. And the story changed. This wasn’t a smooth ride to riches; it was a stomach-churning, whiplash-inducing rollercoaster.
Let’s walk through what my bot did.
On January 25, 2022, Microsoft posted a solid 7.4% earnings beat. My bot dutifully “bought” the stock. Sixty trading days later? It had lost 2.5%. The free lunch was a moldy sandwich. I was ready to scrap the whole project.
But a year later, on April 25, 2023, the bot found an even bigger surprise: a nearly 10% beat. It rolled the dice again. The result? A massive 25% gain. Okay, now we’re talking! The ghost in the machine was real, and it was glorious.
Then, just three months after that, it happened again. Another positive surprise. My bot, flush with its recent success, bought in. And promptly lost almost 6%. The ghost giveth, and the ghost taketh away.
Finally, in October 2023, it saw the biggest surprise of all: a 12.8% beat. One last trade. One last spin of the wheel. The result? A 20% gain.
The final average looks amazing. But imagine actually living through that. Would you have stuck with the strategy after it failed miserably right out of the gate? Would you have had the nerve to trust it again after it followed a 25% win with a 6% loss? Be honest. I’d have been a nervous wreck.
The Ghost Has a New Haunt
But the story doesn’t end there. Just as I was about to shut down my ghost-hunting operation, I stumbled upon the new, modern twist. The drift hasn’t disappeared; it has just moved.
Researchers are finding that the real, exploitable drift today isn’t in the numbers anymore. It’s in the words.
They call it “PEAD.txt.”
The new game is about analyzing the sentiment of the earnings call transcript. Is the CEO’s tone confident or hesitant? What specific words are they using? Are they talking more about “headwinds” or “tailwinds”? This qualitative data, it turns out, contains a ton of information that the market is still slow to digest. AI models are being built to read these reports and listen to these calls, hunting for the subtle clues that predict the real drift.
So what did my little Python experiment teach me?
It taught me that in the modern financial market, the easy glitches have been patched. You can’t just run a simple script on a well-known anomaly and expect to print money. The big players, with their HFT algorithms and AI-powered text scanners, have already changed the game.
But it also showed me that the power of code is not about finding a magic money-making button. It’s about being able to ask the questions yourself. It’s about pulling back the curtain and seeing, with your own eyes, how the machinery works. My bot didn’t find a ghost, but it did find a story: the story of a market that is constantly evolving.
And now I have a new project: a bot that can learn to read. Watch out, Wall Street. My pajamas and I are coming for your adjectives.